Showing posts with label пирамида. Show all posts

Tuesday, May 28, 2024

Age structure changes and the potential for demographic dividends


May 20, 2024 Markus Dörflinger and Elke Loichinger

The demographic dividend describes the economic growth potential based on shifts towards a larger share of working-age population when fertility declines in the course of the demographic transition.Markus Dörflinger and Elke Loichinger’s global analysis from 1950 to 2100 reveals notable differences – associated with fertility, migration, and population momentum – in the patterns of change in the share of working-age population across countries.

Demographic transition describes the universal process of declining mortality and fertility, which results in age structure shifts towards an increasing share of working-age population (ages 15–64). The potential economic benefits deriving from a large share of economically active individuals are referred to as the demographic dividend (Bloom et al. 2003). This concept is now widely used in development cooperation. Based on the experience of Asian countries, such as the so-called tiger states Hong Kong, Singapore, South Korea and Taiwan, changes in age structure – in combination with investments in education and health, infrastructure, good governance, and productive employment opportunities – are expected to be important drivers of economic growth and development in countries where the demographic transition is still less advanced (e.g., in countries in sub-Saharan Africa).

Given this expectation, in a recent article (Dörflinger and Loichinger 2024) we investigated past, present, and future global patterns of change in working-age populations. How uniform are these changes across countries? Which demographic factors are associated with them and what does this imply for the prospect of reaping demographic dividends in the future?

Similarities and differences in age structure changes


Changes in age structure are not as uniform across countries as sometimes expected. Rather, distinct patterns of changes in the share of working-age population can be found. A large proportion of countries where the share of working-age population has already peaked are now showing patterns that deviate substantially from the prototypical one, which draws upon the experience of selected Asian countries (Figure 1 and Table 1, Cluster 3). In many countries, the share of the working-age population increased more slowly and for longer, eventually reaching lower relative maxima (Clusters 1 and 2), while in a set of Asian countries (e.g., countries of the Gulf Cooperation Council, Iran, and Singapore) even faster increases and/or higher maximum shares of working-age population have been observed (Clusters 4 to 6).
In contrast to the countries analyzed above (referred to as observed countries), where the proportion of the working-age population is already declining, in over 100 countries worldwide, the proportion is still projected to increase (further) (prospective countries). Hence, these countries still have the potential to reap the benefits of a demographic dividend. However, in most of them, the share of their working-age populations is likely to increase more slowly and for longer, and to reach a lower maximum (Figure 2). This is particularly the case in countries of sub-Saharan Africa and Oceania. As the potential for a demographic dividend also depends on these factors, the potential economic benefits due to age structure changes may be smaller in these countries (Eastwood and Lipton 2011; Kotschy et al. 2020; Mason et al. 2017).

Associated demographic factors


Changes in the share of working-age population in the course of the demographic transition are mainly attributed to three factors. First, fertility level and the speed of fertility decline play a key role. For instance, fast fertility declines have contributed to rapid and high-peaking increases in the share of working-age population in Eastern and Southeastern Asian countries. In many sub-Saharan African countries, instead, fertility rates are projected to decline much more slowly, also decelerating subsequent age structure changes.

Second, migration can have an impact on the age structure. For instance, some of the countries that experienced exceptional peaks in the working-age population in the past, such as the United Arab Emirates and Qatar, are high-immigration countries. Conversely, emigration can reduce the proportion of working-age individuals.

Third, population momentum seems to slow down increases in the share of working-age population. Population momentum describes the effect of cohort sizes on population growth and age structure changes. For example, if the number of births per woman decreases but population momentum is high and the number of women of childbearing age increases, the total number of births does not necessarily decrease. Hence, shifts towards a large working-age population are slowed down. Population momentum is particularly pronounced in countries where fertility is still relatively high.

Implications for policy makers


Given these remarkable differences in the patterns of age structure change, it is essential to pay attention to the specific demographic situation of each country to properly assess the circumstances that will optimize the potential benefits of the demographic dividend. The positive experiences of selected countries in the past may not be replicable elsewhere in the future. Moreover, it is crucial for development planners of national and international organizations and local decision makers to understand the associations between age structure and fertility decline as well as the role of migration and population momentum in this context. These associations should be kept in mind when discussing the role of demographic developments for economic growth through the demographic dividend. Otherwise, the importance of fast fertility declines for age structure changes may be misjudged and the potential for development and economic growth may be overestimated.

References

  • Bloom, D.E., Canning, D., and Sevilla, J. (2003). The Demographic Dividend: A New Perspective on the Economic Consequences of Population Change. Santa Monica: RAND Corporation.
  • Dörflinger, M., and Loichinger, E. (2024). Fertility decline, changes in age structure and the potential for demographic dividends: A global analysis. Demographic Research 50(9), 221-290.
  • Eastwood, R., and Lipton, M. (2012). The Demographic Dividend: Retrospect and Prospect. Economic Affairs 32(1): 26-30.
  • Kotschy, R., Suarez Urtaza, P., and Sunde, U. (2020). The demographic dividend is more than an education dividend. Proceedings of the National Academy of Sciences 117(42): 25982-25984.
  • Mason, A., Lee, R., Abrigo, M., and Lee, S.-H. (2017). Support Ratios and Demographic Dividends: Estimates for the World. New York: United Nations (Technical Paper No. 2017/1).
  • UN DESA (2022): World Population Prospects 2022, Online Edition. New York: United Nations.

Monday, March 13, 2023

loneliness

Older adult loneliness on the rise around the world

March 13, 2023 Lauren Newmyer, Ashton M. Verdery, Haowei Wang and Rachel Margolis

Population aging is contributing to an increase in loneliness around the world. Lauren Newmyer, Ashton M. Verdery, Haowei Wang, and Rachel Margolis explore loneliness among late-middle-aged and older adults and the reasons behind this rapid rise.


Loneliness is a crucial aspect of mental health and social well-being (Newmyer et al. 2022). It is a major concern for policymakers because of its strong negative effects on mental health (e.g., depression and anxiety), and can also lead to unhealthy behaviors (e.g., smoking and alcohol consumption), chronic conditions (e.g., hypertension and stroke), and even increased mortality risk (Domènech-Abella et al. 2019; Lara et al. 2020; Stickley et al. 2013). Loneliness is a person’s subjective feeling that their social network is deficient, whether in quality or in size (Perlman and Peplau 1981; Weiss 1973).

Older adults are at increased risk for loneliness. There is a U-shaped age pattern of loneliness: levels among adults aged 18-29 are higher than in middle age, and then decrease into middle age, before increasing again in later life starting around age 65 (Nicolaisen and Thorsen 2014). This strong correlation with age suggests that loneliness might become a larger concern in the future due to population aging.

Although much research has examined how population aging around the world will shape everything from economies and health-care systems to caregiving structures and urban planning, our research is the first, we think, to examine how it will affect levels of loneliness.

We exploit survey data from 27 countries to assess loneliness by country, age and sex using a single item. We then pair this information with projections from the UN World Population Prospects to model historical and projected changes in loneliness.

Rising tide of concern


We examined the demography of loneliness among late-middle-aged and older adults using data from surveys representing almost half of the world’s current population of people over age 50. These surveys are the Chinese Health and Retirement Longitudinal Survey (CHARLS), the English Longitudinal Study of Aging (ELSA), the Health, Aging, and Retirement in Thailand (HART) study, the U.S. Health and Retirement Study (HRS), the Indonesia Family Life Survey (IFLS), the Korean Longitudinal Survey of Aging (KLoSA), the Mexican Health and Aging Study (MHAS), the Survey of Health, Aging and Retirement in Europe (SHARE), and the Irish Longitudinal Study on Aging (TILDA). As to be expected, loneliness is common among late-middle-aged and older adults around the world. In the majority of countries in our sample, more than 10% of adults in these age groups report being lonely, and in 17 of 27 countries the share was above 25%.

The prevalence of loneliness and the rate of population aging are two important factors determining the rising tide of loneliness around the world. Changes in the age and sex distribution of populations will lead to increases in loneliness among adults over age 50 in all countries in our sample, but with increasing variability across countries (see Figure 1 below). In some countries, like Greece, Croatia, Italy, and the Republic of Korea, lonely adults over age 50 will soon comprise a fifth to a quarter of the total population, while in others, such as Denmark, England, and Indonesia, the share is set to remain quite low.
Our results show that loneliness in late middle age and older adulthood affects more women than men globally, and this gap is projected to widen in the future (see Figure 2 below).

Ways to confront challenges arising from increased loneliness


Expected demographic changes imply massive increases in loneliness at ages 50 and above. Assuming constant age- and sex-specific rates of loneliness, the number of lonely adults in these age groups in our sample countries is set to triple from 105 million in 1990 to 333 million in 2050. Opportune policy interventions aimed at families and communities should make it possible to lower this total, however. Policymakers and communities should consider investing more in programs to reduce rates of loneliness through increased social support.

References

  • Domènech-Abella, Joan, JordiMundó, JosepMaria Haro, and Maria Rubio-Valera. 2019. “Anxiety, Depression, Loneliness and Social Network in the Elderly: Longitudinal Associations from the Irish Longitudinal Study on Ageing (TILDA).” Journal of Affective Disorders 246: 82–88. https://doi.org/10.1016/j.jad.2018.12.043.
  • Lara, Elvira, Darío Moreno-Agostino, Natalia Martín-María, Marta Miret, Laura Alejandra Rico-Uribe, Beatriz Olaya, María Cabello, Josep Maria Haro, and José Luis Ayuso-Mateos. 2020. “Exploring the Effect of Loneliness on All-Cause Mortality: Are there Differences Between Older Adults and Younger and Middle-Aged Adults?” Social Science & Medicine 258: 113087. https://doi.org/10.1016/j.socscimed.2020.113087.
  • Newmyer Lauren, Ashton M. Verdery, Haowei Wang, and Rachel Margolis. 2022. “Population Aging, Demographic Metabolism, and the Rising Tide of Late Middle Age to Older Adult Loneliness Around the World.” Population and Development Review 48(3): 829-862. https://doi.org/10.1111/padr.12506
  • Nicolaisen, Magnhild, and Kirsten Thorsen. 2014. “Who are Lonely? Loneliness in Different Age Groups (18–81 Years Old), Using Two Measures of Loneliness.” International Journal of Aging and Human Development 78(3): 229–257. https://doi.org/10.2190/AG.78.3.b
  • Perlman, Daniel, and L. Anne Peplau. 1981. “Toward a Social Psychology of Loneliness.” In Personal Relationships in Disorder, edited by M. Duck and R. Gilmour, 31–56. London: Academic Press.
  • Stickley, Andrew, Ai Koyanagi, Bayard Roberts, Erica Richardson, Pamela Abbott, Sergei Tumanov, and Martin Mckee. 2013. “Loneliness: Its Correlates and Association with Health Behaviours and Outcomes in Nine Countries of the Former Soviet Union.” PLoS ONE 8(7): e67978. https://doi.org/10.1371/journal.pone.0067978
  • Weiss, Robert S. 1973. Loneliness: The Experience of Emotional and Social Isolation. Cambridge: MIT Press

Friday, May 14, 2021

ethnic subpopulations of Spain

Сегодня я могу внести свой вклад в # 30DayChartChallenge, анимацию с возрастными пирамидами 50 национальностей с наибольшим присутствием в Испании, согласно последнему регистру @es_INE. pic.twitter.com/kfnKb0kBTI

Rusa — очень странная как и многие другие — половое соотношение в первую очередь — откуда дровишки? — естественный вопрос

Или это испанское население только? НЕТ 50 национальностей с наибольшим присутствием в Испании
теперь понятнее

Sunday, December 20, 2020

age-sex structure, population of Russia, ! Jan 2020

Возрастно-половая структура населения Российской Федерации на 1 января 2020 г. (тыс чел)


Monday, June 8, 2020

Social distancing and social contact before COVID-19

при этом подозреваю: социальная дистанция — это на самом деле не социальная дистанция, а вполне физическая
почему слова теряют смысл? мне непонятно


нaведение пойнтера на кортинко покажет её название: фиг 1 и 2, но не только

Abstract:

Subsequent to the arrival of SARS-CoV-2 and emergence of COVID-19, policy to limit the further spread has focused on increasing distance between individuals when interacting, termed social distancing, and limiting the frequency of interaction by preventing non-essential and large-scale social gatherings. This work offers cross-cultural insight into social distancing and social interactions in the pre-pandemic period. Combining unique data on frequency of contact, religious service attendance and preferred interpersonal distance in 20 countries, this work considers variation in the extent to which social distance was already practiced without official recommendations and underscores notable cross-cultural variation in the extent to which social interaction occurred. Results suggest that policy intervention should emphasise certain behavioural changes based on pre-existing context-specific patterns of interaction and interpersonal distance rather than a one-size-fits-all approach.

Keywords: #Interpersonal_distance (мутновато, но таки ближе, чем следующее), #Social_distance, #Social_interaction, SARS-CoV-2, #COVID-19, #Coronavirus

Figure 1: Relationships between social contact, religious service attendance and interpersonal distance
The clustered scatter plots show pre-pandemic comparisons of social contact, religious service attendance and interpersonal distance (preferred distance from strangers, acquaintances and close friends). The scale is standardized and reports z-scores for the measures on the y-axis and x-axis. On both axes, higher values indicate greater interpersonal distance and more frequent social interaction. A hypothetical context, labelled “Soc. Res.”, indicates a socially restricted context with average interpersonal distance maintained in accordance with WHO recommendations (100cm) and limited social contact (meeting friends once a month and no religious service attendance). Similar groupings of countries are encircled and highlighted in the same colour.
Figure 2: Cluster analysis of social contact, religious service attendance and interpersonal distance by age, sex and overall
The cluster analysis shows pre-pandemic measures of social contact, religious service attendance and interpersonal distance (preferred distance from strangers, acquaintances and close friends) by age, sex and overall. To present the analysis, standardised cluster plots are used the report two scaled dimensions of the cluster analysis.  The x-axis and y-axis indicate relative position on scales derived from first and second order dimensions in terms of the extent to which within-group variation is explained.  A hypothetical context, labelled “Soc. Res.”, indicates a socially restricted context with average interpersonal distance maintained in accordance with WHO recommendations (100cm) and limited social contact (meeting friends once a month and no religious service attendance), which was included in the estimation of the clusters.  Similar groupings of countries are encircled and highlighted in the same colour.

Thursday, October 18, 2018

Economic population pyramid

Monday, June 11, 2018

changing family and age composition

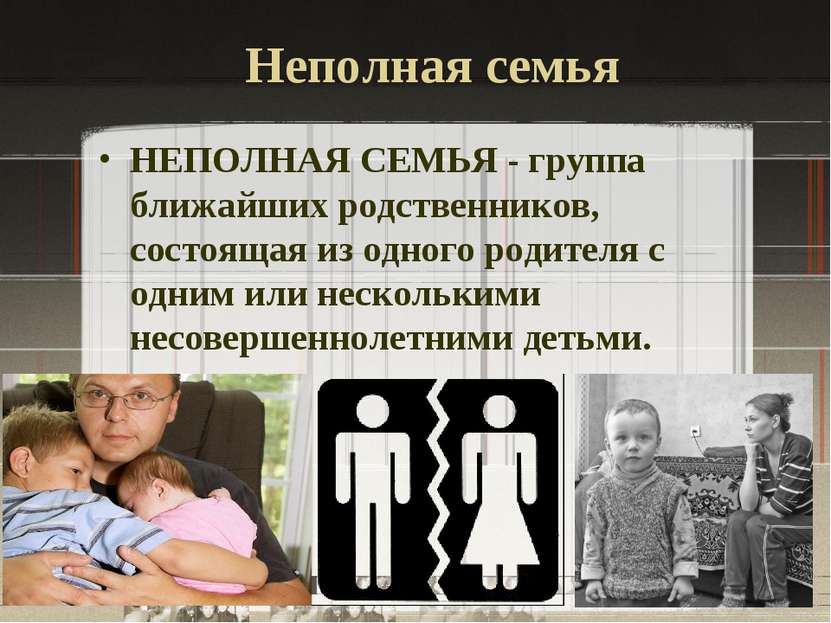
неполная семья
Министерство образования и науки Украины с прошлого года проводит «антидискриминационную экспертизу школьных учебников», которые готовятся к печати за государственный счет. В ходе этой работы ведомство выявило ряд ​«вопиющих случаев дискриминации», говорится в сообщении на сайте ведомства [или см каменты].

К ним, по информации министерства, в частности, относится использование в учебных книгах «недопустимых для демократической страны анахронизмов вроде высказываний «негры», «жиды», «цыгане».

Помимо этого экспертиза, как рассказали украинские власти, обнаружила, что «большинство детей не могут найти в украинских учебниках ни отражения себя, ни отражения своих родных, ни тех особых обстоятельств, в которых они живут». Так, в интернете, по информации ведомства, «появился образец рекомендации антидискриминационной экспертизы, где специалисты советуют заменить слово «родители» на слово «родные» в задании: «Вместе с родителями обсуди, где можно играть». Часть общества не поняла целесообразности этого замечания, хотя оно напрямую касается защиты почти половины украинских детей», — подчеркивается в сообщении пресс-службы Минобрнауки Украины. Сейчас, как пояснили в министерстве, ​на Украине 3 млн детей (почти 40%) проживают в неполных семьях. Речь в данном случае, по данным ведомства, идет также о детях, которые живут с дедушками и бабушками, со старшими братьями и сестрами или с тетями и дядями.

«Ситуация особенно обострена, так как часть детей потеряла своих родителей в результате российской агрессии на востоке Украины», — сообщили в пресс-службе, заметив, что, таким образом, задача в учебнике вроде «вместе с родителями составьте распорядок дня вашей семьи» или «вместе с родителями обсуди, где можно играть» подчеркивают ограниченные возможности почти половины украинских детей и заставляют их чувствовать собственную неполноценность». Это, как отметили в украинском министерстве, «недопустимо». «Именно поэтому и предложено заменить слово «родители» на «родные», — заключили в ведомстве.

Помимо этого, как выяснили в украинском Минобрнауки, в школьных учебниках «полностью отсутствуют герои, представляющие людей с инвалидностью, а престарелые изображаются исключительно немощными». «Сегодня 6% населения нашей страны — около 2,5 млн человек — это люди с инвалидностью. Сейчас в школы, в инклюзивные классы приходят дети с особыми образовательными потребностями. Именно антидискриминационная экспертиза дала возможность включить в учебники людей с инвалидностью и сделать их частью картины мира, которую создает школа у детей, изменить образ пожилых людей», — говорится в сообщении на сайте министерства.

В целом же проделанная местным Минобрнауки работа, как рассказали в ведомстве, ​«предполагает выявление и устранение всех признаков, по которым может происходить дискриминация в соответствии с законами Украины, в частности, ст. 1 закона «О принципах предотвращения и противодействия дискриминации на Украине».

РБК

Tuesday, June 5, 2018

The Changing Capabilities of Cohorts of the Elderly in Russia

Journal of Population Ageing June 2018, Volume 11, Issue 2, pp 153–208| Cite as

The Changing Capabilities of Cohorts of the Elderly in Russia during 1990–2020: Measurement using a Quantitative Index


Russia has had a high elderly share of its population like the OECD countries but has had a more turbulent history over the past 100 years, which has caused fluctuations in the capabilities of those turning 60 (measured by education and training, income, enabling environment, medical care, and health status). This article analyses the life experiences and capabilities of five Russian birth cohorts turning 60 over the period 1990–2020. It presents relevant concepts, reviews past research, and evaluates the importance of health factors (health environment, health-related behaviors, medical care, health status) in determining the activities and contributions of older people in Russia. A Human Capabilities of the Elderly in Russia Index (HCERI) with 22 indicators is developed. Russian data are used in the calculation of the HCERI for the cohorts turning 60 in 1990, 1995, 2000, 2010 and 2020. The article then presents evaluations of the experiences and changes in capabilities for each of the five selected cohorts of the elderly in four periods of life: Childhood (1–15 years), Young Adult (16–49), Mature Adult (50–59), and Early Elderly (60–69). The implications of changes in the characteristics of the elderly for Russian government policies are discussed.

Keywords Elderly Cohorts Capabilities Human capital Russia Quantitative index 

The goals of this article are to answer four related questions:
  1. What is an appropriate multi-dimensional quantitative index to measure the evolution over time of the capabilities of the elderly in Russia?
  2. Have the population groups entering old age in Russia from 1990 onwards remained impoverished, poorly educated and unhealthy, or have improvements in their capabilities meant that they can provide substantial benefits to the economy and society, as in leading OECD countries?
  3. How important have health factors (health environment, health-related behaviors, medical care, health status) been in determining the activities and contributions of the elderly in Russia?
  4. What are the implications of projected population aging and changes in the capabilities of the elderly for the policies of the Russian government out to 2020?
пирамидка
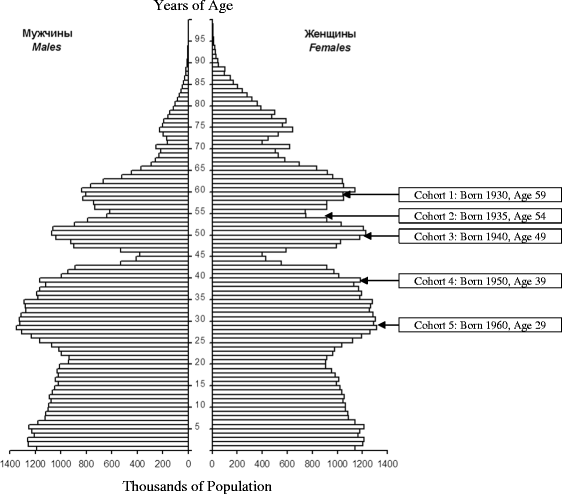
Russia age-gender population pyramid in 1989 and five birth cohorts of the elderly. 
Source: The population pyramid is from GKRFS Demograficheskii 2015, 28. 
The author drew the five cohort boxes.

Monday, November 27, 2017

new sexual revolution

или гендерная?

8 ноября 2017 года, в почти революционный день, произошла еще одна маленькая революция: Верховный суд Германии разрешил вносить графу «третий пол» в свидетельство о рождении.
орландо

Теперь же рядом со словом «пол» могут появиться слова «разный», «другой» или «интерсекс». С точными формулировками властям придется определиться в течение ближайшего года.

Помимо Германии гендерная небинарность, то есть возможность самоопределения не только как «мужчина» или «женщина», юридически закреплена еще в нескольких странах, таких как Канада, Австралия, Индия, Таиланд. В остальном же мире такие люди вынуждены подстраиваться под стандарты бинарного восприятия пола и зачастую сталкиваться с непониманием со стороны социума.

Friday, July 28, 2017

ethnic demography

Нашол кое-какие демографические оттенки в статье
С.В. Соколовский. Четверть века российской антропологии: 1975-2000 // Этнометодология: проблемы, подходы, концепции.Вып. 9. М., 2003. С.136-159

четыре года дискуссии о первобытном обществе, Кузьминов не на пустом месте —
В 1985 году защитил кандидатскую диссертацию, посвящённую экономике общинных отношений...
в 2008 году в ВШЭ перешел коллектив демографов во главе с Анатолием Вишневским. «Принципы нашего роста и нашей кадровой политики всегда были очень просты. Если мы видим людей, которые релевантны нам по культуре, которые живут в глобальном научном сообществе и которые могут сами поставить на ноги свой проект, то мы их приглашаем. Так мы приросли философами, историками, филологами, психологами и так далее. Масса исследовательских институтов Вышки возникла именно таким образом»

Wednesday, June 8, 2016

AgeGender Composition of China, 2010


Население, половозрастной состав
中华人民共和国 Китайская народная республика, перепись 2010 года
Женщины — ессно красные, мужчины — голубы е
левый столбик — год рождения (приблизительно)
влияние войны (МВ2) можно усмотреть токо в 39 и 43 году,
а вот большой скачок хорощо виден, но он и стоил раза в 2 дороже

Saturday, October 17, 2015

The end of the population pyramid


THE pyramid is a traditional way of visualising and explaining the age structure of a society. If you draw a chart with each age group represented by a bar, and each bar ranged one above the other—youngest at the bottom, oldest at the top, and with the sexes separated—that is the shape you get. The pyramid was characteristic of human populations since the day organised societies emerged. With lifespans short and mortality rates high, children were always the most numerous group, and old people the least. Now the shape of the global population is changing. Between 1970 and 2015 the dominating influence on the global population was the fertility rate, the number of children a woman would typically bear during her lifetime. It fell dramatically over the period, meaning that the world shifted from having larger to smaller families. The age groups start to become markedly smaller only about the age of 40, so the incline starts much further up the chart than with the pyramid. The shape looks more like the dome of the Capitol building in Washington, DC. Between 2015 and 2060 the biggest influence upon the population will be ageing. Small families are already becoming the norm, the fall in fertility is slowing down and now almost everyone is living longer than their parents—dramatically so in developing countries. So, by 2060, the dome will have come and gone and the shape of the population will look more like a column (or perhaps an old-fashioned beehive).
пирамиды

Saturday, November 9, 2013

The United Kingdom 1951-2011, Population Pyramid


Graphic by Office for National Statistics (ONS)
любопытно волноовое изменение числа рождений, у них тоже эхо войны ?
довольно существенное
и "вдруг" не работает, почему ? бум выяснять