Showing posts with label старение. Show all posts

Tuesday, February 11, 2025

AGING

Богатейшие люди мира увеличивают инвестиции в продление жизни


В Кремниевой долине индустрия долголетия превратилась в горячую инвестиционную нишу. Ожидается, что в 2025 году отрасль достигнет объёма в 578 млрд евро. Ведущая роль в её развитии принадлежит сверхбогатым людям. По данным швейцарского банка UBS, люди с состоянием от 48 миллионов евро готовы отдать половину своего богатства за дополнительные 10 лет жизни.

Один из таких людей — 47-летний предприниматель и биохакер Брайан Джонсон, который принимает более 50 таблеток в день, вводит себе плазму крови своего юного сына, постоянно мониторит сердечный ритм и активность мозга, а также содержит команду из 30 специалистов, помогающих ему бороться со старением. Цена вопроса — 1,9 млн евро в год.

Основатель Amazon Джефф Безос вложил 2,9 млрд евро в биотехнологическую компанию Altos Labs. Миссия стартапа — перепрограммировать клетки организма, чтобы остановить или даже обратить процесс старения. Сооснователь PayPal Питер Тиль инвестировал 6,5 миллиона евро в фонд Methuselah, который также занимается исследованиями старения. Глава Open AI Сэм Альтман вкладывается в Retro Biosciences, проект с похожими целями. Говорят, что на ВЭФ в Давосе он активно искал новых инвесторов.

Марк Бернеггер, сооснователь Longevity Investors, объединяет миллиардеров, учёных и предпринимателей, чтобы двигать индустрию долголетия вперед. Он говорит:

«Я хочу жить столько, сколько буду счастлив и здоров. С научной точки зрения, 90–120 лет — вполне реально»

Изменит ли мода на подобные инвестиции будущее всех людей — вопрос времени и денег, резюмируют в редакции BILD.

Saturday, February 1, 2025

age


Самые старые страны мира


В среднем по миру, только 10.4% живущих на нашей планете находятся в возрасте старше 65 лет. В Монако же пожилых... 36% от всего населения! В Японии - 30%, в замыкающей тройку лидеров Святой Елене (это такая "страна", остров Святой Елены, с 4 тысячами человек населения) пожилых оказалось 27.8%

В этом году список "старых стран" (где доля населения в возрасте 65+ превышает 20%) пополнился сразу пятью странами: Швейцарией, Южной Кореей, Канадой, Румынией и Тайванем, а общее число таких стран достигло 43...

Monday, January 20, 2025

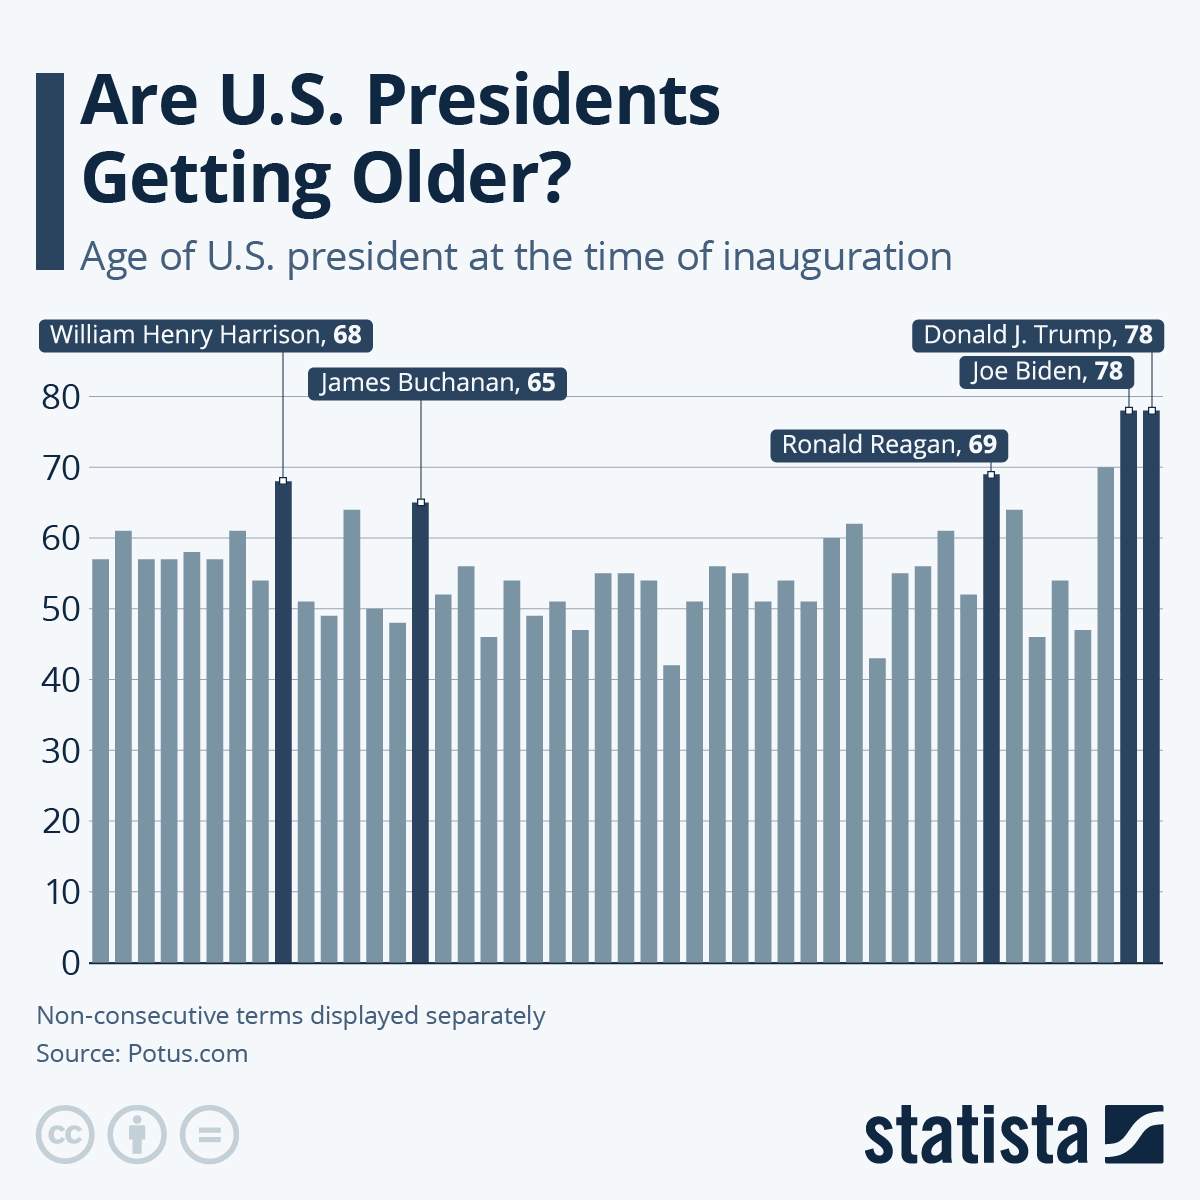
Are U.S. Presidents Getting Older?

Are U.S. Presidents Getting Older?Joe Biden and Donald Trump are the oldest presidents ever to be inaugurated in the United States. While Biden was 78 years old in 2021 and remains a one-term president, Trump was 70 at the time of his inauguration in 2017 and is 78 starting his second, non-consecutive term on Monday. Ronald Reagan, who was 69 years old in 1981, comes third. Like Biden, Trump's age will be 82 when finishing his term. Biden would have been 86 years old at the end of a hypothetical second term.

Taking a look at all presidents’ ages at the time of their inauguration since 1789, no clear trend is visible. Before Trump and Biden, presidents’ ages were actually well below average. Barack Obama took office at 47 years and 169 days, according to Potus.com, making him the fifth youngest president at the time of inauguration. Bill Clinton, who was 46 when he took over, was the third youngest - only John F. Kennedy (43) and Teddy Roosevelt (42) were younger.

Some of the oldest presidents hail from past centuries. William Henry Harrison was 68 at his inauguration in 1841 (he died a month later of typhoid and pneumonia), making him the fourth-oldest president ever. James Buchanan, who took office in 1857, was the fifth-oldest president at 65


Американские президенты стареют?

Лет 50-100 назад среднему американскому президенту на момент инаугурации было порядка 50 лет - иногда чуть больше, иногда чуть меньше, но в среднем цифры были такие

Трампу сейчас 78 - столько же, сколько было Байдену четыре года назад, когда он только вступал в должность. И это два самых старых в истории президента США! Предыдущий рекорд был у Трампа в его прошлый срок, а до это максимальным результатом были 69 лет Рейгана

Tuesday, September 10, 2024

Disability-free grandparenthood in Italy: changes between 1998 and 2016

September 9, 2024 Margherita Moretti, Elisa Cisotto and Alessandra De Rose 

In Italy, grandparents are a fundamental source of care for children, and families are the main source of support for older individuals. Margherita Moretti, Elisa Cisotto and Alessandra De Rose study disability-free grandparenthood in Italy, its evolution between 1998 and 2016, and the drivers of the changes observed.


In the 20th century, Europe underwent significant demographic changes, including increased life expectancy and lower birth rates, leading to rapid population aging. Living longer means that different generations overlap for more years. However, lower and delayed fertility often result in people assuming family roles, such as grandparenthood, at older ages. As the transition to grandparenthood occurs later in life, the health status of grandparents becomes a crucial factor. Their health can strongly influence both the duration and quality of intergenerational relationships, determining whether grandparents are net providers or recipients of care (Grundy, 2005). This dynamic can affect family interactions and adult children’s outcomes, including labour force participation and fertility decisions (Moussa 2019, Rutigliano 2020). Gender differences also play a role, with women typically becoming grandparents earlier and living longer than men, but often experiencing poorer health.

Grandparents’ health in Italy


Italy is characterized by low fertility rates and high survival (Billari e Tomassini 2021), combined with a strong family-focused welfare system that emphasizes robust support networks among family members throughout life (Dykstra and Fokkema 2011). Furthermore, public care provision for children and older individuals is often inadequate, leading Italian families to rely heavily on grandparents for childcare. Conversely, grandparents themselves depend on family support when they are in need of care, often placing a significant burden on young adults, especially women.

The average age at grandparenthood in Italy increased by three years between 1998 and 2016, both for men (59 to 62) and women (54 to 57; Cisotto et al. 2022). How has this affected the evolution of disability-free grandparenthood (DFGP)?

DFGP, originally proposed by Margolis and Wright (2017), indicates the average numbers of years lived as a disability-free grandparent, and it results from the combination of three different age-specific sets of risks: mortality, disability and grandparenthood. In a recent paper (Moretti, Cisotto and De Rose 2024) we estimated DFGP for Italians aged 65 and over between 1998 and 2016, focusing on gender differences and the drivers of change.
In 1998, Italian men aged 65 had a life expectancy of about 16 years, half of which were spent as healthy grandfathers. For women, the figures were about 20 years and 10 years, respectively. By 2016, life expectancy at age 65 had increased by over three years for men and by two and a half years for women. DFGP also increased to over 10 years for men and 12 years for women. In short, grandparents lived more disability-free years of overlap with their grandchildren in 2016 than 18 years before.

Despite longer life expectancy and DFGP, however, the proportion of life spent as grandparents after age 65 decreased for men, from 70% to 65%, and the gender gap in DFGP increased, with women enjoying nearly two more years of disability-free grandparenthood than men. In relative terms, in 2016, women had a higher proportion of their life expectancy at age 65 as grandmothers than men had as grandfathers (almost 70% for women and 65% for men). However, women spent a smaller share of their grandparent years free from disability (80% vs. 85% for men). Indeed, Italian women report more years of disability than men (Moretti & Strozza, 2022), both in general and in their years as grandmothers.

Drivers of changes in disability-free grandparenthood


Improvements in health and longer survival were the main reasons for increased DFGP over time (Figure 2). For men, however, the decrease in the prevalence of grandparents at younger ages, due to reduced and delayed grandparenthood, slowed the increase in grandparenthood years, and this is reflected in the smaller increase in disability-free grandparent years. For women, at younger ages (65 to 79), reduced mortality was the main reason for the increase in DFGP. At older ages, improvements in population health (lower disability prevalence) and a relatively constant prevalence of grandmothers were the most important factors. For men, instead, the changes in DFGP are explained almost totally by the lengthening of life. The decrease in the prevalence of grandfathers at younger ages (65 to 74), partially offsets the gains from reduced mortality and disability risks over the three decades (Figures 3 and 4).

Conclusions


These findings highlight the complex interplay between the factors that determine the evolution of healthy grandparenthood. They also show that policies aimed at improving the health and well-being of older adults also affect others, their relatives in particular, by modifying the likelihood that older family members will be net providers or receivers of care.

References

  • Billari, F.C. and Tomassini, C. (2021). Rapporto sulla popolazione: L’Italia e le sfide della demografia. Bologna: Società editrice il Mulino, Spa.
  • Cisotto, E., Meli, E., and Cavrini, G. (2022). Grandparents in Italy: Trends and changes in the demography of grandparenthood from 1998 to 2016. Genus 78(1): 10. doi:10.1186/s41118-022-00153-x.
  • Dykstra, P.A. and Fokkema, T. (2011). Relationships between parents and their adult children: A West European typology of late-life families. Ageing and Society 31(4): 545–569. doi:10.1017/S0144686X10001108.
  • Grundy, E. (2005). Reciprocity in relationships: Socio-economic and health influences on intergenerational exchanges between Third Age parents and their adult children in Great Britain. The British Journal of Sociology 56(2): 233–255. doi:10.1111/j.1468-4446.2005.00057.x.
  • Margolis, R. and Wright, L. (2017). Healthy grandparenthood: How long is it, and how has it changed? Demography 54(6): 2073–2099. doi:10.1007/s13524-017-0620-0.
  • Moretti, M., Cisotto, E., & De Rose, A. (2024). Uncovering disability-free grandparenthood in Italy between 1998 and 2016 using gender-specific decomposition. Demographic Research, 50, 1247–1264.
  • Moretti, M. and Strozza, C. (2022). Gender and educational inequalities in disability-free life expectancy among older adults living in Italian regions. Demographic Research 47(29): 919–934. doi:10.4054/DemRes.2022.47.2
  • Moussa, M.M. (2019). The relationship between elder care-giving and labour force participation in the context of policies addressing population ageing: A review of empirical studies published between 2006 and 2016. Ageing and Society 39(6):1281–1310. doi:10.1017/S0144686X18000053.
  • Rutigliano, R. (2020). Counting on potential grandparents? Adult children’s entry into parenthood across European countries. Demography 57(4): 1393–1414. doi:10.1007/s13524-020-00890-8.

Sunday, August 18, 2024

aging projection

Коэффициент демографической нагрузки пожилыми в разных странах мира: сейчас и в 2050


В среднем по миру, на 100 людей трудоспособного возраста приходится 16 пожилых (в возрасте 65+), но по странам картина меняется очень сильно

В Японии сейчас на 100 трудоспособных приходится 54.5 пожилых, а к 2050 году, по прогнозам, этот показатель вырастет до... 80.7! И если и текущая ситуация близка к катастрофе, то что будет в 2050 даже страшно подумать

В Германии, Италии и Франции этот показатель сейчас составляет около 40, к 2050 он будет в диапазоне от 54.5 во Франции до 74.4 в Италии (что тоже вполне себе катастрофично)

В Китае к 2050 демографическая нагрузка пожилыми окажется выше, чем в США и Канаде, и немногим ниже, чем сейчас в Японии. Здоровые числа из представленных стран к 2050 останутся только в Индии

У нас сейчас, по расчётам из свежей статьи, этот показатель - порядка 25 пожилых на 100 работоспособных, ко второй половине века он может вырасти до 60 в зависимости от сценария (в среднем - до 40)

aging victory

aging like a boss

Учёные близки к победе над старением. 


Исследователи из США разработали препарат, который регенерирует клетки и замедляет старение в несколько раз за счёт удлинения теломерных участков стволовых клеток.


Благодаря препарату уже удалось вылечить 12-летнюю овчарку от рака, а другой пожилой собаке вернули возможность ходить. Испытания на людях начнутся в 2025 году.

Tuesday, May 28, 2024

Age structure changes and the potential for demographic dividends


May 20, 2024 Markus Dörflinger and Elke Loichinger

The demographic dividend describes the economic growth potential based on shifts towards a larger share of working-age population when fertility declines in the course of the demographic transition.Markus Dörflinger and Elke Loichinger’s global analysis from 1950 to 2100 reveals notable differences – associated with fertility, migration, and population momentum – in the patterns of change in the share of working-age population across countries.

Demographic transition describes the universal process of declining mortality and fertility, which results in age structure shifts towards an increasing share of working-age population (ages 15–64). The potential economic benefits deriving from a large share of economically active individuals are referred to as the demographic dividend (Bloom et al. 2003). This concept is now widely used in development cooperation. Based on the experience of Asian countries, such as the so-called tiger states Hong Kong, Singapore, South Korea and Taiwan, changes in age structure – in combination with investments in education and health, infrastructure, good governance, and productive employment opportunities – are expected to be important drivers of economic growth and development in countries where the demographic transition is still less advanced (e.g., in countries in sub-Saharan Africa).

Given this expectation, in a recent article (Dörflinger and Loichinger 2024) we investigated past, present, and future global patterns of change in working-age populations. How uniform are these changes across countries? Which demographic factors are associated with them and what does this imply for the prospect of reaping demographic dividends in the future?

Similarities and differences in age structure changes


Changes in age structure are not as uniform across countries as sometimes expected. Rather, distinct patterns of changes in the share of working-age population can be found. A large proportion of countries where the share of working-age population has already peaked are now showing patterns that deviate substantially from the prototypical one, which draws upon the experience of selected Asian countries (Figure 1 and Table 1, Cluster 3). In many countries, the share of the working-age population increased more slowly and for longer, eventually reaching lower relative maxima (Clusters 1 and 2), while in a set of Asian countries (e.g., countries of the Gulf Cooperation Council, Iran, and Singapore) even faster increases and/or higher maximum shares of working-age population have been observed (Clusters 4 to 6).
In contrast to the countries analyzed above (referred to as observed countries), where the proportion of the working-age population is already declining, in over 100 countries worldwide, the proportion is still projected to increase (further) (prospective countries). Hence, these countries still have the potential to reap the benefits of a demographic dividend. However, in most of them, the share of their working-age populations is likely to increase more slowly and for longer, and to reach a lower maximum (Figure 2). This is particularly the case in countries of sub-Saharan Africa and Oceania. As the potential for a demographic dividend also depends on these factors, the potential economic benefits due to age structure changes may be smaller in these countries (Eastwood and Lipton 2011; Kotschy et al. 2020; Mason et al. 2017).

Associated demographic factors


Changes in the share of working-age population in the course of the demographic transition are mainly attributed to three factors. First, fertility level and the speed of fertility decline play a key role. For instance, fast fertility declines have contributed to rapid and high-peaking increases in the share of working-age population in Eastern and Southeastern Asian countries. In many sub-Saharan African countries, instead, fertility rates are projected to decline much more slowly, also decelerating subsequent age structure changes.

Second, migration can have an impact on the age structure. For instance, some of the countries that experienced exceptional peaks in the working-age population in the past, such as the United Arab Emirates and Qatar, are high-immigration countries. Conversely, emigration can reduce the proportion of working-age individuals.

Third, population momentum seems to slow down increases in the share of working-age population. Population momentum describes the effect of cohort sizes on population growth and age structure changes. For example, if the number of births per woman decreases but population momentum is high and the number of women of childbearing age increases, the total number of births does not necessarily decrease. Hence, shifts towards a large working-age population are slowed down. Population momentum is particularly pronounced in countries where fertility is still relatively high.

Implications for policy makers


Given these remarkable differences in the patterns of age structure change, it is essential to pay attention to the specific demographic situation of each country to properly assess the circumstances that will optimize the potential benefits of the demographic dividend. The positive experiences of selected countries in the past may not be replicable elsewhere in the future. Moreover, it is crucial for development planners of national and international organizations and local decision makers to understand the associations between age structure and fertility decline as well as the role of migration and population momentum in this context. These associations should be kept in mind when discussing the role of demographic developments for economic growth through the demographic dividend. Otherwise, the importance of fast fertility declines for age structure changes may be misjudged and the potential for development and economic growth may be overestimated.

References

  • Bloom, D.E., Canning, D., and Sevilla, J. (2003). The Demographic Dividend: A New Perspective on the Economic Consequences of Population Change. Santa Monica: RAND Corporation.
  • Dörflinger, M., and Loichinger, E. (2024). Fertility decline, changes in age structure and the potential for demographic dividends: A global analysis. Demographic Research 50(9), 221-290.
  • Eastwood, R., and Lipton, M. (2012). The Demographic Dividend: Retrospect and Prospect. Economic Affairs 32(1): 26-30.
  • Kotschy, R., Suarez Urtaza, P., and Sunde, U. (2020). The demographic dividend is more than an education dividend. Proceedings of the National Academy of Sciences 117(42): 25982-25984.
  • Mason, A., Lee, R., Abrigo, M., and Lee, S.-H. (2017). Support Ratios and Demographic Dividends: Estimates for the World. New York: United Nations (Technical Paper No. 2017/1).
  • UN DESA (2022): World Population Prospects 2022, Online Edition. New York: United Nations.

Monday, May 13, 2024

Low mortality drives population ageing in the long run

March 25, 2024 Gustavo De Santis and Giambattista Salinari

Higher survival, not low fertility, is the main long-term driver of population ageing. Adding some new elements to an old debate among demographers, Gustavo De Santis and Giambattista Salinari illustrate how they arrived at this conclusion and highlight some of the practical implications of their findings.


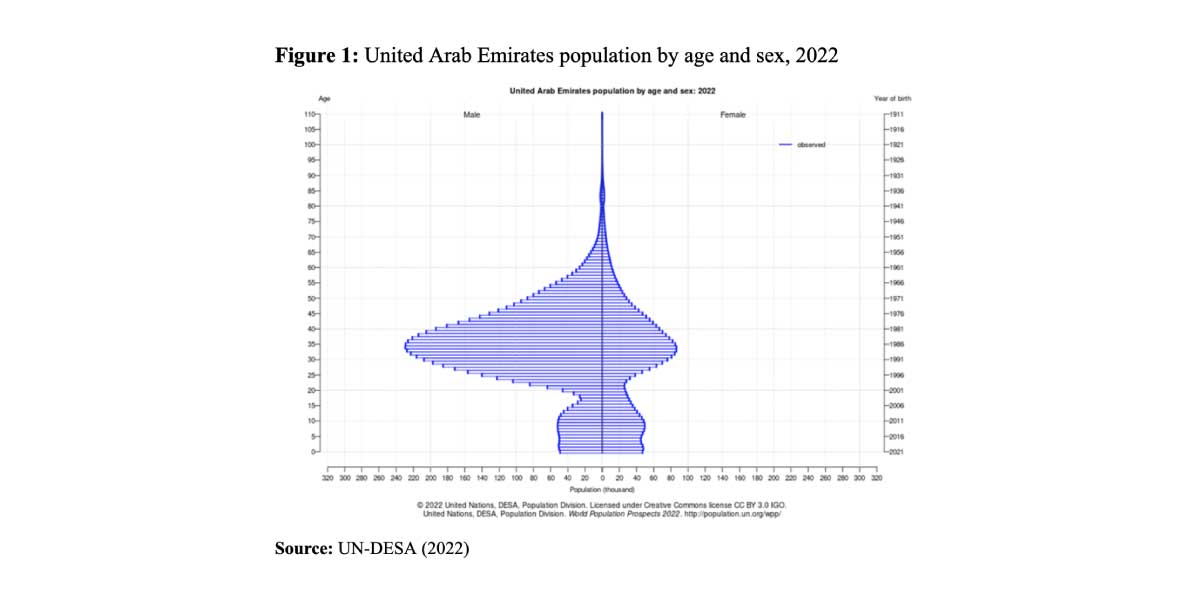
Demographers have long debated about the main drivers of population ageing. The contest is really only between fertility and mortality, as migration is known to play but a minor role, with the exception of small and peculiar realities (e.g. the United Arab Emirates in 2022 – Figure 1), and even then, usually just for limited periods of time.
The two opposing points of view are well summarized in these words:

Why are populations of rich countries so much older today than they were a century or two ago? … Common sense suggests that longer life is responsible for population ageing, but decades ago the work of demographers such as Coale (1956, 1957) and Keyfitz (1975) persuaded us that in fact fertility decline was more important. More recently, a new wave of demographic analysis suggests that mortality decline is the main demographic source of continuing population ageing. Here we … consider this possibility, but reject it.
(Lee and Zhou, 2017, pp. 285-287).

What do you think about it? And why should non-demographers care?

Levels and variations of old age measures


We recently addressed this issue in two distinct publications (De Santis and Salinari 2023, 2024). Our main conclusion is much closer to the “common sense” evoked in the above quote: the culprit of population ageing is longer average life spans. This is not particularly surprising, all in all, because the reason we can observe individuals living up to 40 years, for instance (which is not the case for mosquitoes), but not to the age of 1,000 (as it happens with sequoias), is that human mortality has certain characteristics, which translate into and shape population age structures (De Santis and Salinari, 2024).

Note, however, that there is a small ambiguity in this debate. Imagine you are interested in measuring the depth of the water of a large lake, where waves are frequent and high. Your indicator, an anchored cork in this example, will go up and down “erratically”, and predictions on direction and amount of change between two short-spaced instants depend on whether the cork is currently on the peak or a trough of a wave, how big the wave is, and when the next waves are due. On average, however, the cork will indicate the “normal” water level in that lake, which depends on the underlying structural and climatic conditions (e.g. average rainfall and its tendency to increase or decrease over time).

If we transpose this metaphor to the field of demography we can think of waves as “short-term disturbances” to the lake surface (=population age structure) produced by changes in number of births and, to a lesser degree, migrants. However, the underlying tendency towards higher or lower water level is due to more structural conditions (average rainfall).

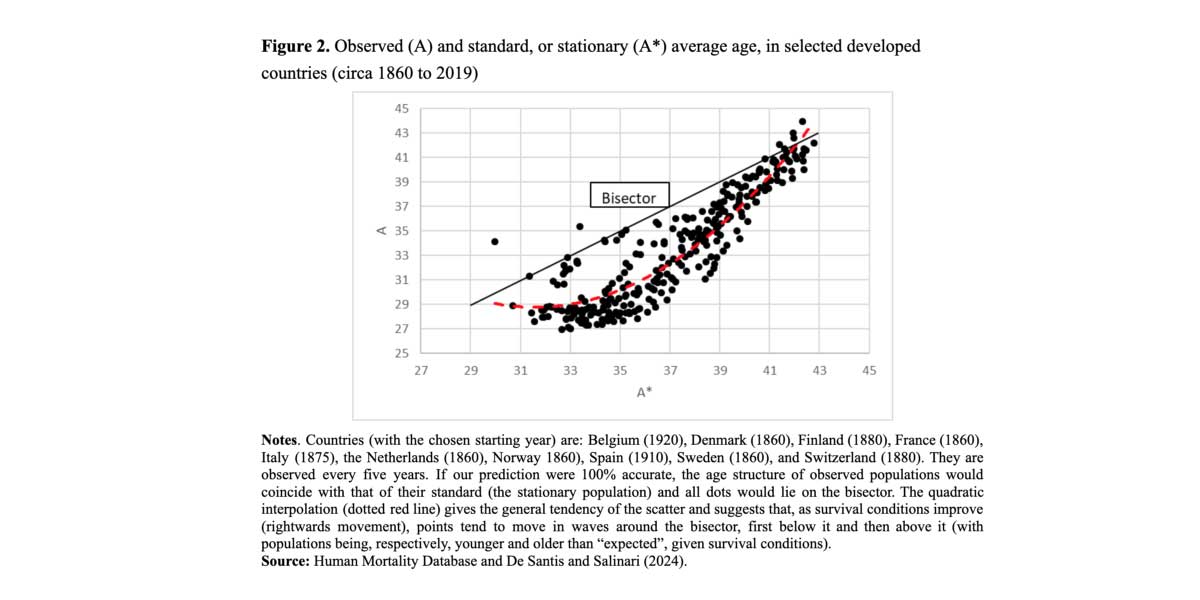
Let us consider the average age as an indicator of population ageing. Alternatives are possible, of course, such as the old age dependency index, OADI, but nothing changes in practice (not shown here). We can calculate two versions of the average age. The “standard” one, At, is based on the observed population of age x at time t, Px,t. The “reference” one, A*t, is calculated instead on the stationary population at time t, Lx. As the stationary population derives from a (period) life table, which depends only on survival conditions (not fertility or migration), we can use it as a measure of what would happen to ageing (as measured by the average age At) if only current mortality mattered. All the rest (previous mortality, fertility and migration) goes into the difference between the expected (by us) value A*t and the observed value At.
Figure 2 shows what can be observed in practice in a few selected developed countries, over a long time span. If the “waves” (fertility, migration and past mortality) had no effect on the observed age structure, all the points would lie on the bisector, where At=A*t, and where, in other words, 100% of ageing depends on survival. Moving rightwards (from low to high survival, so from low to high levels of ageing in the corresponding stationary populations), we observe instead that points move “in waves”. There is a rather large trough when A* is about 36 years (corresponding to an average length of life e0 of some 55/60 years), which historically occurred in the middle of the demographic transition – a very impressive wave indeed. For higher values of A*, however, after the end of the demographic transition, and up to today, things tend to return to “normal”. Our prediction is that new waves will hit the lake (starting from the ongoing second demographic transition), with new peaks and troughs, that will propagate and intersect with occasional new disturbances of all kinds. But A*t will always be a fairly good guide to the expected value of At.

Why should non-demographers care about all this?


If the age structure has effects on the socio-economic life of a community, understanding what drives its levels and change, both in the short and in the long run, matters for everybody, not just for population specialists and their academic discussions. The demographic bonus and pension systems, for example, are two areas where these ideas could potentially be applied.

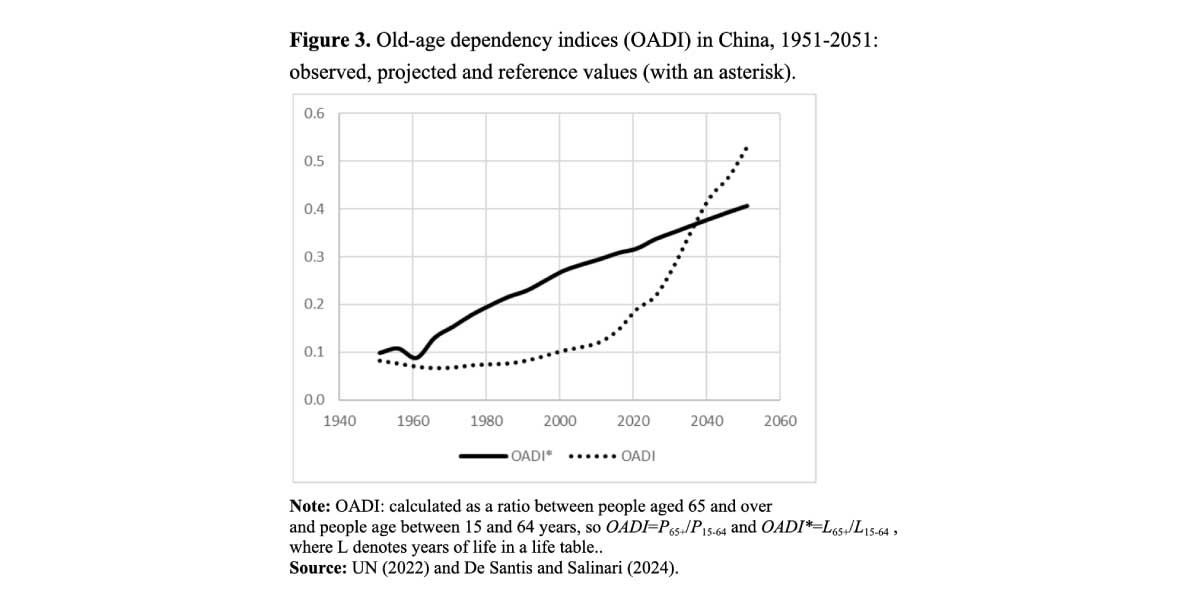
The demographic bonus (or dividend, or window of opportunity) has traditionally been defined as a phase of “structural improvement” over a recent past. For instance, Lee and Mason (2010, p. S159) call it a “phase of … three to five decades … [when] support ratios rise well above their pre-transition levels”. We suggest that the comparison be made also with the stationary age structure of that time. This means that a demographic dividend can be considered to exist as long as the observed age structure is “better” than that of the corresponding stationary population.

Let us refer to Figure 3, for instance. Due to its impressive fertility decline, China’s old-age dependency index (OADI) started to worsen (i.e. to increase) in the 1980s, and is now deteriorating rapidly. However, until about 2036, the observed OADI in China will be lower than its standard equivalent OADI*. In our interpretation, this means that, until then, China will still benefit from a demographic bonus, which means that it will be younger than what would be expected, based on survival level, although this advantage will shrink progressively as time passes.
Most pension systems have been reformed (retrenchments) in recent years due to population ageing. In several cases, these adjustments have been pegged to recent life tables and current survival conditions, and translate into higher retirement ages, or lower pension benefits (because retirees are expected to draw resources from the system for a longer period of time). Our findings suggest that this is the right approach, that it should become more widespread and systematic than is currently the case, and that it should be explicitly presented to the general public as a (comparatively small) price to pay for the great success of ever longer survival that benefits everyone.

Funding


We acknowledge co-funding from two sources: 1) Next Generation EU, in the context of the National Recovery and Resilience Plan, Investment PE8—Project Age-It: “Aging Well in an Aging Society’. This resource is co-financed by the Next-Generation EU (DM 1557 11.10.2022). 2) the Italian MUR (PRIN 2022–No. 2022CENE9F, “The pre-Covid-19 stall in life expectancy in Italy: looking for explanations”). The views and opinions expressed are only those of the authors and do not necessarily reflect those of the funding agencies.

References

  • Coale A.J. 1956. The effects of changes in mortality and fertility on age composition, Milbank Memorial Fund Quarterly, 34:79–114.
  • Coale A.J. 1957. How the age distribution of a human population is determined, Cold Spring Harbor Symposia on Quantitative Biology, 22.
  • De Santis G., Salinari G. 2023. “What drives population ageing? A cointegration analysis”, Statistical Methods and Applications, 32:1723–1741. https://doi.org/10.1007/s10260-023-00713-1
  • De Santis G., Salinari G. 2024. Long-term impact of mortality on population age structures. International Journal of Population Studies, https://doi.org/10.36922/ijps.377
  • Keyftz N. 1975. How do we know the facts of demography?, Population and Development Review, 1 (2): 267–288.
  • Lee R., Zhou Y. 2017. Does fertility or mortality drive contemporary population aging? The revisionist view revisited. Population and Development Review, 43:285–301. https://doi.org/10.1111/padr.12062.
  • United Nations. 2022. World Population Prospects: The 2022 Revision. New York, United Nations Publications.

Saturday, April 6, 2024

aging

Старейший живущий ныне мужчина прадедушка Джон Тиннисвуд, которому 5 апреля было 111 лет и 223 дня, — объясняет свое долголетие потреблением традиционного британского блюда — рыбы с жареным картофелем по пятницам и регулярными пешими походами в юности.


Тиннисвуд сейчас живет в доме престарелых в городе Саутпорт. Он советует «тренировать ум» и проявлять «умеренность» во всем.

Предыдущий обладатель звания старейшего мужчины на Земле Хуан Висенте Перес Мора из Венесуэлы скончался во вторник в возрасте 114 лет.

Подробнее о жизни Джона Тиннисвуда читайте тут.

Friday, December 29, 2023

early dementia

An old man diagnosed as suffering from senile dementia. Colo Wellcome L0026689

Новое исследование о ранней деменции выявило основные факторы риска для возникновения заболевания


В новом исследовании учёные из Эксетерского университета (Великобритания) и Маастрихтского университета (Нидерланды) определили факторы риска, которые могут способствовать ранней деменции. В основу исследования легли данные о более чем 350 000 человек из британской базы биоданных. Учёные пришли к выводу, что к факторам риска относятся злоупотребление алкоголем, дефицит витамина D, потеря слуха, диабет, депрессия, социальная изоляция, инсульт, физическая слабость и болезни сердца.

Доктор Стиви Хендрикс, исследователь из Маастрихтского университета, так прокомментировал результаты крупнейшего на сегодняшний день исследования в этой области: «Часто предполагается, что причина кроется в генетике, но для многих людей мы не знаем, в чем именно она заключается. Именно поэтому в данном исследовании мы хотели изучить другие факторы риска».

Доктор Дженис Рэнсон из Эксетерского университета говорит: «Наше исследование открывает новые горизонты, обнаруживая, что риск развития деменции в молодом возрасте может быть снижен. Мы считаем, что это может стать предвестником новой эры мероприятий по снижению числа новых случаев заболевания».

Первыми признаками деменции являются нарушения кратковременной памяти и способности удерживать информацию. По мере прогрессирования заболевания всё больше ухудшается и долговременная память. Это часто приводит к потере двигательных навыков, речи, ориентации и понимания.

Чтобы как можно дольше поддерживать свой мозг в форме, необходимо оставаться активным, говорят учёные. «Когда мы много двигаемся, в мозге выделяются нейротрансмиттеры, которые активизируют нервные клетки и способствуют образованию новых связей в мозге», — объясняет нейробиолог профессор Мартин Корте из Брауншвейгского технического университета.

Новые впечатления, новые контакты, новые привычки — всё это полезно в качестве профилактики деменции. У людей, имеющих много социальных контактов, мозг стареет медленнее и достигает максимальной производительности благодаря новой информации. «Это активизирует лобную долю, которая является одной из тех областей мозга, которые стареют быстрее всего», — отмечает профессор Корте. Также важна здоровая диета. «Идеальна средиземноморская диета с большим количеством овощей, фруктов, оливкового масла и рыбы. Это обеспечивает достаточным количеством жирных кислот омега-3 и омега-6», — говорит эксперт. Эти полезные жиры являются важнейшим компонентом клеток и участвуют в формировании и передаче сигналов в мозге.

@BILD_Russian

Monday, December 18, 2023

low fertility

Despite low fertility, Europe still taxes its own reproduction


By Pieter Vanhuysse, Robert Iván Gál & Márton Medgyesi

тыц по кортинко, если охота увидеть оригинал

Over the working life, parents in Europe contribute on average about one-quarter fewer net taxes than non-parents. However, if taxes, private time and money are all taken into account and measured in comparable units, it shows that parents contribute over two-and-a-half times more than non-parents.


As different generations live together, they transfer valuable resources to each other. Newborns are delivered into this world – not by storks but by their mothers; more on this later. Then, it takes on average twenty-five years to turn babies into resource-productive adults. But how many resources does this childrearing process really require? And who pays for it? These are questions of primordial importance as they pertain to demographic renewal and fiscal sustainability – to how societies reproduce over time.

Accounting for the invisible transfer cost of raising children


Parents use a combination of three channels to rear children: (1) staying at home to care for their child (giving “time”), (2) buying market goods and services (giving “money”), or (3) working and paying higher net public transfers (“taxes”) that will finance state activities, including policies for children and families. But importantly, these three channels are not equally visible in statistics. Parents do not keep accounts of how much time and money they spend, but taxes and social security contributions are much better recorded.

In ’Taxing Reproduction’, we argue that this asymmetric statistical visibility matters a great deal, as it hides an important further asymmetry in who shoulders the cost of reproducing society. Better measuring the distributional impact of the status quo allows debates about the social and private costs of demographic renewal to be held on more complete and more explicit terms. We use NTA and NTTA methods for twelve EU countries to measure not just all net public transfers (the “state”) but, crucially, also to value the less visible flows of private time and money.

Shining a wider light changes the picture


A fuller accounting for intergenerational transfers truly shifts perspectives, and not just marginally. We find that parents in Europe contribute somewhat fewer public transfers than non-parents. But, away from the statistical limelight, parents additionally provide large transfers of time and money to their own children. This might seem unremarkable. Parents are, after all, the primary caretakers.

But these hidden extra transfers are so large that they radically change the entire picture. Over the working life, parents in Europe contribute on average about one-quarter fewer net taxes than non-parents. But when we then also value all flows of private time and money, parents turn out to contribute over two-and-a-half times more resources overall.

Why do such large asymmetries in cost-sharing matter? Rearing children is not just a personal lifestyle choice. Children are also public goods. As they grow up to become taxpayers, social security contributors, caregivers and parents in their turn, children will finance future public goods and welfare states. All of this will then also benefit non-parents. Hence childrearing creates positive externalities. To be sure, another part of parental transfers resembles pure consumption. Private transfers may also reduce intergenerational mobility. So why should parents be compensated for something they presumably freely engaged in?

Debunking another “stork theory”


A key reason is that not counting the positive externalities of a good generally leads to socially suboptimal amounts of that good being produced. If societies do not fully value the transfer cost of childrearing, they risk producing too few productive adults. This puts the intergenerational social contract under severe strain. Ultimately, labour markets and welfare states could not continue to function well without the human capabilities of subsequent generations.

Barring immigration on a politically wholly unrealistic scale, the renewal of societies, economies, and welfare states crucially depends on both the size (“quantity”) and the productivity and capabilities (“quality”) of successive generations – on what mainly parents do. This is why childrearing acquires the deeper status of producing, also, a socially necessary public good.

Today, policy practices do not fully take into account how the human and fiscal resources welfare states and labour markets tap into were created in the first place. Societies thus adhere to another “stork theory” that needs debunking. Just as newborn infants are not actually delivered by storks, resource-productive adults do not just drop fully formed out of the sky. Rather, they are delivered to society after a further twenty-five years of child-rearing, financed to some degree by all taxpayers but to a larger degree by their own parents.

Ageing Europe taxes its own reproduction


Many activities with positive externalities, such as charitable donations, private savings or investments in green technologies, are awarded tax credits. But when parents produce positive externalities, instead of receiving tax credits, they shoulder a significant extra resource contribution load. We calculate that the “tax” rates implicitly imposed thereby on child-rearing are much higher than the value-added tax rates in place in Europe on consumption goods such as food, clothes and electronics. Is this a good policy?

Most people today agree that there is something quite wrongheaded about two other widespread societal (non-)valuation practices. Claudia Goldin was awarded the 2023 Economics Nobel Prize for her research on gender and “motherhood penalties.” Nancy Folbre has shown persistent ”carer penalties.” Folbre put it memorably: when societies take prisoners of love, it does not benefit them in the long run. This is an unsustainable policy.

Toward more complete human capability-boosting policies


Better accounting for invisible value production by families substantially changes how we understand, let alone address, the same policy question. When parents contribute over two-and-a-half times more resources than non-parents, this captures the sheer magnitude of the hidden asymmetry in cost-sharing. The large size of the still-privatised cost of child-rearing will affect parenting decisions and will lower fertility levels. This raises important questions about current policy practices in “social investment Europe".

Across Europe, parents have consistently fewer children than they would like. In addition, European societies have long grappled with fertility rates well below replacement levels, high or still-increasing levels of childlessness, and larger, longer-living older populations. Yet despite these rising demographic tensions, societies unwittingly tax rather than subsidize their own reproduction. In the long run, this is an unsustainable policy.

To secure sustainable future foundations and avoid becoming a continent of gerontocracies, Europe needs to make its currently elderly-oriented welfare states more intergenerationally balanced and much more human capital-oriented. Notwithstanding its name, the “social investment paradigm” needs to design yet more extensive policy models to better assist, value and incentivize the work of parents, carers and educators – those who nurture the human capabilities that sustain our societies.

References

  • Bonomi Bezzo, F., Raitano, M., Vanhuysse, P. (2023), ‘Beyond human capital: how does parents’ direct influence on their sons’ earnings vary across eight OECD countries?,’ Oxford Economic Papers https://doi.org/10.1093/oep/gpad007
  • Gál R.I., Vanhuysse P. &- Vargha L. (2018), Pro-elderly welfare states within child-oriented societies. Journal of European Public Policy 25(6): 944–58.
  • Vanhuysse P. & Gál R.I. (2023), ‘Intergenerational Resource Transfers in the Context of Welfare States,’ in: Daly M., Pfau-Effinger B., Gilbert N., Besharov D., editors. The Oxford Handbook of Family Policy: A Life-Course Perspective. Oxford: Oxford University Press; 2023. p. 1015–33.
  • Vanhuysse, P., Medgyesi, M. & Gal R.I (2023), Taxing reproduction: the full transfer cost of rearing children in Europe, Royal Society Open Science, https://dx.doi.org/10.1098/rsos.230759
  • Vanhuysse, P., Medgyesi, M. & Gál, R.I (2021), Welfare States as Lifecycle Redistribution Machines, PLOS ONE 16(8):e0255760 https://doi.org/10.1371/journal.pone.0255760

Monday, December 11, 2023

Sociodemographic disparities in co-impairment in the older U.S. population

December 11, 2023 Shubhankar Sharma, Jo Mhairi Hale, Mikko Myrskylä and Hill Kulu

The under-investigated issue of co-impairment (cognitive impairment and limitations in basic activities of daily living) is more prevalent than commonly believed. Shubhankar Sharma, Jo Mhairi Hale, Mikko Myrskylä and Hill Kulu describe the case of the U.S. and underline the profound health inequalities across some of its population subgroups.


The U.S. is experiencing considerable population aging. While older adults constituted 17% of the total U.S. population in 2020, the share is predicted to reach 22% by 2040 (Vespa et al. 2018). Population aging poses serious challenges as health declines with increasing age, sometimes to the point where independent living becomes impossible.

Co-impairment


Extensive research has been conducted to understand co-impairment, the joint burden of cognitive impairment and limitations in basic activities of daily living such as walking, dressing, and eating. Co-impairment is considerably more detrimental to the affected individuals as well as to the caregivers’ health and well-being than either burden experienced separately (Riffin et al. 2017; Yu et al. 2017). However, no study has investigated the risk of experiencing co-impairment in one’s lifetime: at what age and for how long co-impairment is experienced (expectancy).

Over one million older adults experience co-impairment in the U.S. (Riffin et al. 2017) and, with rapid population aging, this number is likely to increase. In recent research (Sharma et al. 2023), we examined the burden of co-impairment among older individuals in the U.S. using data from the Health and Retirement Study, 1998-2016, and multistate models. In addition to estimating the widely used metric of expectancy, we also estimated the lifetime risk and mean age at onset of co-impairment by gender, race/ethnicity/nativity, and educational level, as health disparities are high in the U.S. (Hayward et al. 2014).

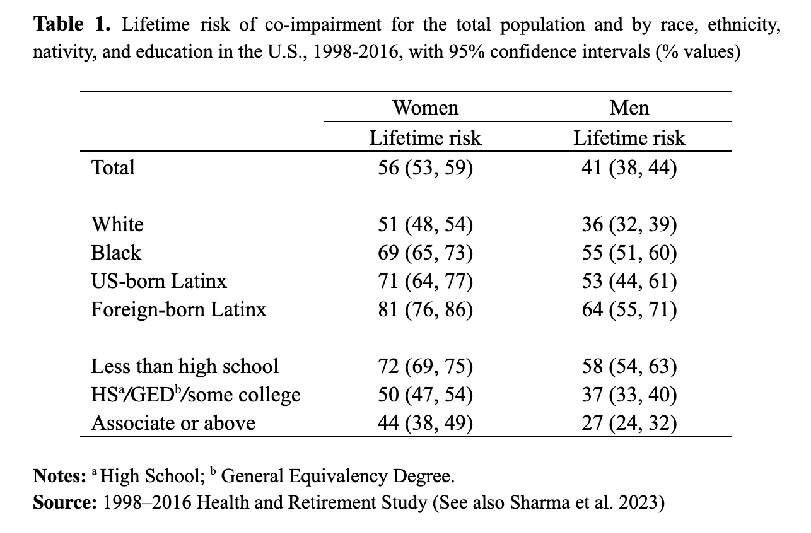
Table 1 presents the main results. Overall, 41% of men and 56% of women aged 50 are expected to experience co-impairment in their remaining life expectancy. Blacks, foreign- and U.S.-born people of Latin American origin or descent (Latinx), and the lowest educated experience substantially greater lifetime risk of co-impairment than Whites and the highest educated, regardless of gender.

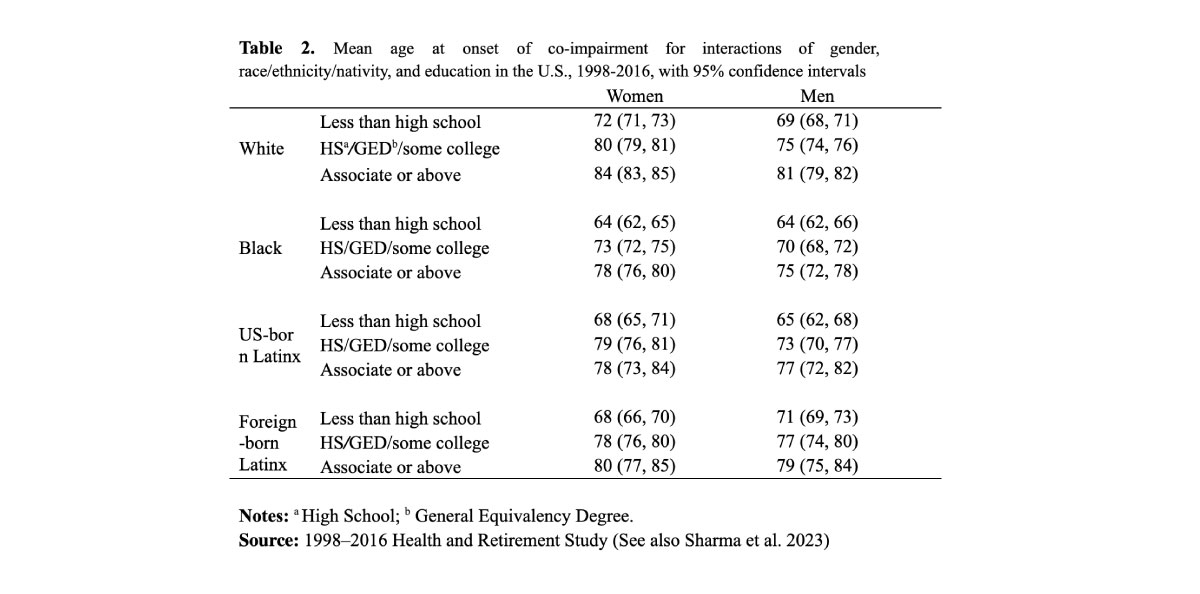
Table 2 presents the average age at onset of co-impairment for racial/ethnic/nativity subpopulations by educational attainment. Black women and men pay the highest penalty for having the lowest level of education. They have the youngest co-impairment onset (at age 64 years), resulting in dramatic disparities of about two decades compared with the highest educated Whites.


Table 3 shows the co-impairment expectancies for all the racial/ethnic/nativity subgroups by educational attainment. In each racial/ethnic subpopulation, those with the lowest education have the longest co-impairment expectancy. In particular, the lowest educated foreign-born Latinx live the longest in co-impairment (men: 5.0 years, women: 9.7 years).

Educational intervention: a potential way to narrow the disparities


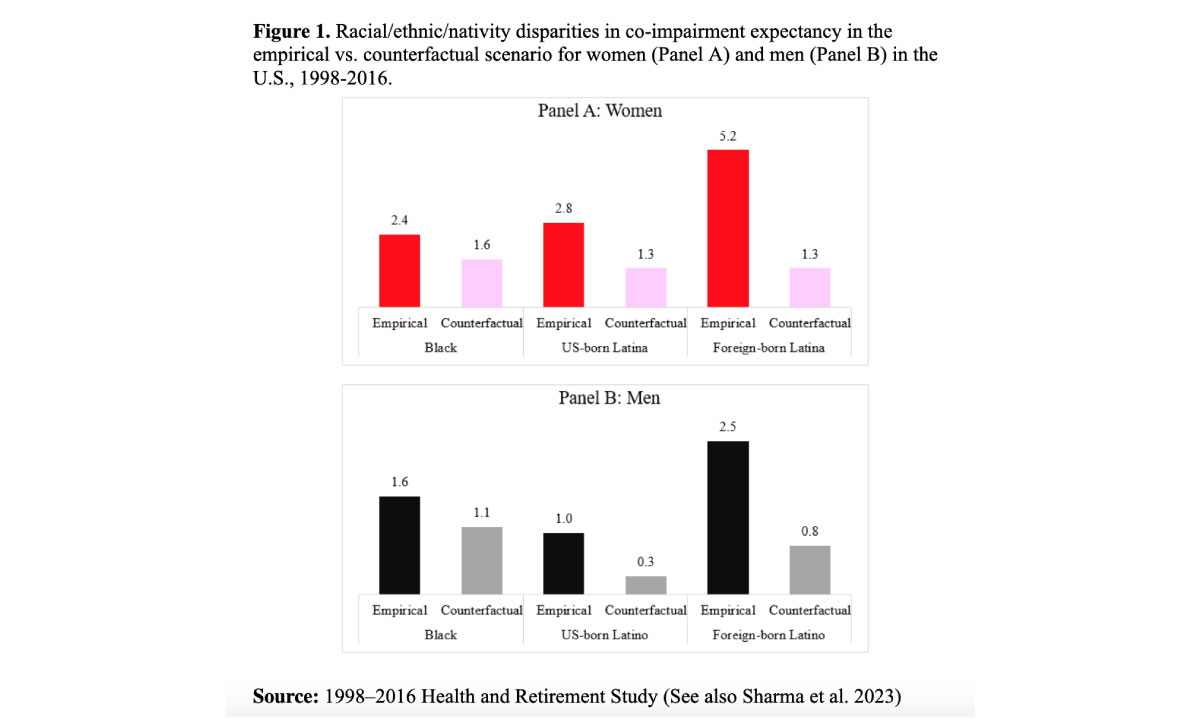
Figure 1 shows the racial/ethnic/nativity disparities in co-impairment expectancy (e.g., between Blacks and Whites) in the counterfactual and empirical scenarios. In the counterfactual scenario, educational inequalities across race/ethnicity/nativity are eliminated. We assign the educational distribution of Whites to Blacks and Latinx and recalculate their expectancies, with differences from the Whites that, not surprisingly, shrink.

The U.S. has a long road ahead to attain health equity


Being co-impaired poses serious disadvantages for the affected individuals, family members, caregivers, and society. Our study provides novel insights into its burden and offers evidence of dramatic disparities in the older U.S. population. We find that older women, Blacks, U.S.- and foreign-born Latinx, and less than high school educated adults experience a considerably greater burden of co-impairment. For instance, we find a difference of almost nine years in co-impairment expectancy between the highest educated White men and lowest educated foreign-born Latinas aged 50.

These findings may help health planners to identify the vulnerable subgroups of caregivers who may need additional resources or support. Particularly, Blacks and Latinx rely more heavily on family members for care and support than Whites (Rote and Moon 2018). Since Blacks, Latinx, and the lowest educated have an earlier onset of co-impairment and live considerably longer in co-impairment than others, their caregivers are subject to greater strain and are themselves at greater risk of poor health in the future.

Maintaining the health and well-being of the growing older population has become a public health priority in the U.S., a serious challenge for health planners and policymakers, also considering that the shares of the most vulnerable groups, Latinx and Blacks, are increasing (Vespa et al. 2018). The considerable disparities across subpopulations in co-impairment indicate that the U.S. has a long road ahead to attain health equity. Nevertheless, at least 31% of the racial/ethnic/nativity disparities in co-impairment expectancy are attributable to educational inequalities. This promising finding emphasizes the importance of an educational intervention in narrowing the future racial/ethnic/nativity disparities in health.

References

  • Hayward, M. D., Hummer, R. A., Chiu, C. T., González-González, C., & Wong, R. (2014). Does the Hispanic Paradox in U.S. Adult Mortality Extend to Disability?. Population Research and Policy Review, 33(1), 81–96. https://doi.org/10.1007/s11113-013-9312-7
  • Riffin, C., Van Ness, P. H., Wolff, J. L., & Fried, T. (2017). Family and Other Unpaid Caregivers and Older Adults with and without Dementia and Disability. Journal of the American Geriatrics Society, 65(8), 1821–1828. https://doi.org/10.1111/jgs.14910
  • Rote, S. M., & Moon, H. (2018). Racial/Ethnic Differences in Caregiving Frequency: Does Immigrant Status Matter?. The Journals of Gerontology. Series B, Psychological sciences and social sciences,73(6), 1088–1098. https://doi.org/10.1093/geronb/gbw106
  • Sharma, S., Hale, J. M., Myrskylä, M., & Kulu, H. (2023). Racial, Ethnic, Nativity, and Educational Disparities in Cognitive Impairment and Activity Limitations in the United States, 1998–2016. Demography, 60(5), 1441-1468.
  • Vespa, J., Armstrong, D. M., and Medina, L. (2018). Demographic turning points for the United States: Population projections for 2020 to 2060. Washington, DC: US Department of Commerce, Economics and Statistics Administration, US Census Bureau. Retrieved from https://www.census.gov/content/dam/Census/library/publications/2020/demo/p25-1144.pdf
  • Yu, W. C., Chou, M. Y., Peng, L. N., Lin, Y. T., Liang, C. K., & Chen, L. K. (2017). Synergistic effects of cognitive impairment on ADL disability in all-cause mortality among men aged 80 years and over: results from longitudinal older veterans study. PLoS One, 12(7), e0181741. https://doi.org/10.1371/journal.pone.0181741

Friday, December 8, 2023

Are your organs ageing well? The blood holds clues

One organ in a person’s body can age faster than the rest — with implications for health and mortality.

By Max Kozlov

Scientists studied more than 5,000 people to understand variation in the ageing of individual body organs.

As people age, their cells undergo a raft of biochemical changes that lead to organ damage and, eventually, death. But a new study that tracks proteins suggests that these changes aren’t uniform: an individual’s organs can age at different rates, and a given organ can age at a faster rate in one person than in another with the same chronological age.

The authors studied 11 major organs and report that all of them can be subject to ‘accelerated’ ageing, as defined by the levels of certain proteins in the blood. Around one-fifth of the more than 5,600 people who participated in the study met the authors’ criteria for accelerated ageing for at least one organ. Such hyper-aged organs are linked to a higher prevalence of disease, and having one organ of unusually advanced age is linked to a higher risk of premature death, the study found.

Tests for proteins related to organ age could help researchers to develop treatments for age-related health problems and could also guide personalized treatment plans, says Hamilton Oh, a computational biologist at Stanford University in California and a study co-author. Physicians already monitor patients’ levels of some proteins, and the authors’ test “would be expanding their toolkit”, he says.

Ageing by numbers


Previous research has identified several hallmarks of ageing at the cellular level, such as the accumulation of DNA mutations and changes in the epigenome, the collection of chemical tags on a person’s DNA. Over the past decade, researchers have developed algorithms that harness these indicators to estimate a person’s ‘biological age’, which can be higher or lower than their chronological age.

Another hallmark of ageing is a shift in the proteins that the body produces. To explore how organs age, Oh and his colleagues first analysed nearly 5,000 proteins in blood samples from 1,398 healthy adults. They identified about 850 proteins that originated mainly from a single organ and trained a machine-learning algorithm to predict a person’s age on the basis of the levels of these proteins. They validated their model using blood samples from more than 4,000 other people.

The results showed that an organ’s biological age is linked to disease risk. For example, roughly 2% of participants had accelerated heart ageing — that is, their levels of blood proteins relating to heart ageing differed substantially from those of other people of the same age. Having a prematurely old heart was linked to a 250% increased risk of heart failure, the authors found.

Marking time


Some researchers have used epigenetic markers to show that the pace of organ ageing varies between individuals. But it’s not clear how epigenetic changes are linked to ageing, says Matt Kaeberlein, a specialist in the biology of ageing and chief executive of Optispan, a biotechnology company in Seattle, Washington. Proteins are “much closer to the downstream mechanisms that might be driving ageing”, he says. Protein biomarkers might help researchers to identify targets for anti-ageing drugs, he adds.

Combining various hallmarks of ageing could lead to more robust tests of organ age than protein tests alone, says Sara Hägg, an epidemiologist at the Karolinska Institute in Stockholm who specializes in biological ageing. She praises the “impressive” amount of data the researchers analysed, but cautions that it’s not clear whether the proteins are driving the ageing process or are by-products of it. It’s also unclear whether the team’s algorithm predicts disease risk or simply reflects protein changes caused by diseases, she says.

Kaeberlein says that determining causality is important, but time-consuming. In the meantime, with further research, these protein biomarkers might “help people by directing them to change their lifestyle or take some supplement”, he says. “That’s powerful regardless of causality.” Several tests that use biomarkers to assess ageing are already on the market, but Kaeberlein cautions against relying on these. The idea of having a non-invasive way to predict organ health from one sample is exciting, but “we don’t have a good understanding if these clocks are actionable or precise yet”, he adds.

doi: https://doi.org/10.1038/d41586-023-03821-w

тут со ссылками и прочими радостями

Monday, December 4, 2023

retirement policies and demographic change

How retirement policies and demographic change influence China’s gender labor force gap

December 4, 2023 Feng Kai

The gender gap in labor force participation is expanding in China, for various reasons, among which scarcity of affordable public childcare and growing discrimination against women in the labor market. Part of the explanation, Kai Feng argues, lies in the rigidities and discrimination of the Chinese pension system, which forces women to retire earlier than men.


China, once renowned for its high women’s labor force participation, is now experiencing an unexpected downturn. While the gender gap in labor force involvement is narrowing at global level, it is expanding in China (Figure 1)

During Mao’s era, the labor force participation rate for women was exceptionally high, driven by the radical ideology that “women hold up half the sky” and by massive social mobilization to promote female employment. The planned economy of the time also meant that both women and men had little choice but to work for a living. With the advent of market reforms in 1978, not working became a viable option for many. In addition, subsequent institutional shifts have erected significant barriers for women seeking to join or stay in the workforce.

Why has the gender gap in labor force participation widened in China?


Numerous studies, as summarized in Ji et al (2017), suggest that the reduction in affordable public childcare —previously widely available — combined with escalating discrimination against women since the economic reforms, are contributing to this widening gap. Drawing from these findings, researchers recommend policies to enhance access to cost-effective childcare, to curb workplace discrimination against women, and ensure equal rights for women and men, irrespective of women’s fertility behaviors or intentions.

In a recent study (Feng 2023) I highlight an often-overlooked factor: China’s gender-based retirement policy. Under this policy, established in the 1950s with the intention of “protecting” female workers (some argue it was a legacy of the Soviet model), women are expected to retire at either age 50 or 55, depending on their occupations, while men retire at 60. This policy has remained untouched, even as women’s life expectancy has risen and their presence in higher education and the workforce has significantly expanded.
 

Increased women’s labor force participation after age 50, but composition effects prevail


A significant factor contributing to the observations is the shift in population age composition. As a larger portion of the population reaches retirement age, a higher number of women than men exit the workforce (Figure 2).

Women’s labor force participation rate above age 50 actually increased between 1990 and 2010, (as shown by the percentage on the top of the bar), together with the population aged 50 and over. In 1990, the majority of the working-age population consisted of younger age groups, with women aged between 50 to 64 represented only 19% of the entire workforce (ages 20 to 64). This percentage grew to 24.5% in 2010 and is anticipated to reach 37.2% by 2030.

These demographic shifts are expanding the gender gap in labor force participation over the years. If labor force participation rates remain consistent with the 2010 data, the projected age structure for 2030 suggests an even more pronounced gender disparity in labor force participation.

This study does not necessarily contradict previous findings, however. Figure 3 presents the contribution of caregiving and retirement to the change in women’s labor force participation between 1990 and 2010.

Among younger women, the rate of non-participation in the labor force due to caregiving rose, aligning with the explanations of increased work-family conflict and gender discrimination. Compared to 1990, the rise in caregiving rates among younger women in 2010 was offset by a decrease among older age groups. However, this does not imply that women undertake fewer caregiving responsibilities in their older years now than in the past. Rather, women now are more likely to cite retirement as their reason for not participating in the labor force.

Is early statutory retirement age a good thing for women?


The topic of women’s early retirement is hotly debated in China. While many men argue that the system is unfair because men are required to work for more years than women before they can retire, the question remains: is an early statutory retirement age truly beneficial for women?

On the surface, early retirement may seem advantageous, but being able to retire with financial independence is another story: the gender-based retirement system contributes to a gender pension gap, with women receiving fewer pension benefits (Giles et al 2023). An institutionalized policy that requires women to retire earlier than men may further hinder women from advancing to senior positions on the professional ladder.

Within a household, men and women often pool resources, including pensions, savings, housing, and assistance from their children. However, as singlehood and childlessness rates increase, early retirement may put single and childless women in precarious financial situations. Moreover, as the population continues to age, there are growing concerns about the long-term sustainability of the current pension system (Cai, Wang, Shen 2018). The upcoming generation might not receive the same pension benefits as their parents. Consequently, for many people, labor earnings might emerge as a more reliable income source than a pension. Thus, ensuring equal labor rights for women and men at older ages is becoming imperative.
 

Rising retirement age


Discussion on retirement age should distinguish between effective retirement age and statutory retirement age. Even with a new pension system that includes rural residents, the retirement age holds minimal weight for millions of low-skilled migrant workers, as many will continue working as long as they physically can. The pension disparity between urban hukou holders and their rural counterparts is huge (Giles et al., 2023). Still, a static and gender-based retirement age could place additional strain on these workers. The current retirement system might leave many workers above retirement age, especially a higher proportion of women, vulnerable due to inadequate labor protections, such as accident and injury insurance. This could also make employers hesitant to hire older individuals due to associated risks.

For years, raising the retirement age has been considered a policy strategy to boost the workforce and, more importantly, to address the looming pension deficit. Considering that, after years of economic development, China currently has the most educated and healthiest population in its history (Wang 2023), the country appears well-positioned to enact this policy. However, alongside the widely discussed urban-rural divide, it is important to integrate a gender perspective into ongoing discussions about retirement and pension reform to avoid maintaining or even exacerbating the inequality in middle and later life stages.

References

  • Cai, Y., Wang, F., & Shen, K. (2018). Fiscal implications of population aging and social sector expenditure in China. Population and Development Review, 811-831.
  • Feng, K. (2023). Unequal Duties and Unequal Retirement: Decomposing the Women’s Labor Force Decline in Postreform China. Demography, 60(5), 1309-1333.
  • Giles, J., Lei, X., Wang, G., Wang, Y., & Zhao, Y. (2023). One country, two systems: evidence on retirement patterns in China. Journal of pension economics & finance, 22(2), 188-210.
  • Ji, Y., Wu, X., Sun, S., & He, G. (2017). Unequal care, unequal work: Toward a more comprehensive understanding of gender inequality in post-reform urban China. Sex Roles, 77, 765-778.
  • Wang, F, 2023, Should or should not China be afraid of population decline?, Neodemos

Wednesday, October 11, 2023

Should or should not China be afraid of population decline?

October 9, 2023 Wang Feng

China’s population boom is over: demographic aging and decline will characterize its foreseeable future. However, according to Wang Feng, this will not entail a decrease in the standard of living of its citizens, or of China’s role in the globalized world, thanks to unparalleled improvements in education and health.


China’s onset of population decline was instantly greeted by a chorus of doomsayers. The pessimists were quick to equate this demographic turning point with the end of China’s economic growth, even the end of China’s growing global geopolitical influence. Such predictions are overly simplistic and are largely based on the premise of a population-growth driven economic development model that the world has gotten so used to in the past half century and more. Yet it takes little knowledge of economics to know that labor is only one of the key ingredients of economic output. And even labor is not just a number. China’s economic boom in the past several decades indeed benefited from a large reservoir of hard-working labor, in particular the vast flows of rural migrants to cities, but one needs to be reminded that it was institutional change that has made the feared “surplus labor” during China’s planned economy era into a highly productive labor force in the last four decades.

Should China be afraid of its population decline? Can China, and the world, adapt to a new era of global demographics featured by population aging and decline, just as they adapted to the era of population explosion? Rather than being fixated on simple population numbers, be it the size of the labor force or dependency ratios, one needs to look deeper, taking stock of the characteristics of the population, and appreciating the importance of institutional conditions that have allowed past economic successes, and that will be crucial in facing future challenges.

It’s not all about a number: new faces of the Chinese population


Thanks to its historic economic boom and social transformations, China now has the most educated young population in its history. Four decades ago, when the first post-Mao population census was taken in 1982, the picture that emerged was one of a population that was already largely literate. Yet the near universal literacy among the young at the time was just that, basic literacy. Among those aged 15 to 19, who benefited the most from the expansion of education at that time, only slightly over 40 percent had junior high school or high school education. The share was only barely 20 percent among those in their 30s. The share of the population with tertiary education was miniscule: less than 1 percent of people in their late 20s and early 30s had attended college.

China has undergone an explosive growth in higher educational opportunities. Between 1998 and 2010, annual enrollment in colleges rose more than six-fold, from barely a million to nearly seven million.1 By 2020, annual enrollment in tertiary education had reached 9.7 million.2 With an annual birth number dropping to a new low of 10.6 million in 2021, China has virtually reached tertiary education enrollment saturation. Even without further expansion, all children born in the early 2020s will be able to enroll in higher education in the future.

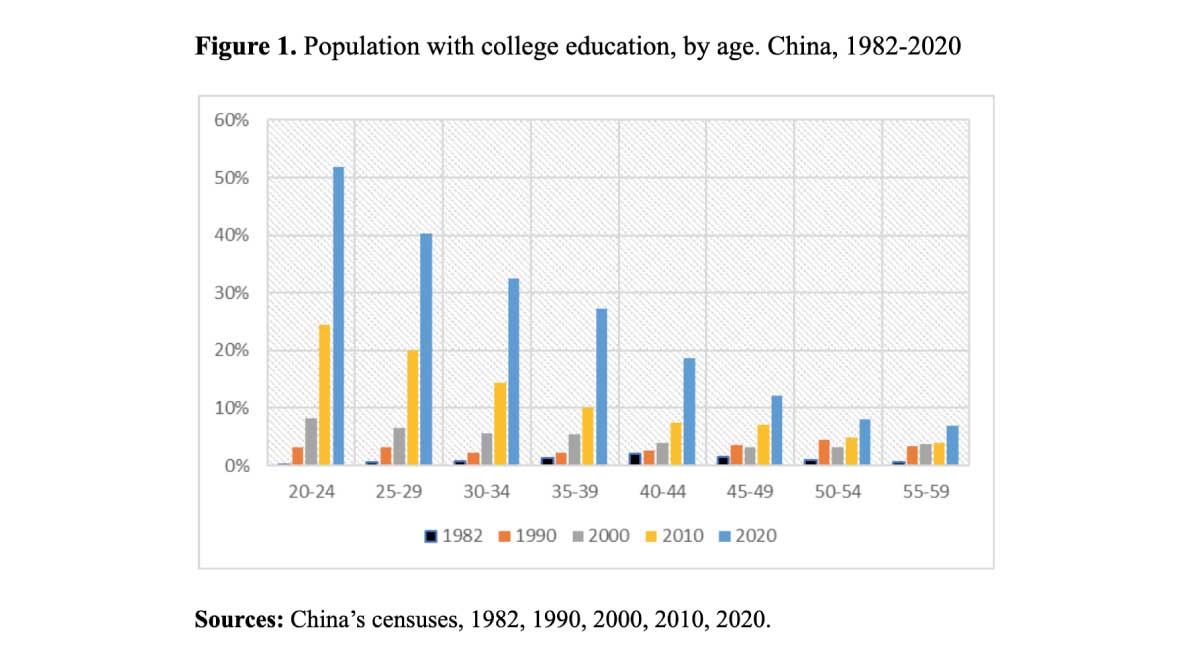
Vast improvements in educational attainment can be appreciated by comparisons across age groups and over the decades. As shown in Figure 1, around 10 percent of the population aged 45 to 49 in 2020 had a college education. Among the youngest age group, those aged 20 to 24, the share was five times higher, with over half already having tertiary educational attainment. Four decades ago, in this age group, the share was less than 0.25 percent and in 2010 the share was less than 25 percent. By 2020, more than a third of young people in their prime working age (20 to 34) already had tertiary education. Such a rapid shift in the educational level of the young population has transformed the Chinese economy and society in numerous fundamental ways, from work and income to consumption and participation in social and political affairs.

Health and survival


China now also has the healthiest population in its history. As China ascended from a low-income to an upper-middle income society, its population’s health profile further converged toward that of high-income countries. This convergence has come with two faces: one in the general health level of the population, and the other in disease profiles. As China’s life expectancy further increased, approaching that of high-income societies, its composition of causes of death also shifted, and is now dominated by deaths from non-communicable diseases, resembling the pattern seen in other high-income and aging populations. In contrast to earlier generations, whose early-life health risks were mostly attributable to poor nutrition, those raised during China’s age of abundance face a whole different set of risks. The term of malnutrition has acquired a new meaning in China. In the early 2010s, for instance, 244.5 million or 23.2 percent of adults aged 18 and over had hypertension, with another 435 million, or 41.4 percent having pre-hypertension, according to Chinese guidelines.3

Life expectancy is not only increasing at birth, but also at advanced ages. In China, as in the neighboring East Asian countries of Japan and South Korea, life expectancy at 65, the normal cut-off age for defining the elderly population, nearly doubled between 1950 and 2020, from 9.1 years to 17.7 years (Figure 2). Greater longevity, like educational expansion among the young, is similarly transforming the economy by enabling people to work until later ages and creating new markets to meet the needs of older adults.

Not all is gold that glitters


Recognizing these new features of the Chinese population is not to dismiss the challenges associated with China’s historical demographic shift. China will face serious fiscal challenges, which will make economic transformation and continued growth more imperative. In the first decades of the twenty-first century, public spending on health care and on pensions as a share of GDP has already more than doubled. This combined spending already accounted for more than a quarter of all government spending by 2020, or close to 10 percent of GDP.4 One study has projected that population aging alone could drive up such public spending to 20 percent of GDP by 2040, and to 23 percent by 2050.5 Increasing per capita benefits to levels commensurate with that of a high-income society could increase the share of public spending much faster, to 32 percent of GDP by 2050. In the absence of any substantial increase in government revenue, such a share would imply that the entire government revenue would have to be used for such public spending, mostly in support of an aging population.

Rather than spelling the country’s fate based on simple population numbers, however, a new economic growth model is essential for sustaining increased living standards of the population. China had an abundant supply of labor during its planned economy years, but that labor was not put to productive use. China has shifted its course of economic growth and now has the most educated and the healthiest population in its long history. The end of population growth, therefore, is by no means an automatic end of economic growth. What should be feared is not a smaller and older population. The challenges will give rise to innovation and adaptation, as history has shown us again and again.

Foot notes

  • 1 China Statistical Yearbook 2010, Table 20-7. The enrollment number includes both four-year university courses and three-year vocational courses. In 2010, 3.1 million of the 6.6 million enrolled students were in three-year vocational institutions.
  • 2 China Statistical Yearbook 2021, Table 21-7.
  • 3 www.ahajournals.org/doi/full/10.1161/CIRCULATIONAHA.117.032380
  • 4 Public spending as a share of GDP estimated by the IMF for 2020 was 35.4 percent.
  • 5 Cai, Yong, Feng Wang, and Ke Shen. 2018. “Fiscal Implications of Population Aging and Social Sector Expenditure in China.” Population and Development Review 44 (4): 811–31. http://www.jstor.org/stable/45174458.

Thursday, October 5, 2023

1 bed in the center

Сколько стоит аренда односпальной квартиры в центре столиц разных стран Европы


Наши 718 долларов за однушку в центре Москвы (это уже больше 70 тысяч рублей по нынешнему курсу - за такие деньги какую-никакую однушку в ЦАО снять правда можно) - это один из самых низких результатов в Европе, дешевле даже чем в Литве (807 долларов за квартирку в центре Вильнюса), Сербии (827) и Польше (928)

Кстати, такое удивительное соотношение цен в Москве и Белграде может быть вызвано как раз-таки всеми последними событиями у нас и массовой эмиграцией из страны.

Самое дорогое жильё - в Великобритании: больше 2.6 тысяч долларов в месяц будет стоить маленькая квартира в центре Лондона, это даже дороже, чем в столице США! Правда, Вашингтон - не самый крупный и не самый богатый город Штатов, так что это не так и удивительно

Friday, September 1, 2023

geriatric syndrome

Geriatric Syndromes: Clinical, Research, and Policy Implications of a Core Geriatric Concept


Sharon K. Inouye, Stephanie Studenski, Mary E. Tinetti, and George A. Kuchel 

Geriatricians have embraced the term ‘‘geriatric syndrome,’’ using it extensively to highlight the unique features of com-mon health conditions in older people. Geriatric syndromes, such as delirium, falls, incontinence, and frailty, are highly prevalent, multifactorial, and associated with substantial morbidity and poor outcomes. Nevertheless, this central geriatric concept has remained poorly defined. This article reviews the criteria for defining geriatric syndrome sand proposes a balanced approach to developing preliminary criteria based on peer-reviewed evidence. Based on a review of the literature, four shared risk factors F older age, baseline cognitive impairment, baseline functional impairment, and impaired mobility F were identified across five common geriatric syndromes (pressure ulcers, incontinence, falls, functional decline, and delirium). Understanding basic mechanisms involved in geriatric syndromes will be critical to advancing research and developing targeted therapeutic options, although given the complexity of these multifactorial conditions, attempts to define relevant mechanisms will need to incorporate more complex models, including a focus on synergistic interactions between different risk factors. Finally, major barriers have been identified in translating research advances, such as preventive strategies of proven effectiveness for delirium and falls, into clinical practice and policy initiatives. National strategic initiatives are required to overcome barriers and to achieve clinical, research, and policy advances that will improve the quality of life for older persons. J Am Geriatr Soc 55:780–791, 2007.

Monday, August 21, 2023

census ru register aging

Всероссийская перепись населения, проводившаяся в 2021 году, показала, что доля домохозяйств, состоящих из одного человека, составила 41,8%, при этом в 2002 году доля одиночек была почти вдвое меньше и составляла 22,3%.


Полные семьи с детьми занимают лишь пятую часть из всех домохозяйств (20,7%).

Из всех семей с детьми 37,7% составляют матери-одиночки (их доля увеличилась с 2002 года на 6%). Также вырос процент семей из отцов-одиночек с детьми — с 4,1% в 2002 году до 8,2% в 2021 году.

Monday, July 10, 2023

inequality in aging

Socioeconomic inequalities in functional health in Chilean older adults

July 10, 2023 Pedro Olivares-Tirado and Rosendo Zanga Pizarro

Old age is frequently marred by ill health. Socioeconomic conditions, too, play their part: the poorest also suffer from worse health conditions in Chile, as Pedro Olivares-Tirado and Rosendo Zanga Pizarro show, and arguably also elsewhere.


In the last three decades, Chile has experienced accelerated demographic ageing. In the 2017 Census, older adults (OA60+, aged 60 years and over) represented 16% of the country’s population, a share that is projected to increase to about 31% in 2050 (CELADE 2017). Population ageing raises the issue of the “quality of ageing” (Scott 2021), which may be significantly lowered by impairments in self-care, mobility, and cognitive functions affecting autonomy, independence and well-being in older persons. Different measures may be used to determine functional limitations. Regarding basic activities of daily living (BADL), six items are usually used: eating, bathing, personal mobility, toilet use, getting in/out of bed and dressing.

Socioeconomic inequalities and functional limitations


Functionality depends also on the social context in which older adults live and on their socioeconomic status, both of which affect their access to the healthcare system (Zhanget al 2019, Huang and Fu 2021).

Despite public policy improvements, Chile still has inequality in access, opportunity, quality, and financial coverage of health care, particularly among older adults (Fuentes-García et al 2013, Moreno et al. 2021). In a recent paper (Olivares-Tirado and Zanga Pizarro 2022), we examined the association between socioeconomic inequalities and functional limitations among Chilean older adults using self-reported BADL limitations and household income from the National Socioeconomic Characterization Survey-2017 (CASEN/2017).

Over 44,000 OA60+ were surveyed, 56% of them women. Most of them lived in urban areas, and had average schooling of 10.7 years for men and 9.3 years for women. The average adjusted household income was 1,638 US$ for men and 1,532 US$ for women. Furthermore, 85% of the OA60+ were covered by public health insurance, 7% by private health insurance, and the remaining were retired from the armed forces or had no insurance.

Table 1 shows the percentage of BADL limitations among OA60+, stratified by sex and severity. About 87% men and 81% of OA60+ women had no BADL limitation. Concerning each BADL, personal mobility was the daily activity that showed the most significant functional limitations in both sexes, followed by bathing and dressing. In all BADLs, women presented more severe functional limitations than men.
Figure 1 shows trends in BADL limitations of the poorest (first two deciles) and richest (last two deciles) OA60+ across age groups and by sex. An exponential increase in the frequency of BADL limitations across age groups in both sexes was observed. Women have higher prevalence (and higher severity) of BADL limitations than men in all age groups. The difference between the poorest and the wealthy decreases with advancing age.
Let us consider the case of personal mobility limitation rates, for instance (other limitations have similar patterns, not shown here). Figure 2 shows the gradient of both severity levels, by gender and income decile, from the poorest (decile I) to the richest deciles (decile X). It emerges clearly that personal mobility limitations decline as income increases, and are always higher for women.

Policy implication of socioeconomic inequalities in functional health


While everybody is more likely to experience functional limitations as they age, significant gender and socioeconomic inequalities exist among Chilean older adults. Poor people present higher values in both severity levels of BADL limitations than rich people, and women are more affected than men.

These findings highlight the need for policies and programs to combat these socioeconomic inequalities in early adulthood in order to prevent and reduce limitations in functional health later in life. This goal will require significant changes in the social infrastructure and institutions around health, education, jobs, careers, pensions, legislation and community relationships.

The implication of living longer and achieving healthy ageing will inevitably place increased responsibility on the individual. The young generation most affected by increased longevity trends will require the most significant changes and adaptations in terms of education, careers, jobs and lifestyles.

References

  • CELADE. 2017. Long term population estimates and projections 1950-2100 Chile. 2017 Revision.
  • Fuentes-García A, Sánchez H, Lera L, Cea X, Albala C. 2013. Desigualdades socioeconómicas en el proceso de discapacidad en una cohorte de adultos mayores de Santiago de Chile. Gac Sanit. 27(3): 226–232.
  • Huang F, Fu P. 2021. Intergenerational support and subjective wellbeing among oldest-old in China: the moderating role of economic status. BMC Geriatr 21, 252. https://doi.org/10.1186/s12877-021-02204-y
  • Moreno X., Lera L., Moreno F. et al. 2021. Socioeconomic inequalities in life expectancy and disability-free life expectancy among Chilean older adults: evidence from a longitudinal study. BMC Geriatr 21, 176. https://doi.org/10.1186/s12877-021-02126-9.
  • Olivares-Tirado P, Zanga Pizarro. 2022. Socioeconomic Inequalities in Functional Health in Older Adults. Journal of Population Ageing 16(3). https://doi.org/10.1007/s12062-022-09404-3
  • Scott AJ. 2021. The longevity society. Lancet Healthy Longev. 2(12): e820-e827. doi: 10.1016/S2666-7568(21)00247-6.
  • Zhang CQ, Chung PK, Zhang R, Schüz B. 2019. Socioeconomic Inequalities in Older Adults’ Health: The Roles of Neighborhood and Individual-Level Psychosocial and Behavioral Resources. Front Public Health. 7:318. doi:10.3389/fpubh.2019.00318