
Showing posts with label география. Show all posts
Showing posts with label география. Show all posts
Monday, March 31, 2025

Wednesday, February 14, 2024
today

Improving Accessibility, Harmonisation and Data Linkage in Europe
In this digital event - organised in the framework of the EU-Funded project Mapping Inequalities Through the Life Course (Mapineq) - we will discuss key questions related to challenges and the future of data for social and health sciences in Europe.
You are kindly invited to join our next event on Thursday, 15 February 2024, 14:00-16:00 CET
Check out the Agenda and Register here
Speakers:
- Siri Eldevik Håberg, Director of the Centre for Fertility and Health, a Centre of Excellence (SFF) founded by The Norwegian Research Council.
- Tom Emery, Director of ODISSEI, the Dutch National Infrastructure for Social Science and Associate Professor in the Department of Public Administration and Sociology of Erasmus University Rotterdam.
- Jani Erola, Professor of Sociology at the University of Turku and Director of the INVEST Research Flagship Center.
- Andrea Ganna, Associate Professor in Health Data Science at the Helsinki Institute of Life Science (HiLIFE) and Research Associate at Harvard Medical School and Massachusetts General Hospital.
- Jan Paul Heisig, Head of the Research Group Health and Social Inequality at WZB Berlin Social Science Center and Professor of Sociology at the Freie Universität Berlin.
- Tina Hinz, Researcher at the division "Research Data Centre (FDZ)" at the German Federal Office for Migration and Refugees.
- Markus Jäntti, Professor of Economics at the Swedish Institute for Social Research at Stockholm University.
- Domantas Jasilionis, Researcher at the Max Planck Institute of Demographic Research and Member of the Human Mortality Database Executive Board.
- Aki Koivula, Senior Researcher at the INVEST Research Flagship Centre, University of Turku.
- Melinda Mills, Professor of Demography and Population Health at Oxford Population Health and Nuffield College, and Director of the Leverhulme Centre for Demographic Science and Demographic Science Unit at the University of Oxford. She is also Professor of Data Science and Public Health Policy at the University of Groningen and Department of Genetics, UMCG, the Netherlands.
- Daunia Pavone, Senior Data and Analysis Quality Advocate at the International Organization for Migration.
- Rodosthenis Rodosthenous, Research Coordinator at the Institute for Molecular Medicine in Finland and Head of the Sample and Data Logistics team at the FinnGen research project.
- Roxane Silberman, Scientific Advisor at the Secure Data Access Center (CASD) and Elected Chair of the European Statistical Advisory Committee (ESAC), one of the governance bodies of the European Statistical System and Eurostat.
Data Protection
Please note: on the basis of the applicable data protection regulations, your data will be collected, processed and used electronically by the Max Planck Society (represented here by the Max Planck Institute for Demographic Research) as part of your registration for this event.You can find out more about our data protection regulations and your data protection rights at: https://www.mpg.de/privacy-policy.
You can contact events@population-europe.eu at any time to obtain information about the data stored about you, to ask for changes of the data or to have the data deleted.
If you no longer wish to receive invitations, please send an e-mail with the subject "Unsubscribe" to: events@population-europe.eu
If you have further questions, please do not hesitate to contact us at any time.
Population Europe Secretariat
Markgrafenstr. 37
10117 Berlin
Phone: +49 30 2061 38330
Web: https://population-europe.eu/
E-mail: office@population-europe.eu
Tuesday, June 20, 2023
West Europe vs China

Население Западной Европы и Китая в доиндустриальную эпоху
Большую часть практически двухтысячелетнего периода истории с 0 до 1700 гг. нашей эры, население Западной Европы было или более-менее стабильно (всё первое тысячелетие н.э.), или плавно росло - за исключением периода распространения чумы в 14 веке, когда Европа потеряла порядка 40% населения
В Китае же всё было гораздо сложнее. Каждые 100-200 лет его истории население сначала увеличивалось в 2-3 раза, потом падало - примерно во столько же раз. С 20 миллиона в 200 году до н.э. до 60 к концу первого века до н.э. - и опять к 30 миллионам буквально за пару десятков лет. И такие колебания, связанные со сменой династий, приходом внешних завоевателей и другими событиями, происходили постоянно на протяжении тысячелетий!
К вопросу о том, почему культура и менталитет китайцев настолько отличаются от европейских, на самом-то деле
Thursday, April 27, 2023
aesthetics of maps
 |
| Оронций Фине. Recens et integra orbis descriptio. 1536. Национальная библиотека Франции |
Географические карты раннего Нового времени как эстетизация и концептуализация репрезентированного пространства
Антон Нестеров, Московский государственный лингвистический университет, Москва, Россия
Традиционно историков картографии больше интересовали карты, чем их декоративное оформление. Историков же искусств занимали либо вопросы, связанные с принципами передачи ландшафта на картах и в пейзажной живописи (Alpers 1983; Rees 1976; Rees 1980), либо проблематика так называемых «картографических залов» в итальянских палаццо (Соколов 1999: 249; Fiorani 2005). Тем самым и историки географии, и искусствоведы вопросы задавали, главным образом, именно карте: обращалось внимание на то, насколько точно представлен на ней соответствующий участок земной поверхности, как передан характер ландшафта и т. д. (Cosgrove 1985). После 1980-х гг. ситуация несколько изменилась – усилиями Дж. Б. Харли (Harley 1989a, Harley 1989b) и Д. Вудворта (Woodward 2007), испытавших на себе импульс постмодернистской философии, «карты перестали восприниматься в первую очередь как нейтрально-инертная фиксация морфологии того или иного ландшафта, или же как пассивное отражение мира объектов, но в них стали видеть преломленные образы, вносящие свой вклад в диалог, который ведут насельники социально сконструированных миров» (Harley 1988: 278). Характерным для постмодернистских подходов образом внимание к социальному обернулось вниманием к репрезентации властных отношений
per se
(Harley 1989; Crampton 2001; Herva 2010). В итоге оформилась школа, исходящая из того, что «картография везде и всегда имеет дело с внешне заданными и общераспространенными символическими формами и условностями, пусть это не осознается создателями и потребителями карт. Воздействие этих техник и эффектов становится предельно ясным, когда мы обращаемся к пропагандистским текстам как таковым. На самом базовом уровне используемая иконография заведомо адаптируется для коммерческой или политической пропаганды» (Pickles 2011: 402). В рамках указанного подхода о декоре географических карт писалось довольно много, но исследователей интересовали такие проблемы, как, например, воплощение европейских претензий на мировое господство, когда среди представленных на бордюрах карт раннего Нового времени аллегорических фигур континентов лишь Европа была увенчана короной (Wintle 1999: 147–159). Нас интересует несколько иной аспект проблематики, связанной с декоративным оформлением карт: как именно их визуальная «эстетика» определяет наше восприятие, как и насколько смыслы объекта (географической карты), заключенного в несущую «декоративные» функции рамку, этой рамкой деформируются и мутируют под ее воздействием? В XVII в. одна и та же карта могла издаваться в разных декоративных оформлениях – как при этом изменялась «семантическая нагрузка» самой карты?
Saturday, April 22, 2023
Paths of Russian Avant-Garde Poetry in Israel

2023, Paths of Russian Avant-Garde Poetry in Israel, ed. Roman Katsman and Maxim D. Shrayer (Boston: Academic Studies Press, 2023).
Maxim D Shrayer
Tuesday, February 14, 2023
geopolitical stability
Индекс геополитической стабильности стран мира

В индексе геополитической стабильности - посчитанном ещё до начала "спецоперации" по данным 2020 года! - Россия набрала 20.8 баллов из 100 и заняла почётное (нет) восьмое с конца место
Ниже всего оценили геополитическую стабильность Пакистана и Мьянмы. Дальше идёт достаточно плотная группа из Бангладеш, Индии, Мексики, Филиппин, Папуа Новой Гвинеи и России.
Стабильнее (по-настоящему, а не так, как по нашему телевидению рассказывают...) всех оказалась Новая Зеландия, набравшая близкие к теоретически возможному максимуму 97.6 баллов. Высокий результат также показали Сингапур, Бруней, Канада и Япония
И, как видим по происходящему в последний год - такие индексы действительно имеют определённую предсказательную силу - в одном из самых "напряжённых" мест действительно напряжение вылилось в вооружённый конфликт.
Friday, February 10, 2023
Earth's Moving Plates
On February 6 and 7, the Southeast of Turkey and the Northwest of Syria have been hit by devastating earthquakes. In addition to the main tremor that reached a magnitude of 7.8 on the Richter scale, more than 20 aftershocks with magnitudes between 5.0 and 7.5 were registered in the earthquake-ravaged region around Gaziantep. Since Monday, the death toll of the disaster has climbed to 17,000 in Turkey and neighboring Syria, according to CNN.
The cause of the Turkey-Syria earthquake - and all other earthquakes - lies in the phenomenon of plate tectonics, i.e. the continental drift of the plates which make up the Earth's mantle. As our graphic shows, several such plates meet in Turkey, which significantly increases the risk of serious earthquakes. Even more importantly, some plates in Turkey move convergently, i.e. they are approaching each other, which also makes major earthquakes more likely than in places where plates move apart. More specifically, the East Anatolian fault - along which this week's earthquake occurred - is characterized by a convergent boundary with the African plate to the south and a transform boundary of horizontal movement with the Eurasian plate to the north. This further exemplifies how much seismic activity is present in the region that has now been turned into a disaster zone.
Turkey lies on the Anatolian Plate, which is on the line of tension between the Arabian and Eurasian Plates. The African Plate, which contributed to the formation of the Alps 60 million years ago by drifting north, also borders the Anatolian Plate. Along the edges of the Pacific Plate runs the so-called Ring of Fire responsible for much of the world's volcanic activity - another place where convergent plate boundaries exist. Other plates are the Australian, North American and South American plates. The strongest earthquakes in recent history all took place along the Ring of Fire, which also includes the well-known Mariana Trench, around the Pacific Plate. An earthquake with a magnitude of 9.5 was measured in Valdiva, Chile, in 1960. In 2004, an earthquake in the Indian Ocean off Sumatra reached a magnitude of 9.1 to 9.3 and in 2011 in the Japanese region of Tōhoku, an undersea earthquake with a magnitude of 9.1 and the ensuing tsunami caused widespread devastation and numerous deaths.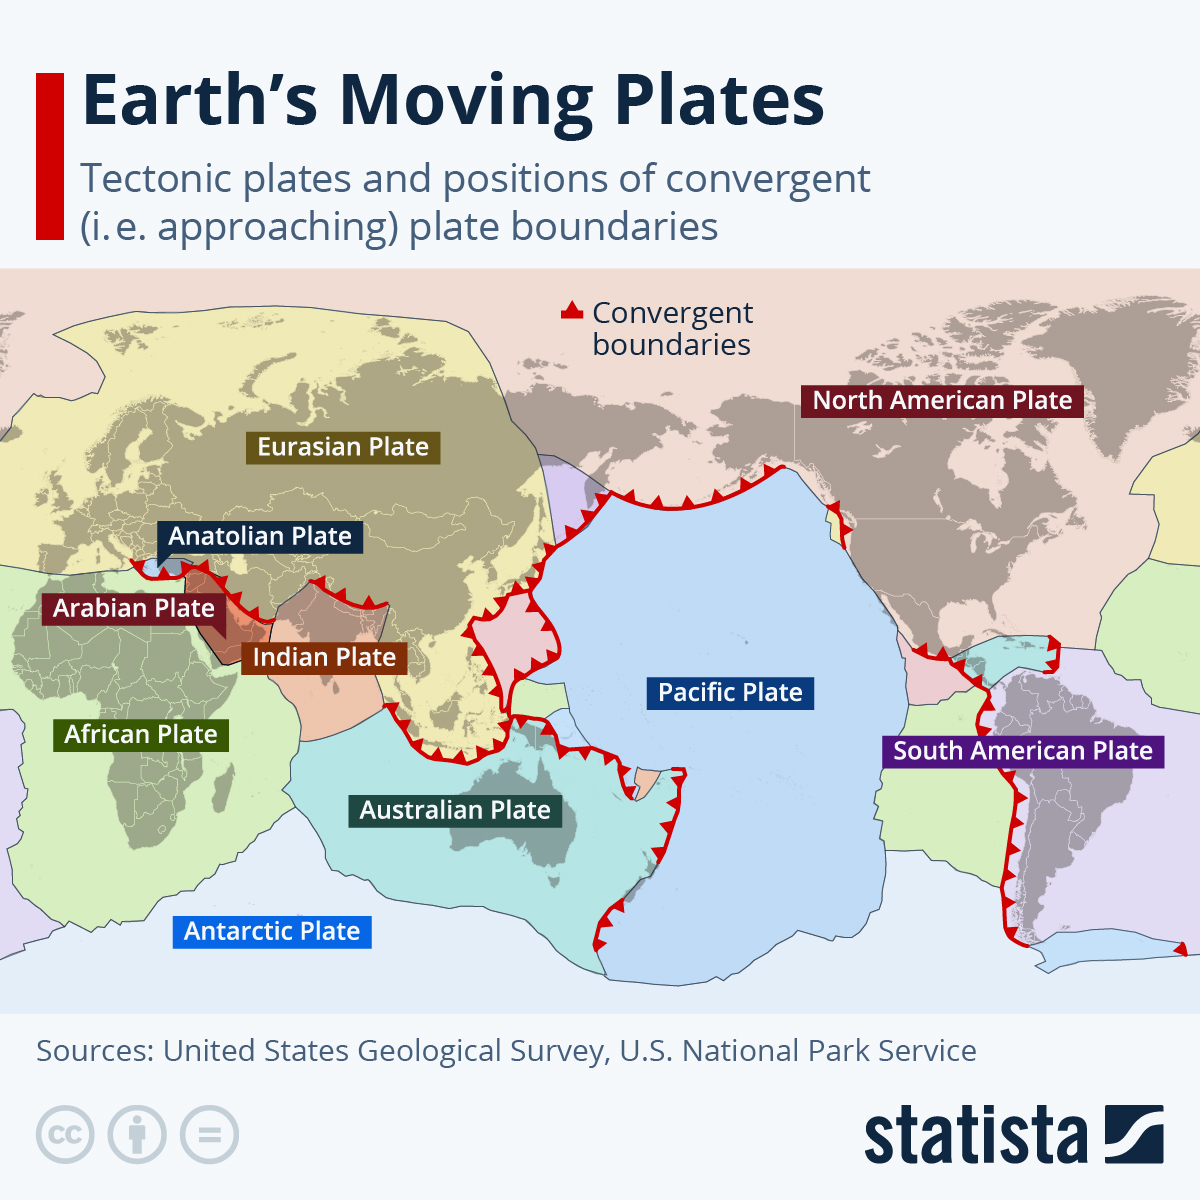
The cause of the Turkey-Syria earthquake - and all other earthquakes - lies in the phenomenon of plate tectonics, i.e. the continental drift of the plates which make up the Earth's mantle. As our graphic shows, several such plates meet in Turkey, which significantly increases the risk of serious earthquakes. Even more importantly, some plates in Turkey move convergently, i.e. they are approaching each other, which also makes major earthquakes more likely than in places where plates move apart. More specifically, the East Anatolian fault - along which this week's earthquake occurred - is characterized by a convergent boundary with the African plate to the south and a transform boundary of horizontal movement with the Eurasian plate to the north. This further exemplifies how much seismic activity is present in the region that has now been turned into a disaster zone.
Turkey lies on the Anatolian Plate, which is on the line of tension between the Arabian and Eurasian Plates. The African Plate, which contributed to the formation of the Alps 60 million years ago by drifting north, also borders the Anatolian Plate. Along the edges of the Pacific Plate runs the so-called Ring of Fire responsible for much of the world's volcanic activity - another place where convergent plate boundaries exist. Other plates are the Australian, North American and South American plates. The strongest earthquakes in recent history all took place along the Ring of Fire, which also includes the well-known Mariana Trench, around the Pacific Plate. An earthquake with a magnitude of 9.5 was measured in Valdiva, Chile, in 1960. In 2004, an earthquake in the Indian Ocean off Sumatra reached a magnitude of 9.1 to 9.3 and in 2011 in the Japanese region of Tōhoku, an undersea earthquake with a magnitude of 9.1 and the ensuing tsunami caused widespread devastation and numerous deaths.
Saturday, October 1, 2022
The geography of abortion

Discourse, spatiality and mobility
Abortion has historically been ignored in geography. Although bodies and pregnancy have been increasingly studied since the 1990s, a reticence around abortion remains. In recent years, however, this has begun to change. This article critically reviews how geographers and other scholars are now considering abortion and uses three conceptual lenses of discourse, spatiality and mobility to argue that abortion should be a mainstream topic of critical concern for geographers. Through these themes we show that geographical attention to abortion makes questions of space, power, and citizenship visible in new ways and, furthermore, in ways that are only recently possible.
© The Author(s) 2022
Article reuse guidelines:
sagepub.com/journals-permissions
DOI: 10.1177/03091325221128885
journals.sagepub.com/home/phg
Monday, May 2, 2022
geography of emigration

География эмиграции: куда россияне уезжают от войны?
Федеральная служба безопасности России, к ведению которой относится пограничная служба, признала резкий рост числа покинувших страну граждан в январе – марте 2022 года, сообщает «Радио Свобода».
Куда они уезжают по данным портала официальной статистики (ЕМИСС):
Постсоветские страны
▪️ Армения – 134 тыс (годом ранее 44 тыс)
▪️ Азербайджан - 56 тыс (годом ранее 20 тыс)
▪️ Узбекистан – 53 тыс (годом ранее 15 тыс)
▪️ Таджикистан – 40 тыс (годом ранее 8 тыс)
▪️ Грузия – 38 тыс (годом ранее 8 тыс)
Арабские страны
▪️ Египет - 351 тыс (годом ранее 16 тыс),
▪️ Саудовская Аравия - 5 тыс (годом ранее 45)
▪️ ОАЭ - 263 тыс (годом ранее 115 тыс)
#армения #азербайджан #узбекистан #таджикистан #египет #саудовскаяаравия #оаэ
Thursday, September 2, 2021
Where World Heritage is Located
Italy is home to the largest number of UNESCO world heritage sites in the world. After the annual announcement of new sites by the UNESCO committee, the country now boasts 58 world heritage locations. New additions are the porticoes, or sheltered walkways, of Bologna, the fourteenth-century fresco cycles of Padua as well as the Montecatini Terme of Tuscany, part of the designation of "The Great Spa Towns of Europe", which stretch across seven countries.
With the new announcement, Italy pulls ahead of China. Formerly head-to-head at 55 properties each, China could only add one site - the Song-Yuan era Emporium of the World in Quanzhou - leading to a total of 56 properties for the country.
With 51 world heritage sites, Germany now ranks third ahead of Spain and France after having made a whopping five new additions. The Mathildenhöhe historic artists colony in Darmstadt, Jewish sites in Speyer, Worms and Mainz and appearances among the European spa towns are included in these as well as the Roman Empire Lower German Limes (shared with the Netherlands) and the Danube Limes (shared with Austria and Slovakia).
In total, the UNESCO list includes 1,155 monuments in 167 countries as world heritage sites. No matter how many additions a country could make, any new property on the list is sure to boost tourism when winning the prestigious label. The U.S. remained at 24 listed sites in 2021, thereby leaving the top 10. The listed properties include the Grand Canyon, Yellowstone National Park, the Taos Pueblo and Philadelphia’s Independence Hall. The UK added two properties - the slate landscape of Northwest Wales and Bath as part of the spa towns of Europe - but sadly also lost one. The Maritime Mercantile City in Liverpool was deleted due to new building developments in its area.
With the new announcement, Italy pulls ahead of China. Formerly head-to-head at 55 properties each, China could only add one site - the Song-Yuan era Emporium of the World in Quanzhou - leading to a total of 56 properties for the country.
With 51 world heritage sites, Germany now ranks third ahead of Spain and France after having made a whopping five new additions. The Mathildenhöhe historic artists colony in Darmstadt, Jewish sites in Speyer, Worms and Mainz and appearances among the European spa towns are included in these as well as the Roman Empire Lower German Limes (shared with the Netherlands) and the Danube Limes (shared with Austria and Slovakia).
In total, the UNESCO list includes 1,155 monuments in 167 countries as world heritage sites. No matter how many additions a country could make, any new property on the list is sure to boost tourism when winning the prestigious label. The U.S. remained at 24 listed sites in 2021, thereby leaving the top 10. The listed properties include the Grand Canyon, Yellowstone National Park, the Taos Pueblo and Philadelphia’s Independence Hall. The UK added two properties - the slate landscape of Northwest Wales and Bath as part of the spa towns of Europe - but sadly also lost one. The Maritime Mercantile City in Liverpool was deleted due to new building developments in its area.
Sunday, August 8, 2021
the geographer drank the globe

Шойгу предложил переселить москвичей в Сибирь
Новые города-миллионники в Сибири могут стать противовесом гипертрофии столицы
София Сачивко
Перенести столицу в Сибирь и построить здесь несколько новых городов предлагает глава Русского географического общества и министр обороны РФ Сергей Шойгу.
«Нам необходимо в Сибири построить три, а лучше пять крупных [7 ещё больше] центров научно-промышленных, экономических центров, проще говоря, городов с населением 300−500 тысяч, лучше — до миллиона человек», — заявилон на встрече с научной общественностью Сибирского отделения РАН.
Глава РГО также добавил, что надо не просто построить и перенести сюда столицу, а сделать эти города направленными конкретно на ту или иную сферу деятельности. [ешё 3-5 моногородов]
Сергей Шойгу напомнил, что незадолго до распада Советского Союза подобные планы существовали и выразил сожаление, что их не удалось осуществить. [как же им нравится развалины СССР!]
Председатель Наблюдательного совета Института демографии, миграции и регионального развития Юрий Крупнов считает идею Сергея Шойгу императивом спасения страны:
— Это не одна из возможных сейчас идей, а то, что является абсолютным приоритетом. Без восстановления сбалансированного пространственного развития (а это только перенос столицы, то есть главного политического города страны на восток, за Урал) страна может переломится надвое, примерно по Уральскому хребту. Крайний запад (прежде всего, Москва, Петербург), который является притяжением для всей страны, особенно Москва с ее гиперцентрализацией, изо дня в день опустынивает, обезлюдивает всю страну, разрушает нашу пространственную систему.
Выход только один — размосквичивание, но не в хаотическом виде, а с переносом политического центра страны. Нельзя не приветствовать заявление Шойгу, но по его расплывчатости, очевидно, что в верхних эшелонах власти четкого понимания, осознания такого императива нет, а время давно пришло.
«СП»: — Так ли надо переносить столицу?
— Это даже не вопрос внутренней политики. Это вопрос геополитики [кстати, в СССР, считавшаяся строго лженаукой, типа флюоресценции] и главное условие обеспечения суверенитета страны на ближайшие 30−50 лет. Это меняет всю планетарную архитектонику. Это такое действие, которое на порядки усилит Россию в мире. Это не только решение наших внутренних перезревших вопросов, но и изменения всей геометрии мира. Мы пойдет к тихоокеанскому развитию, в Азию. [боюсь, "иы" останется на месте и ни и никуда не пойдёт, хотя отдельно взятого Крупного можно выселить] Это беспрецедентное решение.
«СП»: — Зачем строить новые города? Ведь в Сибири они уже есть, и довольно крупные. Может, лучше их развивать?
— Надо ли строить новые города-миллионники — вопрос не очевидный. С моей точки зрения надо опираться на существующие города. Омск и Новосибирск должны стать опорными для Сибири. Омск, с моей точки зрения, надо делать столицей.
«СП»: — Не получится так, что сейчас на разработку соответствующей концепции потратят миллиарды, создадут какие-то структуры, а на выходе будет как с Новой Москвой?
— Новая Москва — пример абсолютно губительного решения, которое только усиливает гиперцентрализацию страны. Главное не в том, чтобы построить 3−5 новых городов или развивать существующие и т. д., главное — политический центр перенести за Урал.
Если в ближайшие 2−3 года мы не начнем переносить столицу, мы не сохраним Россию. Речь идет о жизни и смерти страны. Все разговоры о затратах и прочее надо обсуждать отдельно.
Нурсултан Назарбаев в 1995 году, в самые тяжелые кризисные годы, начал переносить столицу. Это было совсем недавно. А мы все абстрактно обсуждаем вместо того, чтобы сделать единственно верный шаг, без которого все разговоры о суверенитете не просто пустые, а вредные, потому что без переноса политического центра тяжести мы можем исчезнуть как держава, потому что не удержим такое огромное пространство.
Д.геогр.н., гл. н.с. Института географии РАН Андрей Трейвиш заметил, что вопрос переноса столицы сложен и обсуждается давно:
— Каких только предложений не было — и на Урал, и в Сибирь, и в Поволжье. В мире такие случаи бывают. Как правило, строят новую чисто политическую столицу без каких-либо других функций. Например, Бразилиа. Рано или поздно такая столица превращается, как минимум, в один из крупных городов.
Это очень сложное, дорогостоящее мероприятие, часто довольно болезненное. Как правило, такие прожекты кончаются ничем, но есть пара десятков стран, где это происходило в 20 веке. Чаще всего в развивающихся странах. [но Рф этим не может похвастаться]
Для чего переносить столицу в Сибирь? Если посмотреть на соотношение европейской и зауральской России, то Зауралье — огромная территория, природные ресурсы, но там значительно меньшая часть населения. Кого возглавляет столица? Территорию или людей? Лучше, когда и то, и другое. Но у нас население сосредоточено в европейской части.
В советское время понадобилось 40 лет, чтобы удвоить дореволюционное население Дальнего Востока. Сейчас оно убывает. Конечно, если туда перенести столицу, возможно, что-то изменится, но эта столица будет на еще большем отшибе от основной массы населения и экономики, чем построенный Петром Первым Петербург.
«СП»: — Надо ли строить в Сибири новые города?
— Это было бы очень желательно для регионального развития [в мозгу?] страны, особенно если речь идет о крупных городах, а не маленьких поселениях, связанных, например, с добычей полезных ископаемых. Но где, зачем? Где взять хотя бы демографические ресурсы, не говоря о финансовых?
«СП»: — Может, лучше потратить финансы на развитие существующих городов? Например, на научный потенциал Новосибирска.
— Новосибирск и Екатеринбург и так оспаривают право называться третьей столицей России. Часто говорят: Новосибирск — столица Сибири.
Существующие крупные города можно пытаться усиливать прежде всего за счет инфраструктуры — транспорта, подтягивания пригородов, чтобы агломерация была плотнее. Но даже Новосибирск и Екатеринбург — это всего лишь полуторамиллионники. Они все равно меньше Питера, который в 2 с лишним раза больше, и тем более меньше Москвы.
Самая главная проблема в современной России — это демографические ресурсы. «Что, туда пол Москвы отселите?» — спрошу я Сергей Кужугетовича. Каким образом? Добровольно-принудительно? [с упором на второе] Мало, кто поедет. Желающих не особенного много найдется. Наоборот, все в Москву стремятся.
С другой стороны, такие центры-противовесы очень желательны, потому что гипертрофия Москвы стала почти признанным фактом. О ней мало пишут в официальной прессе, а в научной — довольно много.
Слишком велик разрыв в уровне жизни, оплате труда за одну и ту же работу в Москве и других регионах. В Сибири хотя бы есть такой источник дохода, как нефть, который ускорил развитие Тюмени и северных районов.
У нас не хватает мощного центра на Дальнем Востоке, можно было бы попытаться усилить Владивосток, который уже опередил Хабаровск. Вокруг него довольно мощная группировка.
Иркутск и Владивосток — это всего два крупных городских сгустка за Енисеем. Это не совсем агломерации (то, что связано ежедневными транспортными возможностями), это более рыхлые группировки, растянутые в пространстве. Их можно усилить, сплотить, чтобы далекие пригороды были больше подтянуты и получили стимулы для роста, строительства жилья и т. д. Это приведет к стягиванию местного населения в эти группировки. Наверное, поэтому и возникает идея о строительстве новых городов.

Tuesday, April 27, 2021
administrative fervor
.jpg "Marat Khusnullin (2020-02-05)") |
Хуснуллин назвал избыточным число регионов в России
18:48 27.04.2021 (обновлено: 19:38 27.04.2021)
"Это пока мое личное мнение и неофициальная позиция, так как они не согласованы с правительством. Я считаю, что 85 регионов нам не нужно", — сказал он, выступлая на XXII Апрельской международной научной конференции по проблемам развития экономики и общества.
Замглавы правительства отметил, что в частности Еврейскую автономную область следует объединить, например, с Хабаровским краем. Хуснуллин также задался вопросом, почему жители Курганской области должны жить хуже тюменцев, в то время, когда они проживают на расстоянии всего 190 километров друг от друга.
"У одних есть нефтяные доходы, у других нет. Они что жители другой страны? [...] Думаю, что после сентябрьских выборов мы к этой теме вернемся", - добавил Хуснуллин.
Объясняя свою позицию, он отметил, что в настоящее время в России есть несколько регионов, которые не в состоянии выполнять задачи и поручения правительства.
"Они (губернаторы. – Прим. ред.) ходят на встречу к президенту, ходят ко мне, тратят наше время. Концентрацию нужно делать на точках роста", — подытожил Хуснуллин.
Как уточнил РИА Недвижимость представитель вице-премьера, в ходе конференции тот озвучил исключительно варианты развития городов. По его словам, возможность объединения регионов в правительстве не прорабатывается.
МОСКВА, 27 апр – РИА Недвижимость. Вице-премьер России Марат Хуснуллин заявил, что число регионов в России следует сократить.
"Это пока мое личное мнение и неофициальная позиция, так как они не согласованы с правительством. Я считаю, что 85 регионов нам не нужно", — сказал он, выступлая на XXII Апрельской международной научной конференции по проблемам развития экономики и общества.
Замглавы правительства отметил, что в частности Еврейскую автономную область следует объединить, например, с Хабаровским краем. Хуснуллин также задался вопросом, почему жители Курганской области должны жить хуже тюменцев, в то время, когда они проживают на расстоянии всего 190 километров друг от друга.
"У одних есть нефтяные доходы, у других нет. Они что жители другой страны? [...] Думаю, что после сентябрьских выборов мы к этой теме вернемся", - добавил Хуснуллин.
Объясняя свою позицию, он отметил, что в настоящее время в России есть несколько регионов, которые не в состоянии выполнять задачи и поручения правительства.
"Они (губернаторы. – Прим. ред.) ходят на встречу к президенту, ходят ко мне, тратят наше время. Концентрацию нужно делать на точках роста", — подытожил Хуснуллин.
Как уточнил РИА Недвижимость представитель вице-премьера, в ходе конференции тот озвучил исключительно варианты развития городов. По его словам, возможность объединения регионов в правительстве не прорабатывается.
Когда работал в ЦЭНИИ у меня был приятель, он предлагал мне написать статью про Оренбургскую область, чтобы разделить её на две: Оренбургскую и Орскую, одна явно — Поволжье, другая — Урал. Ни тогда приятеля не понял, ни сегодня Хуснулина.
Friday, April 23, 2021
illegal HIV+ migrants access to health care

Уважаемые коллеги,
приглашаем вас принять участие в научном семинаре Института демографии им. А.Г. Вишневского
«Демографические вызовы XXI века»,
который состоится 27 апреля 2021 года.
С докладом на тему
«Барьеры и неформальные стратегии доступа к медицинской помощи трудовых мигрантов, живущих с ВИЧ-инфекцией, в России в условиях нелегальности»
выступит Даниил Кашницкий, аспирант Института демографии им. А.Г. Вишневского НИУ ВШЭ, младший научный сотрудник Института социальной политики НИУ ВШЭ.
Оппоненты:
Сакевич Виктория Ивановна, кандидат экономических наук, старший научный сотрудник Института демографии им. А.Г. Вишневского НИУ ВШЭ,
Флоринская Юлия Фридриховна, кандидат географических наук, ведущий научный сотрудник Института социального анализа и прогнозирования РАНХиГС при Президенте РФ.
Аннотация выступления:
В исследовательском проекте (в рамках учебы в аспирантуры) я предпринял попытку изучить формальные и неформальные стратегии доступа к здравоохранению среди иностранных мигрантов с ВИЧ-инфекцией в России. На примере данной группы мигрантов исследую, как государство формирует пространство легальной неопределенности, таким образом осуществляя контроль над мигрантами. Также я проблематизирую вопрос отсутствия реальных данных о заболеваемости и распространенности ВИЧ-инфекции среди иностранных мигрантов в России.
Саму по себе миграцию не следует понимать как фактор риска заболеваний, однако низкий доступ к медицинским услугам, разлука с семьей, незащищенный труд, проживание в плохих условиях и ограниченная осведомленность о рискованном поведении негативно влияют на социальные детерминанты здоровья и способствуют уязвимости мигрантов к ВИЧ, туберкулезу, а также способствуют повышенному травматизму и другим заболеваниям.
Согласно ФЗ-38, Россия запрещает законное пребывание ВИЧ-инфицированным иностранцам. Следовательно, значительная часть иностранцев с ВИЧ вынуждена скрывать свой ВИЧ-статус и проживать в нелегальном статусе, в случае если они не могут вернуться в домой в свою страну исхода. Такие мигранты остаются без доступа к специализированной терапии для лечения ВИЧ-инфекции, а также не могут получить медицинский полис ОМС для обращения с другими проблемами медицинского характера.
Исследование основано на качественных интервью с экспертами НПО, докторами и 15 ВИЧ-положительными людьми с опытом проживания в России в качестве иностранных мигрантов. Я детально обсуждаю эпидемиологические, экономические и социальные последствия запрета проживания иностранных мигрантов с ВИЧ-инфекцией в контексте миграционной политики, формулируя рекомендации и пытаясь наметить вехи для дальнейших научных и научно-практических исследований в этой области.
Начало семинара в 12:00.
Семинар состоится онлайн в ZOOM (см. инструкцию).
Рабочий язык: русский.
Всех, кто планирует принять участие в семинаре, просим подтвердить участие до 10:00 27 апреля, заполнив форму https://zoom.us/meeting/register/tJ0lcumrqjkiHdSLS2tP0Egnd5tLgPL3qUDi
При возникновении проблем при регистрации и подключению к семинару вы можете написать по e-mail: valergany@gmail.com (Валерий Юмагузин).
Будем рады встрече!
Monday, September 14, 2020
The spatial integration of immigrants in Europe
Published on N-IUSSP.ORG September 14, 2020
Working on 1,396 sub-regional areal units, Daniel T. Lichter, Domenico Parisi, and Shrinidhi Ambinakudige show that in almost all European countries, immigrants from outside Europe are less spatially integrated with the native population than are immigrants from other countries within Europe. Differences in immigrant-native spatial integration are reflected in the large numbers of immigrant regional “hot spots” which are driven by public policy and idiosyncratic political considerations at the national and regional or sub-regional levels.
Throughout much of Europe, new waves of immigration have raised concerns about cultural fragmentation and disunity, interethnic conflict, and growing antipathy toward immigrants. Our goal is to provide up-to-date comparative evidence of uneven patterns of population concentration, at multiple geographical levels, among immigrants and natives, both within and between European countries. Previous studies have mostly centered on neighborhood-to-neighborhood differences in immigrant residence patterns within a single city. Other studies have compared neighborhood segregation between several cities within a single country, or examined a small number of cities in countries sharing common cultural or economic characteristics (Musterd 2005; Massey 2016).
We focus instead on patterns of macro-segregation within countries, using the 1396 sub-regional or county units, as defined by the Nomenclature of Territorial Units for Statistics (NUTS 3; Eurostat 2018b).
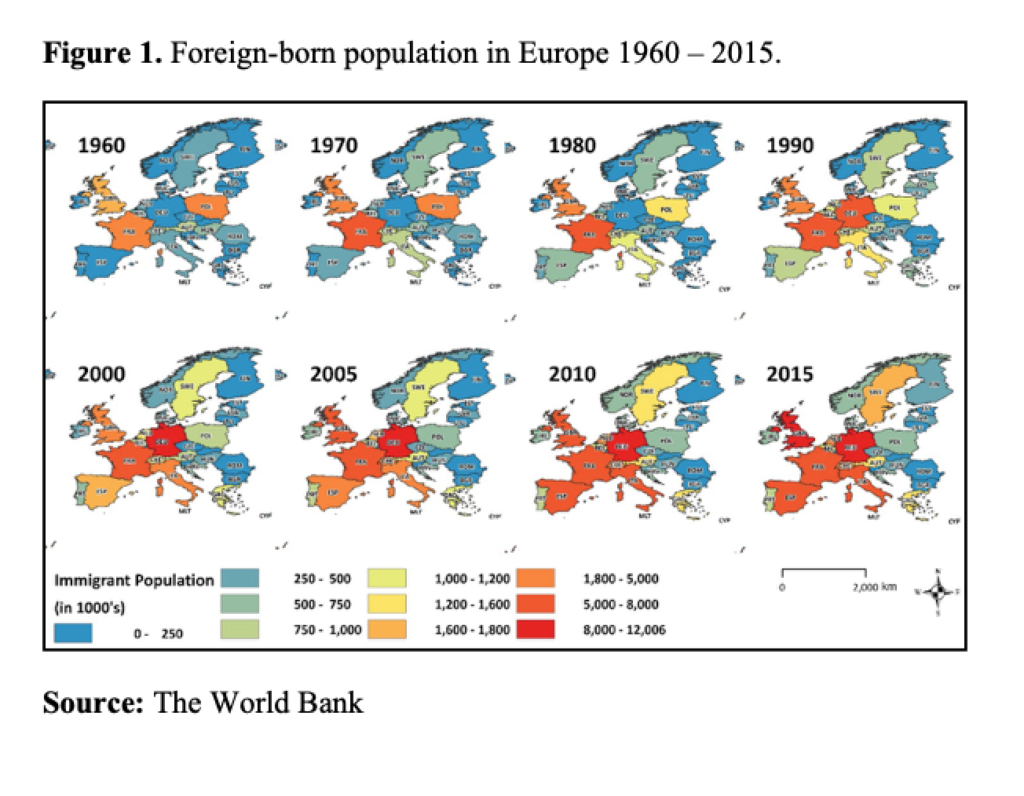
In Europe, macro-segregation is revealed, first and foremost, in large country-to-country differences in the presence of immigrant (i.e. foreign-born) populations, and in their evolution over time (Figure 1).
However, variation across countries conceals substantial spatial variation within countries. Figure 2 displays the sub-regional areal unit (NUTS 3 level) map, by classes of relative foreign presence:
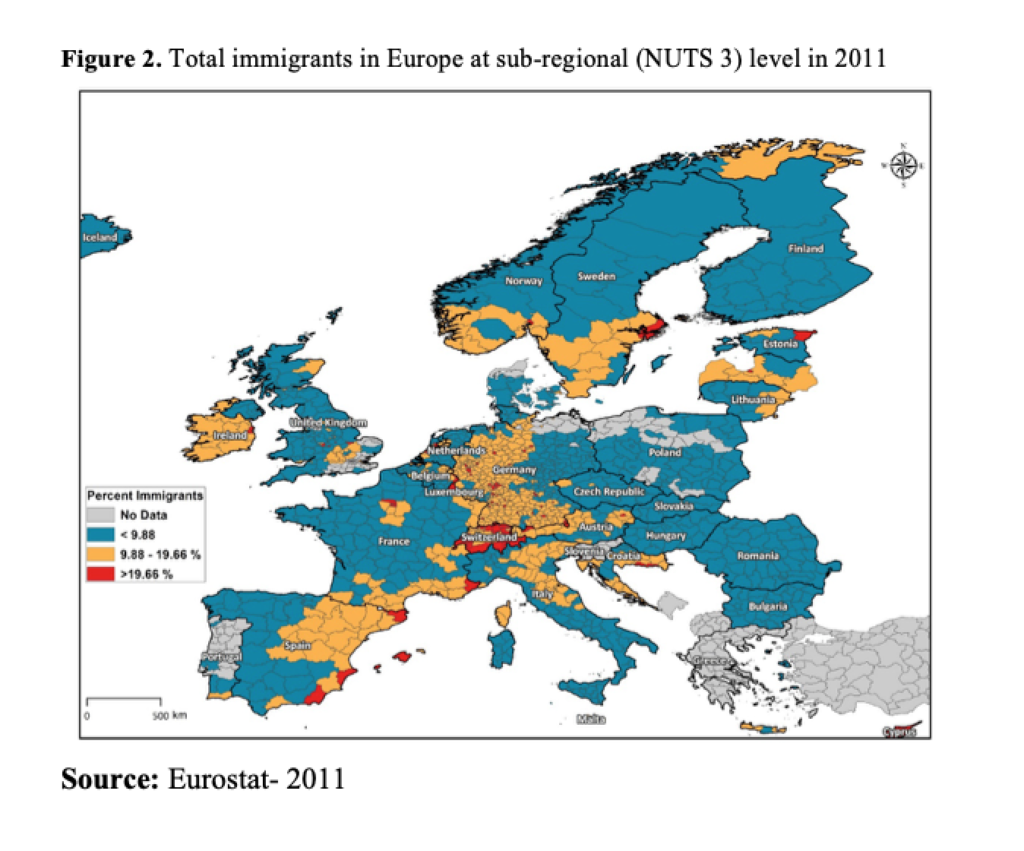
Large parts of Eastern Europe (Poland, Slovakia, Hungary, and Romania) are overwhelmingly native-born, as is the case in much of Finland and outlying rural areas in Sweden, Norway, and France. But even in low-immigration countries there are clear regional “hotspots” of immigrant population concentration. In Finland, immigrants are concentrated along the southern (e.g., in the Helsinki metro area) and western coasts (near Vaasa), and in Hungary, in the Budapest region (which does not show in the data, because percentages are below the overall European average in all cases).
In Italy, France, and the United Kingdom, the spatial distribution of immigrants is more highly concentrated (e.g., in the London area in the U.K.; Northern Italy; and Paris, Lyon, and Marseille in France). Immigrants are distributed in high percentages across much of the western part of Germany, with immigrant “hotspots” similarly distributed broadly across this region of the country. The former East Germany, on the other hand, is mostly comprised of native-born German populations and has experienced substantial net outmigration to Berlin and regions of former West Germany with stronger economic growth and more job opportunities, and where native populations are much less virulently anti-immigrant in sentiment.
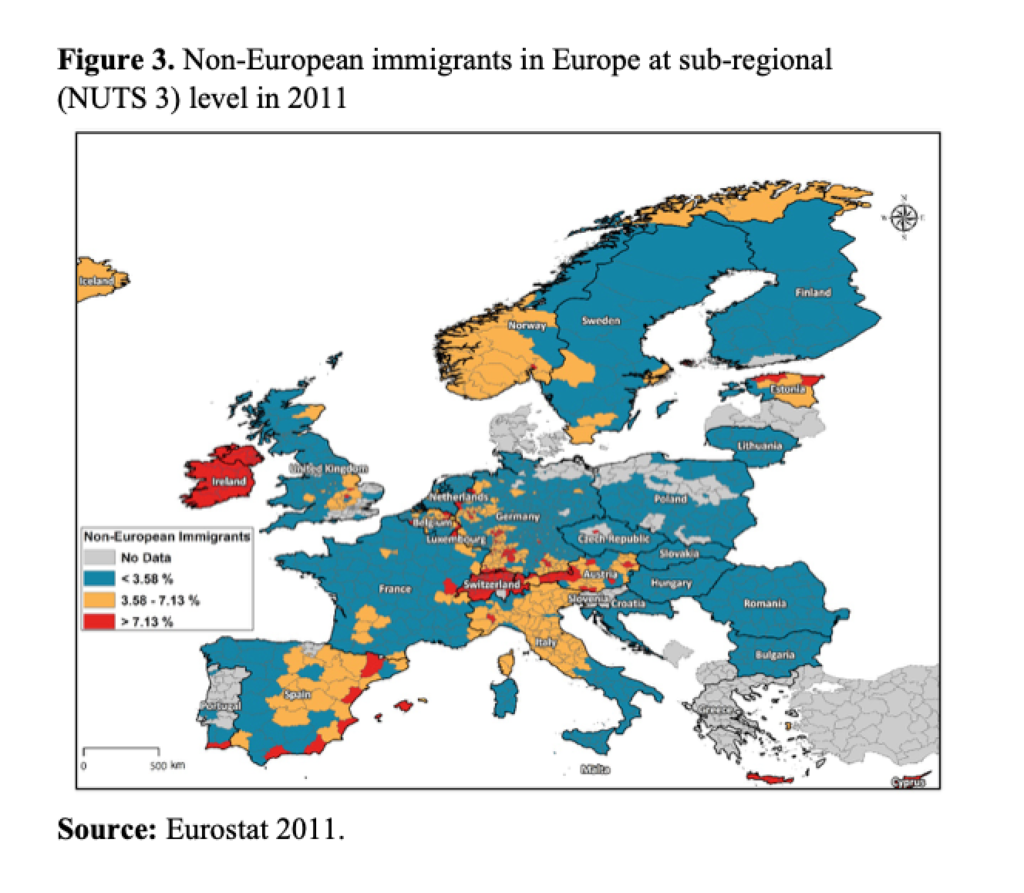
Immigrant population concentration is more uneven when we consider regional “hotspots” of non-European immigrants. Despite the nationalistic anti-immigrant fervor observed across parts of the EU, immigrants from outside Europe actually represent just 3.58 percent, on average, of the total population across sub-regions. Figure 3 reveals the uneven spatial distribution of non-European immigrants at levels below, above, and well above this figure. Non-European immigrants (from Asia and parts of Africa, especially Nigeria) are concentrated in parts of Northern Ireland and Switzerland (and surrounding areas in Germany, France, and Austria). Comparatively large shares of non-European immigrants (most often originating from the former Soviet Union) are also present in Estonia and in other densely populated parts of Europe (e.g., Brussels in Belgium, Barcelona and Madrid in Spain). In Germany, above-average percentages of immigrants from Turkey, Greece, and Russia and other groups (Asians) are found in North Rhine-Westphalia (e.g., Cologne), Baden-Württemberg, and Bavaria (e.g., Munich).
To examine macro-segregation, Table 1 provides immigrant-native segregation indices (D’s) that summarize the uneven within-country spatial distribution of immigrants across European countries. Here, segregation is defined by the uneven distribution of immigrants and natives across NUTS 3 units (i.e., sub-regions or counties). The overall mean D is 19.7 for all 27 European sub-regional areal units, which means that, on average, nearly one in five immigrants (or natives) would have to move to another sub-regional areal unit (another NUT 3 unit) within their country of residence to achieve residential parity with the native-born population.
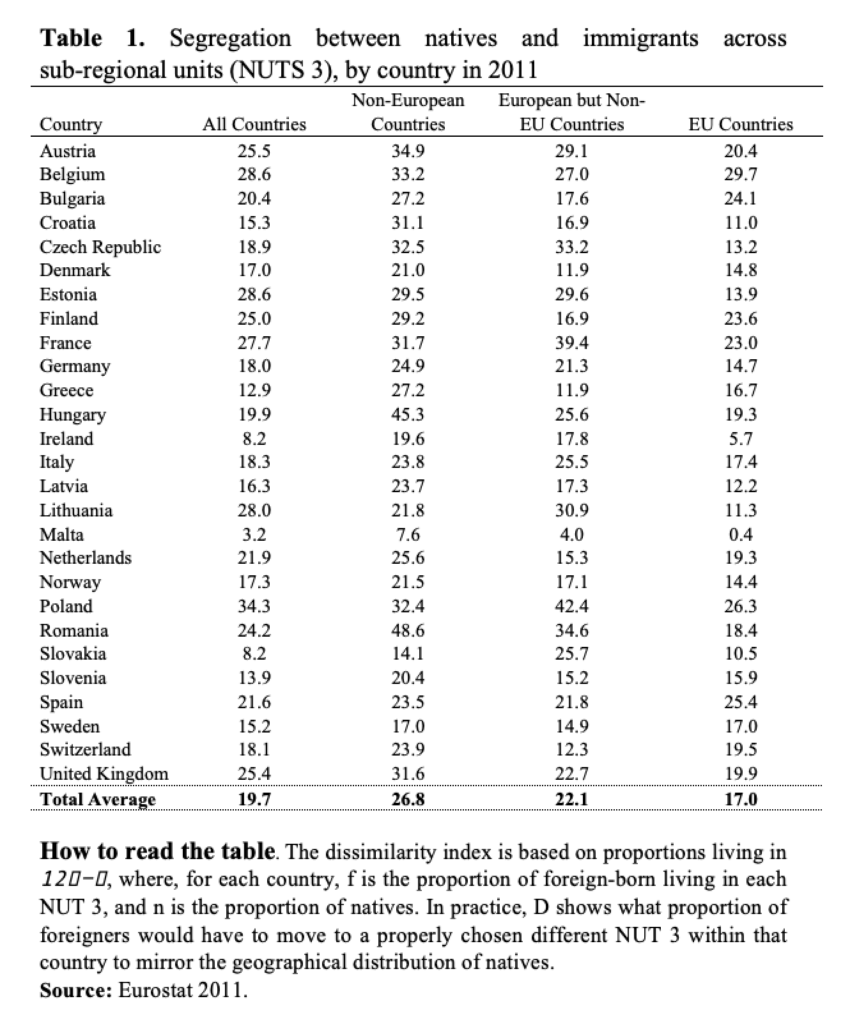
These estimates of immigrant-native macro-segregation vary substantially across European countries. At the low end, D’s in Malta (3.2), Slovakia (8.2) and Ireland (8.2) suggest that natives and immigrants are spatially integrated at the macro scale. High levels of county-to-county segregation (i.e., macro-segregation) are plainly evident in Poland (34.3), Belgium (28.6), Estonia (28.6), and Lithuania (28.0). These figures also imply that these countries are home to clearly identifiable regional immigrant “hotspots”.
Much of the new immigration in Europe involves the movement of Europeans who share common economic or cultural advantages (e.g., high education) that make segregation less pronounced. Indeed, a large but minority share of the 38.7 million foreign-born residents in the EU-28 or one of the four European Free Trade Association (EFTA) countries (i.e., Iceland, Liechtenstein, Norway, and Switzerland) originated from another EU/EFTA country (16.9 million). The clear implication is that immigrants from another European country are much more likely than non-European immigrants to avoid racialization (e.g., Icelanders in the UK), which can be a serious barrier to integration for immigrants from Africa, the Middle East, or Asia. These data also suggest that simple summary estimates of overall immigrant-native segregation may conceal substantial variation in segregation among non-Western immigrants across Europe.
Columns 2-4 in Table 1 provide immigrant-native segregation scores for immigrants from non-European countries, from European countries, and from European Union member states. In every country except Spain and Sweden, segregation rates are higher among immigrants from non-European countries (26.8) than among those from European Union member countries (17). Segregation from natives occupies an intermediate position among immigrants of non-EU European origin. For immigrants from outside Europe, D’s ranged from a low of 7.6 in Malta to highs of 48.6 in Romania and 45.3 in Hungary, largely reflecting the concentration of immigrants in (a few) large cities.
Our empirical goal was to provide cross-country multiscale indicators of integration or segregation that answer the question of whether immigrant minority populations share the same social and geographic space as the native-born or majority populations in Europe.
Our results on macro-segregation suggest at least three general conclusions. First, immigrant-native segregation patterns vary widely between and within European countries with very different economies, demographic conditions, and histories of immigration. Additional analyses of country-specific policy have underscored the difficulty in fully accounting for cross-sectional patterns of national and regional segregation among immigrants (Lichter, Parisi, and Ambinakudige 2020).
Second, in almost all European countries, immigrants from outside Europe or the EU are more segregated from natives than are immigrants from other countries in Europe.
Third, and finally, our analyses reinforce recent calls to consider residential integration at alternative levels of geography—from the micro to macro scale (Andersen et al. 2018; Lichter, Parisi, and Taquino 2016).
Our results speak directly to the growing body of research on the emergence and geographic spread of new immigrant destinations or gateways. Immigrants from around the world are dispersing across Europe, but they also are concentrating unevenly at national, regional, and sub-regional levels.
Daniel T. Lichter, Domenico Parisi, Shrinidhi Ambinakudige
Working on 1,396 sub-regional areal units, Daniel T. Lichter, Domenico Parisi, and Shrinidhi Ambinakudige show that in almost all European countries, immigrants from outside Europe are less spatially integrated with the native population than are immigrants from other countries within Europe. Differences in immigrant-native spatial integration are reflected in the large numbers of immigrant regional “hot spots” which are driven by public policy and idiosyncratic political considerations at the national and regional or sub-regional levels.
Introduction
Throughout much of Europe, new waves of immigration have raised concerns about cultural fragmentation and disunity, interethnic conflict, and growing antipathy toward immigrants. Our goal is to provide up-to-date comparative evidence of uneven patterns of population concentration, at multiple geographical levels, among immigrants and natives, both within and between European countries. Previous studies have mostly centered on neighborhood-to-neighborhood differences in immigrant residence patterns within a single city. Other studies have compared neighborhood segregation between several cities within a single country, or examined a small number of cities in countries sharing common cultural or economic characteristics (Musterd 2005; Massey 2016).
We focus instead on patterns of macro-segregation within countries, using the 1396 sub-regional or county units, as defined by the Nomenclature of Territorial Units for Statistics (NUTS 3; Eurostat 2018b).
Macro-segregation: within and between countries
In Europe, macro-segregation is revealed, first and foremost, in large country-to-country differences in the presence of immigrant (i.e. foreign-born) populations, and in their evolution over time (Figure 1).

However, variation across countries conceals substantial spatial variation within countries. Figure 2 displays the sub-regional areal unit (NUTS 3 level) map, by classes of relative foreign presence:
- less than the overall European average of 9.88 percent,
- more than 9.88 percent but less than twice the European average (9.88 to 19.66 percent), and
- more than twice the average (19.66 percent or more).

Large parts of Eastern Europe (Poland, Slovakia, Hungary, and Romania) are overwhelmingly native-born, as is the case in much of Finland and outlying rural areas in Sweden, Norway, and France. But even in low-immigration countries there are clear regional “hotspots” of immigrant population concentration. In Finland, immigrants are concentrated along the southern (e.g., in the Helsinki metro area) and western coasts (near Vaasa), and in Hungary, in the Budapest region (which does not show in the data, because percentages are below the overall European average in all cases).
In Italy, France, and the United Kingdom, the spatial distribution of immigrants is more highly concentrated (e.g., in the London area in the U.K.; Northern Italy; and Paris, Lyon, and Marseille in France). Immigrants are distributed in high percentages across much of the western part of Germany, with immigrant “hotspots” similarly distributed broadly across this region of the country. The former East Germany, on the other hand, is mostly comprised of native-born German populations and has experienced substantial net outmigration to Berlin and regions of former West Germany with stronger economic growth and more job opportunities, and where native populations are much less virulently anti-immigrant in sentiment.
Non-European immigrants
Immigrant population concentration is more uneven when we consider regional “hotspots” of non-European immigrants. Despite the nationalistic anti-immigrant fervor observed across parts of the EU, immigrants from outside Europe actually represent just 3.58 percent, on average, of the total population across sub-regions. Figure 3 reveals the uneven spatial distribution of non-European immigrants at levels below, above, and well above this figure. Non-European immigrants (from Asia and parts of Africa, especially Nigeria) are concentrated in parts of Northern Ireland and Switzerland (and surrounding areas in Germany, France, and Austria). Comparatively large shares of non-European immigrants (most often originating from the former Soviet Union) are also present in Estonia and in other densely populated parts of Europe (e.g., Brussels in Belgium, Barcelona and Madrid in Spain). In Germany, above-average percentages of immigrants from Turkey, Greece, and Russia and other groups (Asians) are found in North Rhine-Westphalia (e.g., Cologne), Baden-Württemberg, and Bavaria (e.g., Munich).

A segregation index
To examine macro-segregation, Table 1 provides immigrant-native segregation indices (D’s) that summarize the uneven within-country spatial distribution of immigrants across European countries. Here, segregation is defined by the uneven distribution of immigrants and natives across NUTS 3 units (i.e., sub-regions or counties). The overall mean D is 19.7 for all 27 European sub-regional areal units, which means that, on average, nearly one in five immigrants (or natives) would have to move to another sub-regional areal unit (another NUT 3 unit) within their country of residence to achieve residential parity with the native-born population.
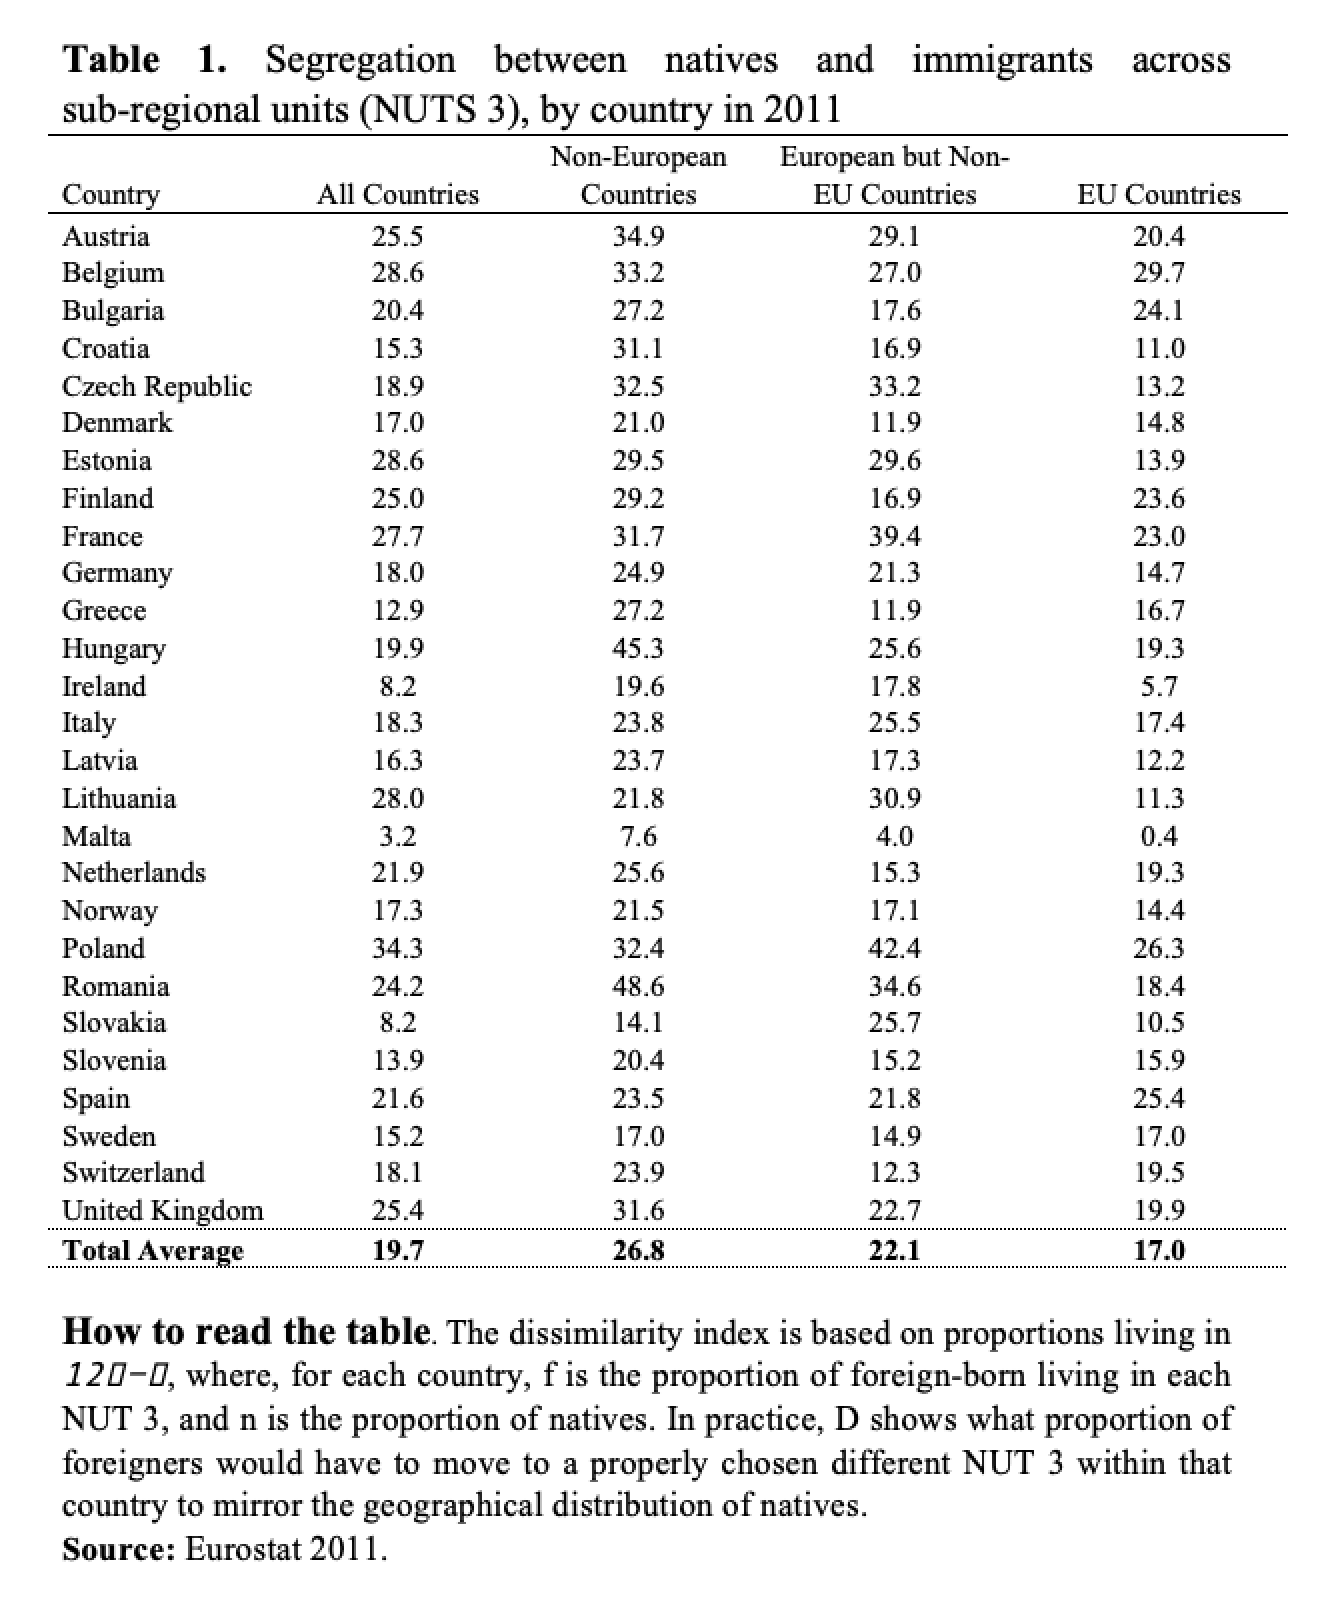
These estimates of immigrant-native macro-segregation vary substantially across European countries. At the low end, D’s in Malta (3.2), Slovakia (8.2) and Ireland (8.2) suggest that natives and immigrants are spatially integrated at the macro scale. High levels of county-to-county segregation (i.e., macro-segregation) are plainly evident in Poland (34.3), Belgium (28.6), Estonia (28.6), and Lithuania (28.0). These figures also imply that these countries are home to clearly identifiable regional immigrant “hotspots”.
Much of the new immigration in Europe involves the movement of Europeans who share common economic or cultural advantages (e.g., high education) that make segregation less pronounced. Indeed, a large but minority share of the 38.7 million foreign-born residents in the EU-28 or one of the four European Free Trade Association (EFTA) countries (i.e., Iceland, Liechtenstein, Norway, and Switzerland) originated from another EU/EFTA country (16.9 million). The clear implication is that immigrants from another European country are much more likely than non-European immigrants to avoid racialization (e.g., Icelanders in the UK), which can be a serious barrier to integration for immigrants from Africa, the Middle East, or Asia. These data also suggest that simple summary estimates of overall immigrant-native segregation may conceal substantial variation in segregation among non-Western immigrants across Europe.
Columns 2-4 in Table 1 provide immigrant-native segregation scores for immigrants from non-European countries, from European countries, and from European Union member states. In every country except Spain and Sweden, segregation rates are higher among immigrants from non-European countries (26.8) than among those from European Union member countries (17). Segregation from natives occupies an intermediate position among immigrants of non-EU European origin. For immigrants from outside Europe, D’s ranged from a low of 7.6 in Malta to highs of 48.6 in Romania and 45.3 in Hungary, largely reflecting the concentration of immigrants in (a few) large cities.
Discussion and conclusion
Our empirical goal was to provide cross-country multiscale indicators of integration or segregation that answer the question of whether immigrant minority populations share the same social and geographic space as the native-born or majority populations in Europe.
Our results on macro-segregation suggest at least three general conclusions. First, immigrant-native segregation patterns vary widely between and within European countries with very different economies, demographic conditions, and histories of immigration. Additional analyses of country-specific policy have underscored the difficulty in fully accounting for cross-sectional patterns of national and regional segregation among immigrants (Lichter, Parisi, and Ambinakudige 2020).
Second, in almost all European countries, immigrants from outside Europe or the EU are more segregated from natives than are immigrants from other countries in Europe.
Third, and finally, our analyses reinforce recent calls to consider residential integration at alternative levels of geography—from the micro to macro scale (Andersen et al. 2018; Lichter, Parisi, and Taquino 2016).
Our results speak directly to the growing body of research on the emergence and geographic spread of new immigrant destinations or gateways. Immigrants from around the world are dispersing across Europe, but they also are concentrating unevenly at national, regional, and sub-regional levels.
References
- Andersson, E. K., Malmberg, B., Costa, R., Sleutjes, B., Stonawski, M. J., & de Valk, H. A. (2018). A comparative study of segregation patterns in Belgium, Denmark, the Netherlands and Sweden: Neighbourhood concentration and representation of non-European migrants. European Journal of Population, 34(2), 251-275.
- Eurostat. (2011). Accessed on April 25, 2019.
- Eurostat. (2018a). Accessed on April 5, 2019.
- Eurostat. (2018b). Regions in the European Union: Nomenclature of territorial units for statistics – NUTS 2016/EU-28. 2018 Edition. Luxembourg: Publications Office of the European Union.
- Lichter, D. T., Parisi, D., & Taquino, M. C. (2015). Toward a new macro-segregation? Decomposing segregation within and between metropolitan cities and suburbs. American Sociological Review, 80(4), 843-873.
- Lichter, D.T., Parisi, D., & Ambinakudige, S. (2020). The spatial integration of immigrants in Europe: A cross‑national study. Population Research and Policy Review, 39(3), 465–491.
- MIPEX 15. (2017). Retrieved from mipex.eu on October 5, 2017.
- Massey, D. S. (2016). Segregation and the perpetuation of disadvantage. The Oxford Handbook of the social science of poverty, 16, 369-405
- Musterd, S. (2005). Social and ethnic segregation in Europe: Levels, causes, and effects. Journal of urban affairs, 27(3), 331-348.
- Teitelbaum, M. S. (2015). Political demography: Powerful trends under-attended by demographic science. Population studies, 69(sup1), S87-S95.
Saturday, May 30, 2020
Saturday, January 25, 2020
POPULATION CHANGE IN GEORGIA FROM 1990 TO 2018
Giorgi Kankia and Lika Zhvania write about population change in the country of Georgia from a spatial development perspective.
Shrinking population
The population of Georgia is shrinking. According to official statistics, it decreased by 1.2 mln (nearly 25% of the total population in 1990) in 1994 – 2018. Somewhat decreased fertility rates or armed conflicts in early 90s may be partially behind such a dramatic decline, but what stands out in the Georgian context is external migration triggered mainly by the political and socio-economic crises, and the painful transition to a market economy in the 90s, contributing to the country’s overall poor economic status.
Net migration (Fig. 1) has been especially negative from early 1990s until the early 2000s. It was somewhat stable and significantly lower in 2002 – 2011 and increased greatly from 2012, coinciding with the first democratic transition of power in the country and nearly reached positive levels during 2012 – 2017. However, out-migration started to increase again from 2018, possibly as a result of growing public disappointment with the recent political and socio-economic development trends in the country. It is worth noting that there are concerns with the reliability of the population data estimates, especially for the 1990s due to problematic registration of demographic events.

Figure 1: Net migration in Georgia 1994 – 2018. Source: Geostat, 2018
The transition to democracy and market economy were accompanied with uneven spatial development trends within the country itself as over 70% of Georgian economy and almost one-third of country’s 3.7 mln inhabitants are currently concentrated in just one city, Tbilisi – the capital of Georgia. Cities of Batumi, Kutaisi and Rustavi follow the capital and account for nearly 10% of the total number, making these four urban areas home for almost half of the country’s population. Overall, Georgia’s urbanisation rate currently sits at 57.2%, significantly lower compared to that of Armenia (63.2%) and slightly higher than that of Azerbaijan (56%).
The uneven spatial distribution of the population is clearly visible on the map below (Fig. 2) – the settlement structure and hierarchy in the western regions seem to be much more equally spread out and continuous, and it is much scattered and concentrated in a few spots in the East.
This could be explained by warmer climate and higher agricultural productivity of the land in contrast to more arid climate and lack of proper irrigation infrastructure in eastern regions of the country.

Figure 2: Population Density per 1 sq.km. Source: Geostat, 2014
Sex ratio bias
Another curious aspect of the Georgian population demographic characteristics is the sex ratio at birth (SRB) which has drawn scientists’ as well as the general public’s attention. Sex ratio at birth is measured as the number of new-born boys for every 100 new-born girls, usually naturally assessed around 102-108 boys every 100 girls. A 2015 UN report identifies a noticeable difference in average SRB for urban (109.7) and rural (113.4) births from 2005 to 2013, with the overall national SRB being at 111.1. This number is significantly lower (106.3) for 2015-2020. The disparity may be due to inaccurate data collection in 2005-2009 at municipal level, and so the assumed culprit – sex-selective abortions – may be “smaller than often portrayed”.
Even though the sex ratio at birth has been above the expected biological ratio for well over 30 years, according to 2014 data, the share of females and males of the total population in Georgia is 52.3% and 47.7% respectively. This impact on the overall gender distribution may be explained with higher female life expectancy, worse risk behaviour among men, and armed conflicts in the last decades that have claimed the lives of thousands of men in certain cohorts.
As the general population sex ratio on the maps below (Fig. 3.1) suggests, there is a disproportionately high share of males in the mountainous regions. It is especially so in the census areas of the North-Eastern regions. This may be due to the lack of economic activities and access to opportunities in rural economies, which may be driving women to more central locations. Looking at other mountainous districts such as those in Svaneti (North-West), Adjara (South-West) or Mtskheta-Mtianeti (North of Tbilisi) regions, the number of women is equal or higher in areas where there seems to be more opportunities for employment or socio-economic engagement, such as tourism and hospitality sectors.

Figure 3.1. General population sex ratio by census unit. Source: Geostat, 2014

Figure 3.2. General population sex ratio by municipality. Source: Geostat, 2014
This assumption is partially confirmed by the second map (Fig. 3.2 – Sex Ratio by municipality) showing higher share of women in urban areas, such as Tbilisi, Kutaisi, Batumi, Rustavi, Zugdidi and so on. However, several municipalities with poor access to opportunities also show high shares of female population.
Abandoned villages
As agricultural activities and production gradually declined over the transition years, cities, and especially the capital Tbilisi, have been attracting people living in rural areas, resulting in the complete abandonment of some of the villages. Currently, there are hundreds of abandoned villages throughout the country, clustered mainly in the mountainous areas of some of the regions and the areas bordering the conflict zone with Tskhinvali region in Shida Kartli in central part of the country.
The trend of uneven internal migration has been of growing concern within the country. As a result in 2016 the central government introduced a new law on the development of high mountainous regions, offering various types of social benefits and economic aid packages to people living in those areas. The effects of these new measures to improve the livelihood in the Georgian highlands are still to a great degree unknown.
Even with such a superficial analysis we have identified major trends and challenges – as negative net migration adds up to the uneven socio-economic and demographic development within the country, it is essential to understand these processes in spatial context. This is primarily important for efficient, socially just, redistributive and informed policies to tackle the adversities brought by the transition process and the period afterwards, as well as to look further and plan for long-term development scenarios.
Giorgi Kankia is currently pursuing a Master degree in Urban and Regional Planning at Stockholm University. He holds another Master degree in planning from the University of Granada and has a few years of working experience in the field in Georgian context. His research interests include mobility infrastructures, networks, segregation and planning practice. He has a background in GIS and spatial modelling and a strong interest in data analysis and visualization. You can read more on his blogs about spatial transformation and data visualisation.
Lika Zhvania (MSc) holds a Master degree in Human Geography from Tbilisi State University. She currently works on spatial planning issues. Lika has experience in GIS and spatial analysis. Her previous background includes network development in the telecommunication field throughout Georgia. She has an interest in urban analytics and is fascinated with data analysis and visualization.
Tuesday, November 5, 2019
extra polation

То же самое происходило с населением. В царской России население увеличивалось на 2-2,7 миллиона человек в год. Во время нэпа оно росло еще быстрее — 3,5 миллиона человек в год. То есть шесть миллионов рождается, 2,5 умирает, остается 3,5. Посчитайте на пальцах: 70 лет советской власти, по три миллиона прироста в год, получается около 200 миллионов. Где? Вывод очень простой: моя страна единственная в мире имела такой разрушительный XX век. Разрушительный во всех смыслах: инфраструктура, население, мозги. То, что мы сейчас получаем, как раз заслуга того самого «эффективного менеджера».
Я как географ [Орешкин] воспринимаю действительность: едешь ночью в поезде из Петербурга в Москву — пустыня. Где-то вдалеке огонек горит. А я знаю, что до революции только в Тверской области было 12 тысяч населенных пунктов, а сейчас — две тысячи. Когда ты едешь из Бостона в Нью-Йорк в США и выезжаешь из зоны сплошного заселения, в течение ста километров ты едешь по городу, который так и называется — Боваш, «Бостон — Вашингтон». А у нас между двумя крупнейшими городами дыра, и у меня это в голове не укладывается именно как у физикогеографа, который мыслит физическими величинами.
Что произошло с очами? Их выкололи. Мы видим то, что нарисовано на облаках фимиама и не видим реальности — раздолбанных дорог, что вся страна стянулась в Москву, а провинция деградирует. Что случилось с мозгами? Их вышибли. Да еще и яйца оторвали, потому что население не растет. И теперь этот обрубок несчастный поднимают с колен. И люди радуются, аплодируют, потому что им мучительно трудно признаться в том, что на самом деле их обманули.
Когда слышишь эти восторги — «Сталин придет — порядок наведет» — это типичный религиозный подход. Люди сидят и ждут второго пришествия. Хотя на самом деле никакого порядка не было, не строились эти самые железные дороги, а заводы, которые дымили на фотографиях, наверное, производили что-то не то, потому что страна жила впроголодь. Да и оружия в нужное время в нужном месте не хватало, поэтому мы потеряли 25 миллионов.
Кстати говоря, в 1947 году Иосиф Виссарионович писал, что военные потери составили семь миллионов. Это как же могла деградировать национальная статистика, если потом Хрущев говорил о двадцати миллионах, а Брежнев — о 28! Мы начинаем манипулировать десятками миллионов. Это значит, что деградировал народ, что мы живем в каком-то вымышленном пространстве. Людям легче поверить, чем что-то проверить, попросить разъяснений и так далее.
UPG
В своей книге «Джугафилия и советский статистический эпос» политический географ Дмитрий Орешкин показывает, как советская власть с помощью цифр статистики манипулировала сознанием масс.
Thursday, September 26, 2019
bridging the continents

Abstract Submission is open for IGC 2020, Istanbul,Turkey.
Our commission organizes 5 sessions : https://www.igc2020.org/en/POPULATION-GEOGRAPHY.html
Please consider submitting an abstract and share this call as widely as possible !
Also check the numerous sessions organized by other commissions : https://www.igc2020.org/en/COMMISSIONS.html
Warmest regards and see you in Istanbul !
Etienne
Prof. Etienne Piguet
Chair of the Commission on Population Geography – International Geographical Union (IGU)
University of Neuchâtel - Switzerland
Sunday, September 1, 2019
Biopolitical conservatism in Europe and beyond:
the cases of identity-making projects in Poland and Russia
Tuesday, June 11, 2019
Mendeleyev table in our tundra
Some while ago, precious rare earths important in the production of microchips, electronics and electric motors were almost exclusively sourced in China. In recent years, several nations have picked up production again while new players entered the market, diversifying it at least to some degree.
Yet, China was still responsible for more than two thirds of global production, according to the U.S. Geological Survey. But as many countries are wary of depending on China, especially when it comes to technology products, countries with rare earth deposits are likely to exploit them further. The U.S., however, is still shipping its rare earths to China for processing, but a first processing plant on American soil is in the planning stages. This is in cooperation in an Australian rare earth company currently processing its product in Malaysia.
China also has the largest know deposits of rare earths, but Brazil, Vietnam and Russia also have a lot of (largely) untapped potential in the sector. The United States, together with Australia, emerged as a major producer of rare earths after 2010. The country, which has produced rare earths before for military uses, got back into the market as rare earths were getting more important as a part of the implementation of crucial technologies.
 You will find more infographics at Statista
Yet, China was still responsible for more than two thirds of global production, according to the U.S. Geological Survey. But as many countries are wary of depending on China, especially when it comes to technology products, countries with rare earth deposits are likely to exploit them further. The U.S., however, is still shipping its rare earths to China for processing, but a first processing plant on American soil is in the planning stages. This is in cooperation in an Australian rare earth company currently processing its product in Malaysia.
China also has the largest know deposits of rare earths, but Brazil, Vietnam and Russia also have a lot of (largely) untapped potential in the sector. The United States, together with Australia, emerged as a major producer of rare earths after 2010. The country, which has produced rare earths before for military uses, got back into the market as rare earths were getting more important as a part of the implementation of crucial technologies.
You will find more infographics at Statista
Subscribe to:
Posts (Atom)