Showing posts with label домохозяйство. Show all posts

Thursday, November 14, 2024

in the US

тыц а бельно

Как менялся состав домохозяйств в США


За период с 1960 по 2023 гг. американские домохозяйства заметно поменялись. Единственная стабильная категория - это женатые пары без детей: их как было около 30% в 1960, так и сейчас по-прежнему около 30% (и сейчас это самый распространённый тип семьи в США).

В два с половиной раза больше стало одиночек без детей: их доля выросла с 13% до 29%, а вот доля женатых пар с детьми упала с 44% в 1960 до нынешних скромных 18%!

В два раза больше стало одиноких родителей с детьми и "других" типов домохозяйств (неженатые пары, просто друзья-соседи, взрослые родственники и т.д.)

Friday, April 12, 2024

Global household trends:

converging sizes, divergent structures

April 8, 2024 Maria Pohl and Albert Esteve

Household structures reflect and affect social, economic, and demographic dynamics. Albert Esteve and Maria Pohl use the new CORESIDENCE database to explore the transformation of households over the last five decades. Their findings suggest a global decline in average household size, although household structures continue to differ across countries.


Households are core units of social organization and reproduction. Their fundamental characteristics, namely size and composition, reflect complex socio-economic and demographic changes (Bongaarts, 2001; Therborn, 2004, 2014). For instance, increases in one-person and two-person households at the expense of larger households might be driven by demographic changes, such as fertility decline or increased longevity. Household characteristics can have far-reaching implications for housing markets, intra and inter-household transfers, or gender relations. Studying household size or composition comparatively and over time allows us to understand how societies change, not only from a demographic standpoint but also from social and economic perspectives.

Comparative research on households on a global scale has remained relatively scarce due to data constraints. The newly developed open-access, open-source CORESIDENCE database aids researchers in filling this gap by providing harmonized household data on the national and subnational scales for 156 countries and 1,511 regions (Galeano et al., 2024), making it possible to study families and households on an international scale. Family researchers, like those studying fertility and mortality, can address questions about family change based on the increasing availability of empirical data, thanks to census microdata available from the Integrated Public Use of Microdata Series (IPUMS) and survey data from Demographic Health Surveys (DHS), Multiple Indicator Cluster Surveys (MICS), or the European Labor Force Surveys (EU-LFS).
 

Converging sizes: moving towards smaller households


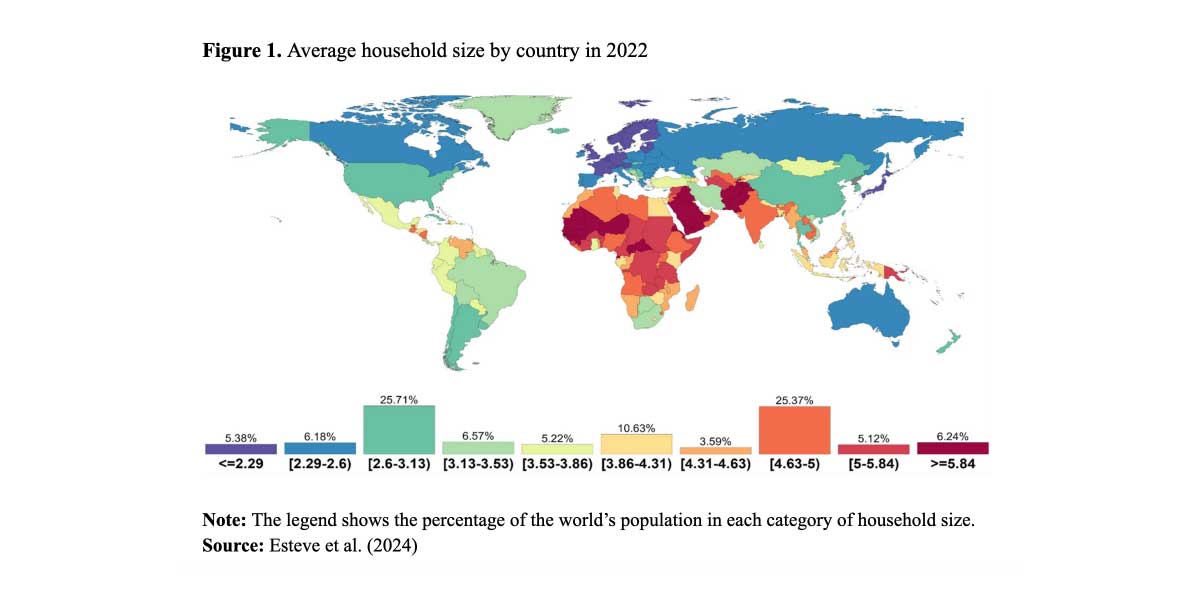
Despite some definitional differences, households are considered to be suitable units for comparative research (Bongaarts, 2001). Household size refers to the number of people who are living together in a dwelling at the time of data collection. It differs substantially across countries as it reflects their diverse fertility levels (Figure 1). However, it is also determined by social norms and customs governing family-formation processes, such as norms for establishing a new, separate household upon marriage.
Households are, on average, smallest in some East Asian countries and in Europe. Denmark leads this group, with an average household size of 1.8 people. The largest households, on average, can be found in Sub-Saharan Africa and among countries of the Arabian Peninsula and Central Asia, reaching a maximum of 8.4 people per household in Senegal, for example. The vast majority of the world’s population (around 83 percent) lives in countries with an average household size of between 2.3 and 5 persons.

Household size has declined quite steadily over the past five decades, by approximately 0.5 people per decade. When average household size in a country falls to around two, the rate of decline slows down: countries with comparatively large households and high fertility levels will likely drive any further decline in average household size. Shrinking households in contexts with relatively small households might suggest an increase in one-person households, driven by young adults who postpone their transition to adulthood or by older adults, such as women who live alone after the death of a partner. However, households do not shrink in all contexts: socio-economic conditions may foster intergenerational coresidence or alternative household configurations that could, at least partially, counteract the reduction in household size due to fertility decline. Moreover, some countries (e.g. Senegal) have maintained large households despite demographic changes.
 

Divergent structures: the roles of children and other relatives


The internal structure of a household is called household composition. This structure is based on a reference person in the household, commonly referred to as the household head or reference person in survey and census data. Household composition varies in response to demographic changes, such as a decline in fertility or changes in family and relationship forms, such as living-apart-together or intergenerational coresidence (Furstenberg, 2019). Household composition further reflects the age structure of a population: the number of children and adults available in a society for distribution across households differs according to the underlying age composition of the population.

Fertility decline is a core driver of shrinking household size. However, across many contexts, the presence of other relatives of the household head is another crucial component of household composition. If the number of children in the household declines but the presence of other relatives remains stable, their relative weight in the household may increase, with possible implications for care transfers, decision-making processes, and family dynamics.

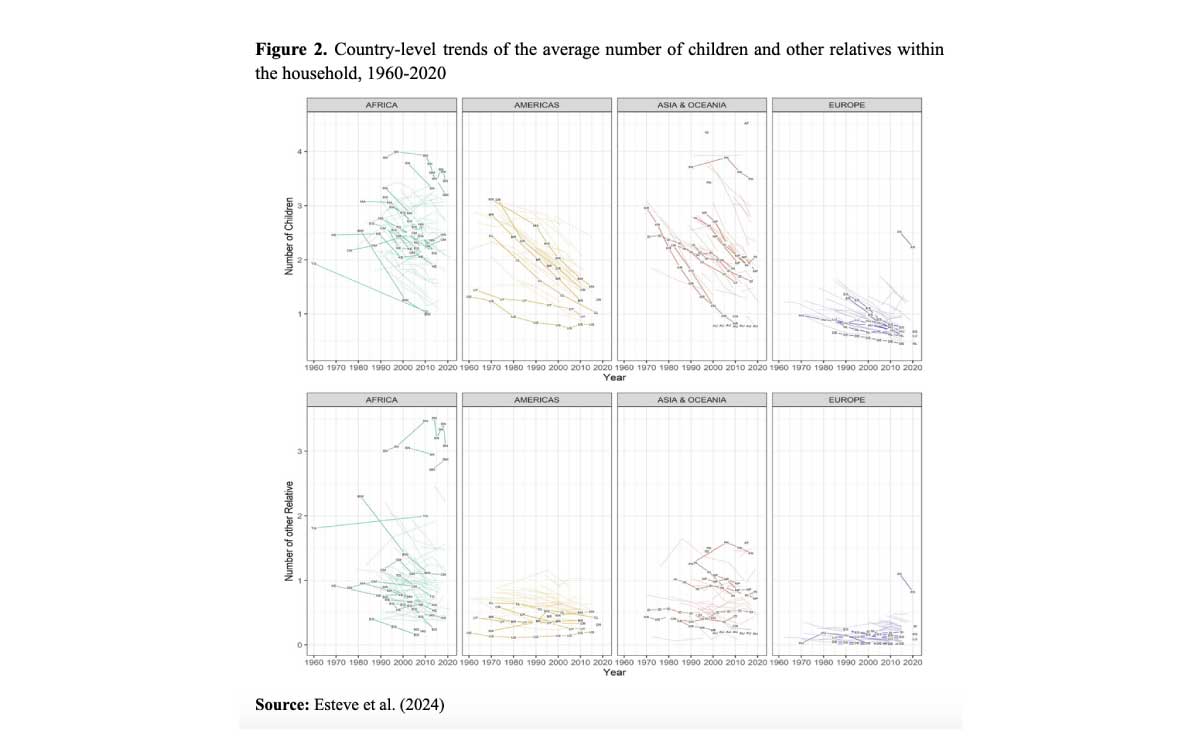
Figure 2 highlights the decline in children in the household (upper panel) across all major world regions. While children are the central driver of global heterogeneity in household size and composition, another important group contributing to global variation in household size and composition is that of other relatives (lower panel). In many countries, the presence of other relatives in absolute numbers has remained relatively unchanged.

Conclusions


Family patterns, socio-economic and demographic transformations, and cultural systems influence the persistent heterogeneity in household composition (Cherlin, 2012). Our results support the “convergence to divergence” hypothesis, which postulates that future family changes driven by social phenomena are certain but will produce different outcomes in different contexts (Pesando & GFC Team, 2019; Therborn, 2004, 2014). Fertility declines increase the prevalence of smaller households, yet we find persistent internal complexity of households in several countries. Interactions of global trends such as declining fertility and increasing life expectancy will result in different typologies of households, depending on the context in which such changes occur. We further anticipate that a continued decline in fertility rates will lead to smaller households and changes in household composition due to fewer living relatives available for coresidence.

The timing and occurrence of life-course events, societal structures, and individual factors drive variation in household structures. Shifts in transfer patterns, housing demand, gender relations, the division of labour, and living arrangements are some of the possible implications of changes in household structures. The CORESIDENCE project investigates these issues by examining links between households, living arrangements, and related socio-demographic indicators. The project entails macro- and micro-level analyses across various contexts, data sources, and spatial levels. We also invite and encourage other researchers to use the CORESIDENCE database.

Funding: CORESIDENCE is supported by an Advanced Grant funded by the European Research Council (ERC). Grant agreement ID: 101052787.


References

  • Bongaarts, J. (2001). Household size and composition in the developing world in the 1990s. Population Studies, 55(3), 263–279. https://doi.org/10.1080/00324720127697
  • Cherlin, A. J. (2012). Goode’s World Revolution and Family Patterns : A Reconsideration at Fifty Years. Population and Development Review, 38(4), 577–607. https://doi.org/10.1111/j.1728-4457.2012.00528.x
  • Esteve, A., Galeano, J., Turu, A., García-Román, J., Becca, F., Fang, H., Pohl, M., & Trias-Prats, R. (2023). The CORESIDENCE Database: National and Subnational Data on Household and Living Arrangements Around the World, 1964-2021. Zenodo. https://doi.org/10.5281/ZENODO.8142652
  • Esteve, A., Pohl, M., Becca, F., Fang, H., Galeano, J., García-Román, J., Reher, D., Trias-Prats, R., & Turu, A. (2024). A global perspective on household size and composition, 1970–2020. Genus, 80(1), 2. https://doi.org/10.1186/s41118-024-00211-6
  • Furstenberg, F. F. (2019). Family Change in Global Perspective: How and Why Family Systems Change. Family Relations, 68(3), 326–341. https://doi.org/10.1111/fare.12361
  • Galeano, J., Esteve, A., Turu, A., García-Roman, J., Becca, F., Fang, H., Pohl, M., & Trias-Prats, R. (2024). CORESIDENCE: National and subnational data on household size and composition around the world, 1964–2021. Scientific Data, 11(1), 145. https://doi.org/10.1038/s41597-024-02964-3
  • Pesando, L. M., & GFC team. (2019). Global Family Change: Persistent Diversity with Development. Population and Development Review, 45(1), 133–168. https://doi.org/10.1111/padr.12209
  • Therborn, G. (2004). Between sex and power: family in the world, 1900 – 2000 (Reprinted). Routledge.
  • Therborn, G. (2014). Family Systems of the World: Are They Converging? In. J. Treas, J. Scott, & M. Richards (Eds.), The Wiley Blackwell Companion to the Sociology of Families (1st ed., pp. 1–19). Wiley. https://doi.org/10.1002/9781118374085.ch1

Saturday, November 4, 2023

structural dynamics

Динамика структуры ВВП за 2022-2023 годы


В свежем СЭПР Росстат приводит оценки компонент ВВП в текущих ценах за второй квартал 2023, так что теперь у нас есть уже полтора года динамики с начала СВО.

Прежде всего, надо обратить внимание на драматическое падение чистого экспорта с 18.4% ВВП в 1 квартале 2022 до нынешних 4% ВВП. Правда, и цифры начала 2022 были аномальными, в сумме за 2021 чистый экспорт был ровно в два раза ниже: 9.2% ВВП.

Потребление домашних хозяйств продолжает расти и уже превысило 52% от ВВП. В конце 2022 оно падало до 46.8%, до этого было достаточно стабильно и близко к докризисным уровням 2021 года.

Сильно выросла доля госпотребления (и опять же, понятно почему). Интересно другое: весь 2022 оно держалось на докризисном уровне, и лишь в 2023 начало расти: сразу с 17.4% в конце 2022 до 24.1% в 1 квартале 2023, сейчас опустилось до 20%

Валовое накопление основного капитала достигло пиковых 29% в 4к2022, но сейчас вернулось в окрестность докризисных уровней

Monday, August 21, 2023

census ru register aging

Всероссийская перепись населения, проводившаяся в 2021 году, показала, что доля домохозяйств, состоящих из одного человека, составила 41,8%, при этом в 2002 году доля одиночек была почти вдвое меньше и составляла 22,3%.


Полные семьи с детьми занимают лишь пятую часть из всех домохозяйств (20,7%).

Из всех семей с детьми 37,7% составляют матери-одиночки (их доля увеличилась с 2002 года на 6%). Также вырос процент семей из отцов-одиночек с детьми — с 4,1% в 2002 году до 8,2% в 2021 году.

Monday, April 17, 2023

Women Entrepreneurs

Женщины-предпринимательницы: 
Смена мужем фамилии на фамилию жены как инструмент сохранения семейного бизнеса и фирменного бренда в купеческих семьях Москвы в XIХ веке

Galina Ulianova, 2022, Адам и Ева. Альманах гендерной истории. Вып. 30. 2022. С. 174-212. https://doi.org/10.32608/2307-8383-2022-30-174-212

В статье рассмотрен интересный феномен смены мужем фамилии на фамилию жены, выявленный при изучении истории предпринимательства на примере московских купеческих фирм в XIХ веке и служивший инструментом сохранения семейного бизнеса и фирменного бренда. Вопрос о перемене фамилии решался собранием выборных Московского купеческого обществ. Для рассмотрения дела требовалось заявление просителя и поручительства не менее трех лиц из купечества, свидетельствующие, что «со стороны лица, желающего изменить свою фамилию, нет злого умысла и вреда для других». В статье проанализированы четыре заявления о смены мужем фамилии на фамилию жены (поданы в 1870-х гг.) – три из которых были удовлетворены, а одно нет. На примере случаев со сменой фамилии показано, как ради удержания достигнутого социального статуса и капиталов купеческой семьи, новый член этой семьи готов был отбросить свою изначальную самоидентичность. 

The article focuses on the interesting phenomenon of husband’s family-name change to their wive’s family-name, revealed while studying the history of entrepreneurship of the Moscow merchant family firms in the XIX century, and can be recognized as a tool of family business and brand preservation. The power of deciding as to whether or not a name change should be authorized belonged to the committee of deputies of the Moscow Merchant Society. For a case to be considered, it was necessary for a solicitor to file a petition and for three merchants to confirm in writing that ‘there is no evil intention and harm to others on the part of the person who wishes to change his last name’. In the article four petitions of the 1870s are analysed, three were satisfied, and one denied. The cases of name-changing indicate that, for the sake of preserving his achieved social status and a merchant family’s capital, the new member of that family was sometimes ready to relinquish his initial self-identity.

Wednesday, March 8, 2023

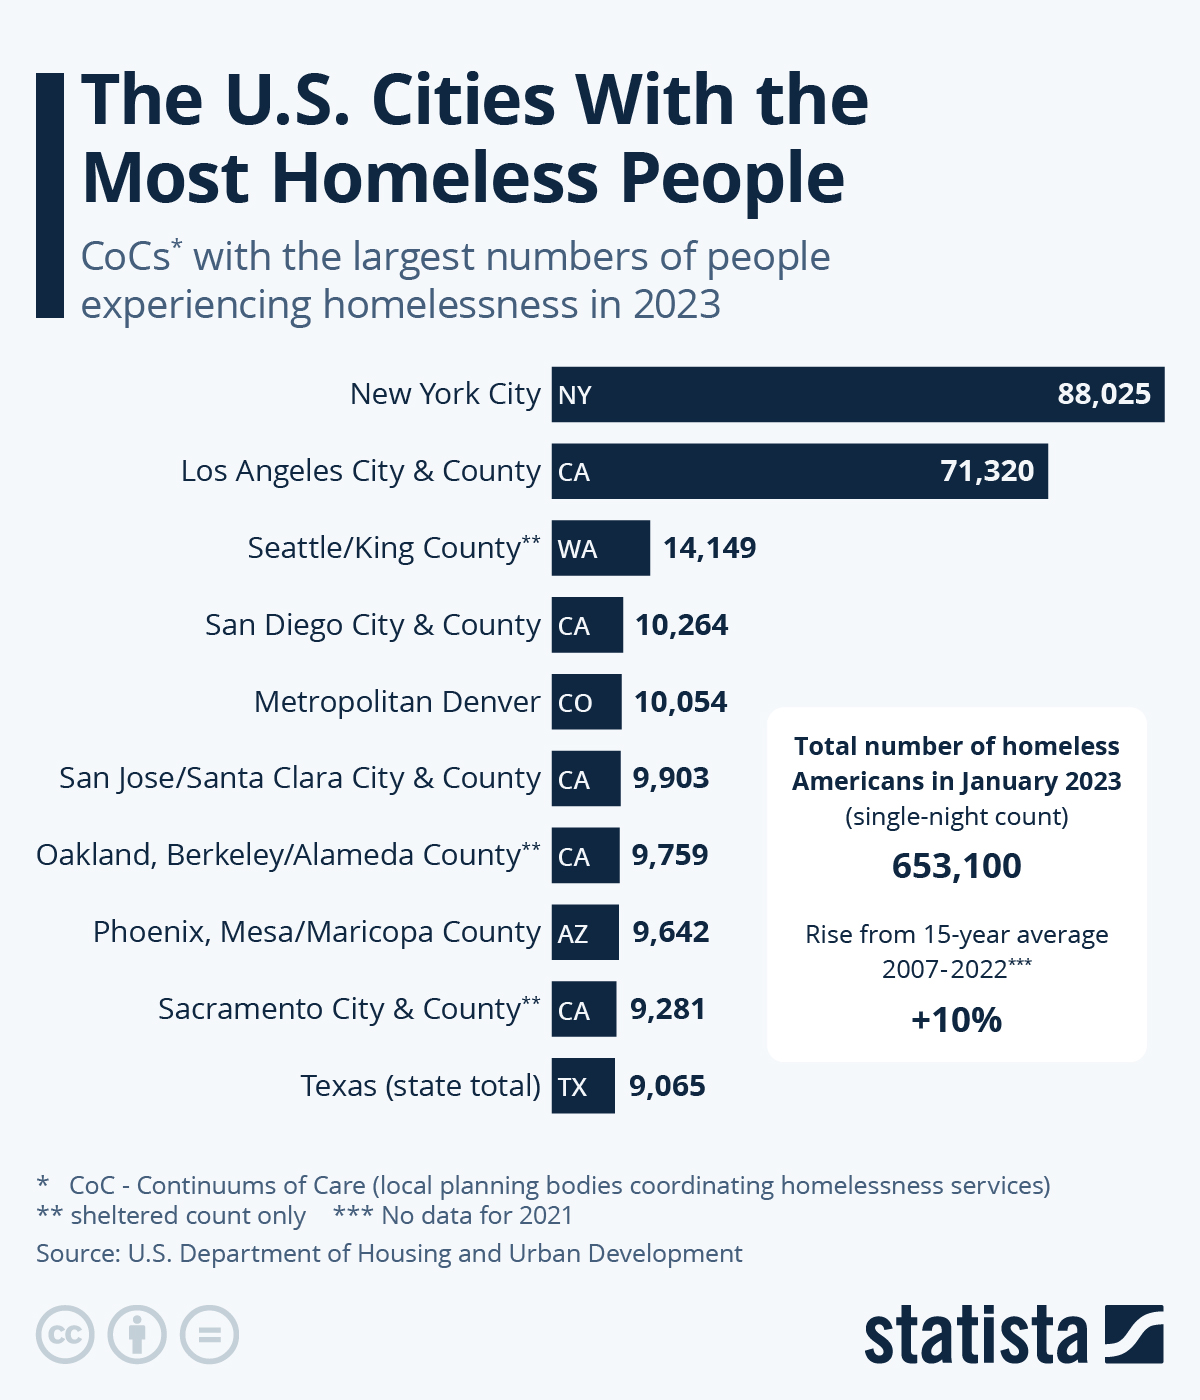
The U.S. Cities With the Most Homeless People

Over half a million Americans are currently homeless. After a period of progress and decline, the U.S. homeless population has increased slightly in 2020 and 2022, according to a report from the Department of Housing and Urban Development. The 2021 numbers were affected by shelters lowering capacity due to the Covid-19 pandemic during the count that takes places in the first month(s) of every year. It now stands at 582,462 individuals with two thirds living in shelters. While the number of sheltered individuals in 2022 approached the 2020 pre-pandemic level again, the increase in the nation's homeless is primarily due to a rise in the unsheltered homeless population.

Around half of all unsheltered homeless people in the U.S. are located in California. The rates of unsheltered homeless populations are also high in other states on the West Coast. Tent cities are common occurrences in these states as a result of the growing unsheltered homeless populations. This very visible symptom of homelessness has proven divisive, and while some cities have embraced designated areas for camping as a solution for unsheltered people, others have recently cracked down on encampments, for example Sacramento, San Jose and Oakland.

Half of the U.S. homeless population is scattered across the country's 50 biggest cities and their surrounding areas. 22 percent of them live in just two cities - New York and Los Angeles. Despite its considerable homeless population, New York has a very low rate of unsheltered individuals: only 5.4 percent lived on the streets in early 2022, which is in part due to the two cities opposing climates. In California 67.3 percent of homeless people were listed as unsheltered at the same time.

The CoCs for New York and Los Angeles - so-called Continuums of Care or local planning bodies coordinating the response to homelessness - saw around 62,000 and 65,000 homeless people in the early 2022 count. Other CoCs in the U.S. experiencing a high level of homelessness are Seattle/King County with around 13,3000 homeless people registered as part of the count, and San Jose and Santa Clara in California with more than 10,000. Out of the 10 CoCs with the biggest homeless populations registered in 2022, six were located in California.The U.S. Cities With the Most Homeless People

Tuesday, January 24, 2023

Children and unequal sharing of housework

Children and (unequal) sharing of housework between partners in Hungary


January 23, 2023 Zsuzsanna Veroszta

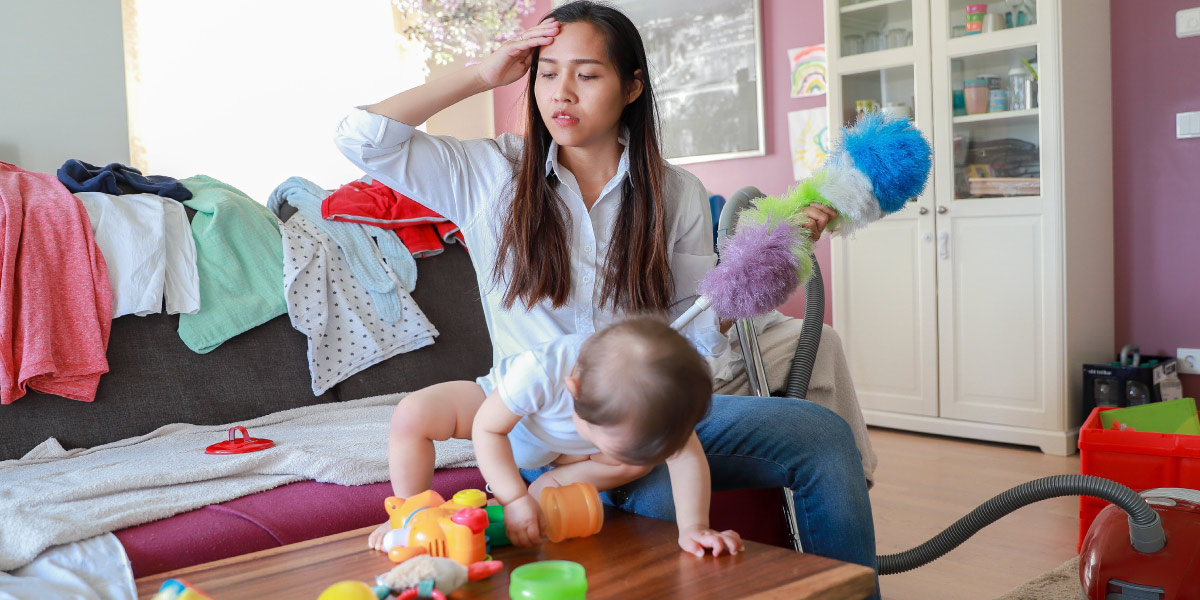
In addition to their childcare responsibilities, women with young children often have to do more housework, thus making an already unequal balance even more skewed. Zsuzsanna Veroszta shows that, in absolute terms, the burden is greater on mothers of several children, and that the biggest relative increase occurs after the birth of the first child.

The division of housework between partners depends on the life cycle of households, including childbearing, which is perhaps the single most relevant factor (Birch et al., 2009). After giving birth, women tend to be more burdened with housework, as well as having increased childcare responsibilities. This depends partly on practical circumstances, such as maternity leave, and partly on cultural and value-related attitudes. In Hungary, studies on the division of housework within households have shown that even though their labour market participation is very high, women traditionally bear the brunt of household responsibilities (Gregor and Kováts, 2020). The prevalence of this phenomenon – also known as the ‘second shift’ (Hochschild and Machung, 1989) – depends not only on the external workload, but also on place of residence, education and age, including the age difference between partners. The number and age of the children also matters.

In a recent study, my colleagues and I analysed the amount and share of housework performed by women during pregnancy and when the child is 6 months old (Veroszta et al., 2022). The self-reported data, concerning women who cohabit with a male partner, were obtained via face-to-face interviews in the first wave (among pregnant women) and second wave (when the child was aged 6 months) of the Growing Up in Hungary – Cohort ’18 longitudinal study (2018–19).
 

Women’s share of domestic work increases once they have a child


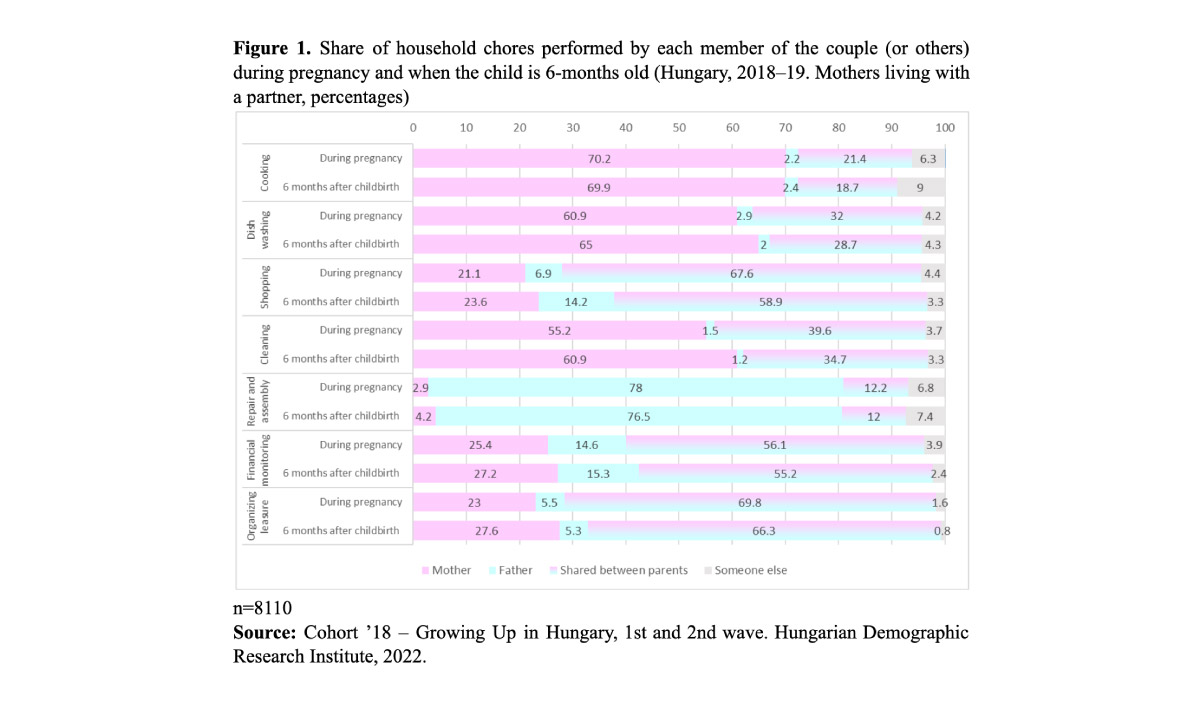
According to data from the Cohort ’18 survey, already during pregnancy, the burden of everyday domestic tasks – cooking, washing, shopping, cleaning, etc – is heavily skewed towards women. Men are most likely to do maintenance work in or around the house. The most common joint or shared activities include shopping, managing household finances and organizing leisure activities. About six months after the birth of their child, mothers seem to be doing slightly more washing and cleaning, while the number of tasks the couple do together decreases in almost all areas (Figure 1).

The more (children), the heavier (the burden of household chores)


These data reflect the average Hungarian couple with a 6-month-old child. However, when this baby is not the first child in the household, the division of housework is even more heavily tilted against mothers. Not only do fathers with more children take on fewer tasks, but there is also a big reduction in shared household activities (Figure 2). It is also clear from the data that external help (whether paid or unpaid) tends to be available more to mothers of only children; with a second or third child, the mother’s household tasks tend to increase.

A larger relative increase for first-time mothers


Depending on the number of children, the picture differs if we look not at the absolute number of tasks, but at the increase in tasks after the birth – i.e. the relative extent of the change. In this case, we look at the difference between the number of tasks that the mother performed before and after the birth.

On average, a pregnant woman mainly or always performs 2.4 household tasks out of 7. For those with a 6-month-old child, the average is higher: 2.75 tasks. Comparing the two periods, in more than 40 per cent of cases, the number of household tasks performed by the woman increases in the 6 months following the birth, typically by one or two extra household jobs.

Breaking the data down by parity, we find, not surprisingly, that mothers with more children do most of the housework in absolute terms. However, the relative increase in the number of tasks is smaller for them – with the exception of families with four children or more, where both the absolute and the relative burden on mothers increases significantly with the arrival of a new child. Housework increases more for women who are at home after the birth of their first child.
In short, in Hungary at least, having additional children increases women’s household workload in general, but it is after the first birth that the balance of housework between partners tilts most strongly against women.

References

  • Birch, E.R., Lee, A.T. and Miller, P.W. (2009): Household Divisions of Labour: Teamwork, gender and time. Palgrave Macmillan.
  • Gregor, A. and Kováts, E. (2020): Work–life: balance? Tensions between care and paid work in the lives of Hungarian women. Socio.hu Társadalomtudományi Szemle, 9(SI7), 91–115.
  • Hochschild, A.R. and Machung, A. (1989): The Second Shift: Working parents and the revolution at home. Viking.
  • Veroszta, Zs., Boros, J., Kapitány, B. et al. (2022): Infancy in Hungary. Report on the Second Wave of Cohort ’18 – Growing Up in Hungary. Working Papers on Population, Family and Welfare, No. 40. Hungarian Demographic Research Institute, Budapest.

Monday, December 5, 2022

Does culture influence the gender division of housework and childcare?

December 5, 2022 Elisa Brini, Anna Zamberlan and Paolo Barbieri

Gender inequality in the division of housework persists. Elisa Brini, Anna Zamberlan and Paolo Barbieri investigate if cultural heritage is resistant to changes in the socioeconomic and institutional environment by studying migrant families. Cultural roots are a factor of gender inequality in housework and childcare, but they fade over time in destination countries.


Women in the kitchen, men in the yard


Women today are more highly educated than men and increasingly present in the labour market; yet they continue to perform most of the household labour (Zamberlan, Gioachin, and Gritti 2021, 2022). Analysing Italian data from the Social Condition and Integration of Foreigners (SCIF) survey (ISTAT 2011–2012), this holds true for immigrant couples as well. Figure 1 shows the extent to which couples with an immigrant background and residing in Italy divide different domestic and childcare duties. The overwhelming majority of tasks such as preparing meals, laying the table, doing the dishes, keeping the house clean, or caring for children, are performed by women. Men do more than women only when it comes to typically male activities, such as doing repairs and dealing with administrative matters.

Looking for an explanation


Why is there still a gender gap in domestic work? While the time available to partners and individual resources such as education and income are key determinants of the unequal division of unpaid work, the relevance of cultural aspects is still a matter of debate. Traditional gender roles, inherited from the family or from the wider context of origin, could have a bearing on the behaviour of men and women by crystallizing gender inequality even within the home. The study of immigrant families in Italy offers an opportunity to tease out the role of cultural aspects. Upon moving to the same host country, immigrants share a common institutional and cultural environment while having different cultural heritages from their origin countries and different perceptions of gender equity. If the culture of origin matters, domestic and childcare tasks should be more (less) equally shared among couples coming from more (less) gender-egalitarian countries.

Culture matters


The World Bank’s Global Gender Gap Index (GGI) provides a useful indicator for measuring and comparing gender equality across countries. A value of 1 indicates a country with the highest possible score of gender equality, while a value of 0 indicates a country with the lowest possible score. Figure 2 shows the correlation between the GGI score of the female partner’s origin country and the share of male participation in household chores and childcare in the host country. Men assume a larger share of housework and, even more so, of childcare in couples where the woman comes from a more egalitarian country. Arriving from a context with a more egalitarian gender culture goes along with a more equitable division of household duties in the destination country.

A fading heritage?


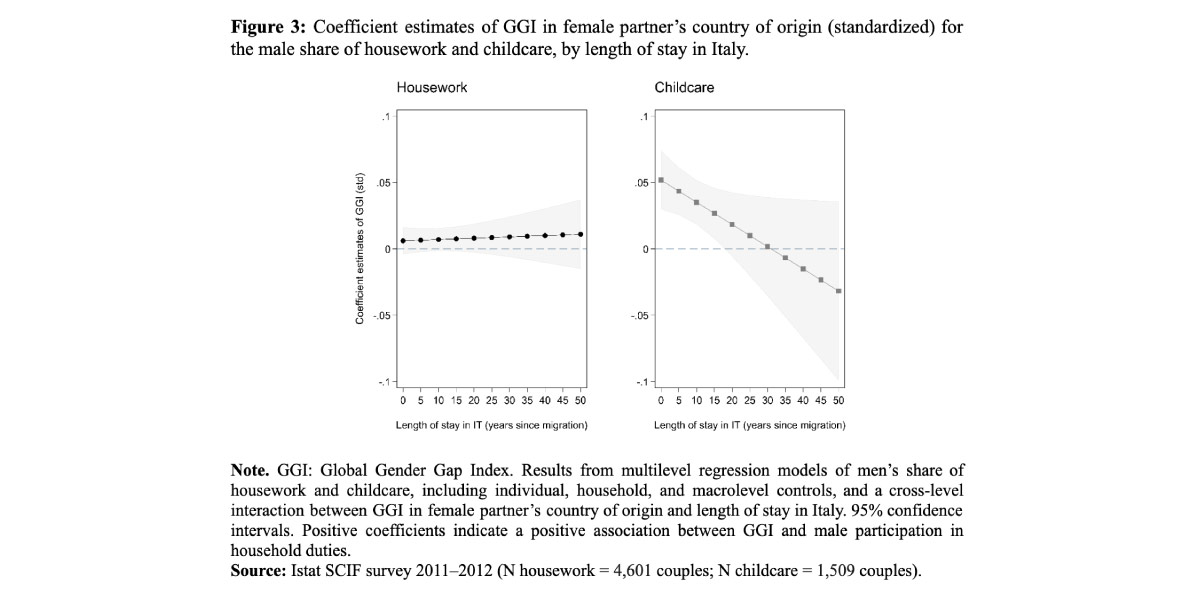
The families under investigation have different migration histories. As more time is spent in Italy, the gender culture inherited from the context of origin could lose relevance as a result of prolonged contact with a different institutional and cultural context. Figure 3 confirms this expectation, but only with regard to childcare activities. Indeed, the relationship between GGI and male participation in housework is positive but close to 0 and independent of the number of years spent in Italy. Conversely, the association between GGI and fathers’ involvement in childcare is positive at the beginning, but it gradually diminishes as time spent in the destination country (Italy) increases.

Conclusions


Studying how immigrant families divide housework and childcare tasks is informative for understanding the cultural component of gender inequality. While it is true that the culture of origin influences the behaviour of partners even in a different socioeconomic context, there are substantial differences based on the type of activity and the time spent in the host country. Cultural heritage is mainly relevant for explaining gender differences in childcare activities, while the role of culture is marginal with regard to other domestic tasks. In addition, the influence of culture weakens considerably, and eventually disappears as time spent in the destination country increases. The disappearance of cultural effects may suggest the presence of a cultural assimilation mechanism, although in the absence of longitudinal data, this can only be inferred.

References

  • Brini, E., Zamberlan, A. and Barbieri, P. (2022). Culture portability from origin to destination country: The gender division of domestic work among migrants in Italy. Demographic Research, (47)20, 577–614
  • Zamberlan, A., Gioachin, F., and Gritti, D. (2021). Work less, help out more? The persistence of gender inequality in housework and childcare during UK COVID- 19. Research in Social Stratification and Mobility 73: 100583. 
  • Zamberlan, A., Gioachin, F., and Gritti, D. (2022). Gender inequality in domestic chores over ten months of the UK COVID-19 pandemic: Heterogeneous adjustments to partners’ changes in working hours. Demographic Research 46(19): 565–580.

Friday, November 18, 2022

Young people in Europe: Findings from the ESS


Substantive research that focuses specifically on the attitudes of young people will be presented at our online event from 1-3pm (GMT) on Wednesday 7 December.


Five papers will be presented during the event, with the first three showcasing analysis of our climate change and energy data.

Initial presentations will focus on climate change and wellbeing, environmental concerns and voting behaviours and attitudes towards reducing energy use.

Research to understand how the pandemic has helped shaped young people’s perspectives on the future, and attitudes towards digital technology, will also be presented.

Alina Cosma (Trinity College Dublin) and Gina Martin (Athabasca University) will examine whether young people’s mental health is negatively affected by concern about climate change and feeling a personal responsibility to prevent it.

Elisabetta Mannoni (Central European University) will tackle the question of whether young individuals are more likely to vote in line with their environmental concerns than older voters do.

Julian Reul (Institute of Energy and Climate Research at Forschungszentrum Jülich GmbH) will present research that assessed factors that influence the willingness to reduce the energy use of private households among three different age groups.

Laurène Thil (HIVA - Research Institute for Work and Society, KU Leuven) will reveal the results of a new survey conducted in 2022 to examine the impact of COVID-19 on young people’s opinions.

Maria Symeonaki (Panteion University of Social and Political Sciences) will present analysis of our newest available dataset measuring attitudes towards digital social contacts in work and family life.

To register for this Zoom Webinar, you must use an email address linked to a Zoom account.

Register to attend


Monday, September 26, 2022

The old and the new natalism are not at odds

September 26, 2022 Laurie F. DeRose

Religion has historically been a pronatalist force, but because it fosters traditional gender role attitudes, it could impede a fertility recovery stimulated by gender equity. Instead, Laurie DeRose explains how religion and gender equity do not undermine each other’s pronatalism.


Public policy in the Global North tends to be pronatalist.
Policies that make it easier for working adults to have children are favored to ensure support for older retirees by the coming generations, to stabilize the workforce more generally, or simply to address equity concerns: men have always been able to combine work and childrearing, but enabling women to do so sometimes requires public support.

Even where gender equity is not the end goal of profamily policy, it may be the means. The idea that gender equity can be the new natalism rests on evidence from both couples and countries. At the couple level, women who have more support in childrearing (either through public policy or a partner who shares in domestic tasks) are more likely to have two children rather than stopping at one. At the country level, more egalitarian societies have total fertility that is closer to two children per woman than more patriarchal ones (Rindfuss et al. 2016).

At first sight, this emphasis on gender equity seems counter to what used to be a prime support for higher fertility, namely religion. Religion has historically been a pronatalist force, but because it fosters traditional gender role attitudes, its importance for fertility could wane in contexts where gender equity is thought to be emerging as the new natalism.

Are more religious countries slower to adopt egalitarian gender role attitudes?


In a recent paper, I tested whether, across the last three decades, more religious Northern countries have been slower to develop the widespread egalitarian gender role attitudes associated with fertility recovery (DeRose 2021). They haven’t. In fact, gender equitable attitudes have spread faster in more religious countries, in part because it is easier to move from 45% to 55% support for workplace equity than from 85% to 95%. The pool of potential adopters of equitable attitudes is greater where existing support is lower.

In addition, more religious countries are no less likely to advance beyond 65% support for workplace gender equality. This threshold is important because the relationship between gender role attitudes and fertility is curvilinear (Figure 1)
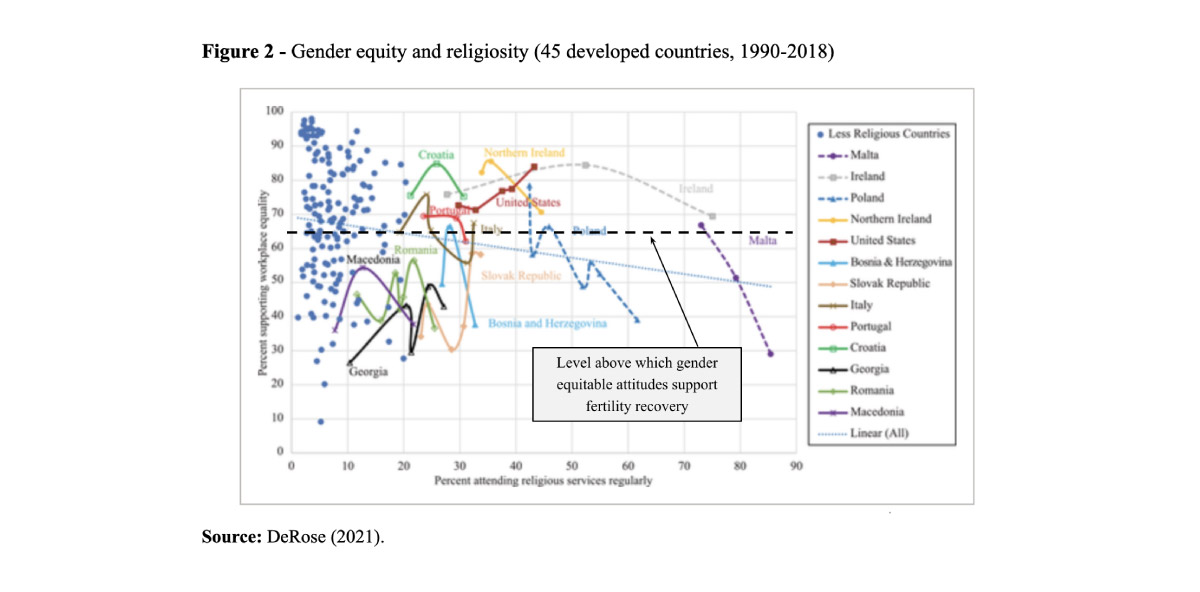
Women’s mass entry into the workforce and the development of public support for working women was associated with lower fertility levels: only the highest levels of gender equity promote higher fertility. If country religiousness impeded the development of widespread support for gender equity, religious countries would be less likely to reach the part of the range where gender equity becomes pronatalist (right part of Figure 1, top part of Figure 2). Figure 2 shows how both less religious countries (blue dots, more than one dot per country) and more religious ones (dots connected by lines and countries identified in the legend) fall both above and below 65%:

This does not mean that secularization is irrelevant for gender role attitudes. On the contrary, countries like Malta, where support for workplace equality has surpassed 65%, would perhaps not have reached this level if over 80% of the population had continued to attend religious services regularly. The key point in this context is that even in a highly religious country like Malta, further advances in already high levels of support for workplace equality can be expected to promote fertility. The old and the new natalism are not really in competition.

Conclusions


My conclusion is that competition between the “old” and the “new” natalism is less of an issue than their negative association might imply. By tracing the evolution of country-level gender equity in more and less religious countries of Europe and North America, it appears that country-level religiosity does not dampen the potential for a fertility recovery stimulated by gender equity. Also worth noting is that the curvilinear relationship between gender equity and fertility, originally “discovered” with reference to the years 1990–2009 (Arpino, Esping-Andersen and Pessin 2015), still remains valid today.

References

  • Arpino B., Esping-Andersen G. and Pessin L. 2015. How Do Changes in Gender Role Attitudes Towards Female Employment Influence Fertility? A Macro-Level Analysis. European Sociological Review, 31(3): 370–382.
  • DeRose L.F. 2021. Gender equity, religion, and fertility in Europe and North America. Pop & Dev Rev, 47(1): 41–55.
  • Rindfuss R.R., Choe M.K. and Brauner-Otto S.R. 2016. The emergence of two distinct fertility regimes in economically advanced countries. Popul Res Policy Rev, 35: 287–304.

Thursday, April 7, 2022

family budget

Сторонников раздельного семейного бюджета за два года стало больше


За время пандемии россияне стали чаще практиковать раздельный семейный бюджет, хотя большинство по-прежнему за традиционный подход: деньги в семье общие, и супруги тратят их по согласованию друг с другом. В опросе сервиса по поиску высокооплачиваемой работы SuperJob приняли участие представители экономически активного населения страны.

Правильным способом распределения семейного бюджета большинство россиян считает такой, когда деньги общие, а супруги распоряжаются ими совместно, согласуя траты друг с другом (72%). По мнению 9% опрошенных, оптимальной является ситуация, когда у каждого из супругов свой кошелек. Деньги в семье общие, и каждый имеет право тратить их по своему усмотрению — это одобряют 5% опрошенных. Ситуацию, когда финансы общие, а распоряжается ими жена, считают разумной 4%. Лишь 2% россиян убеждены, что общими деньгами супругов должен распоряжаться муж (причем мужчины думают так чаще женщин — 4% против 1%).

На практике же в большинстве российских семей бюджет совместный. Такой подход принят в семьях 65% опрошенных. Раздельный семейный бюджет организован у каждого десятого респондента (10%). 7% россиян рассказали, что в их семье деньги общие, а тратят их супруги по своему усмотрению. 6% респондентов рассказали, что бюджетом распоряжается жена (чаще других так ведут семейный бюджет опрошенные с доходом менее 30 тыс. руб. — 15%). В семьях 3% опрошенных деньгами единолично распоряжается муж.

Кто из супругов должен зарабатывать больше? Каждый второй россиянин (50%) считает, что главным добытчиком в семье должен быть муж. Чаще в этом убеждены опрошенные с доходом свыше 80 тыс. руб. (60%) и сами мужчины (54% против 47% среди женщин). Еще 48% респондентов уверены, что финансовый вклад каждого из супругов в семью не имеет значения. Лишь 2% опрошенных считают, что женщина должна приносить в семью больше денег, чем муж.

В российских семьях сильный пол действительно чаще зарабатывает больше: о такой ситуации в своих «ячейках общества» сообщили 56% мужчин и 47% женщин. О том, что в их семью больше денег приносит женщина, рассказали 19% представительниц прекрасного пола и 17% мужчин. По словам 22% мужчин и 24% женщин, в их семьях заработки примерно равны.

Подход, при котором каждый из супругов тратит исключительно свои деньги, за время пандемии стали называть правильным чаще. При этом число тех, кто придерживается традиционного способа распределения семейного бюджета (деньги общие, и распоряжаются ими оба супруга по согласованию), сейчас меньше, чем в предыдущие годы: в 2009 году о таком подходе к финансам сообщали 74% опрошенных, в 2013-м — 71%, в 2020-м — 67%. Растет число россиян, не придающих значения тому, кто из супругов больше зарабатывает: сегодня мужчины и женщины придерживаются этой точки зрения в полтора раза чаще, чем в 2007 году. За два года выросло число семей, где жена зарабатывает больше мужа. [насколько? интересно же]

Место проведения опроса: Россия, все округа
Населенных пунктов: 375
Время проведения: 15 марта — 4 апреля 2022 года
Исследуемая совокупность: экономически активное население России старше 18 лет
Размер выборки: 1600 респондентов

Подробнее

Sunday, September 26, 2021

Spain: a pioneer in gender-equal parental leave

про пионеров-героев:
September 23, 2021 Teresa Jurado-Guerrero and Jacobo Muñoz-Comet

Gender equality in child care can be promoted through individual entitlements to a non-transferable and well-paid leave of equal duration for women and men. While this design is still rare in Europe, Spain may have become a forerunner, say Teresa Jurado-Guerrero and Jacobo Muñoz-Comet.

Fathers’ involvement in childcare: society and policy


Many factors are causing European couples to adopt more gender-balanced work-life arrangements. Higher levels of tertiary education among women have increased female employment rates. Greater educational homogamy and hypogamy among younger couples (meaning that the woman’s level of education is equal to or higher than the man’s), higher divorce rates and low fertility levels enable more women to demand that men assume their fair share of housework and childcare. The number of dual-earner couples has increased as a consequence. Policies are following social demands to promote men’s involvement in childcare, especially at the turning point of entry into fatherhood (Moss and Duvander 2019).

A relevant policy example is the recent European Directive on Work-Life Balance (2019/1158), which aims to promote equal sharing of care and work responsibilities through greater involvement of men in domestic tasks. A couple of years earlier, the EU Commission had indicated that well-paid, individual and non-transferable leaves are a core instrument to promote involved fathering (European Commission 2017). However, the 2019 directive itself has been somewhat shy in stipulating the length of leaves for fathers and their wage replacement level, due to differing views and existing practices across EU member states. Indeed, the provision of 10 days of paternity leave paid at the same level as sick leave and two months of non-transferable parental leave to be paid at a level set by Member States has defined standards below the existing entitlements in several EU countries (Koslowski et al. 2021).

2019: Spain takes the lead?


In 2019, Spain approved a more ambitious reform. It established 16 weeks of individual, non-transferable leave on full pay for fathers and mothers, implemented on a progressive basis. Spain has therefore become the EU country with the longest leave for fathers, and the only one where a well-paid and non-transferable leave is of equal duration for both parents.

This new 2019 leave system has been established for different reasons, such as a strong feminist movement, a civic platform lobbying for it since 2005,1 a left-wing coalition government and a high proportion of fathers having used the previous (shorter) paternity leave. In a recent paper, we looked at trends in paternity leave take‑up rates from 2008, when a two-week paternity leave was introduced, to 2018, when it was extended to five weeks (Jurado-Guerrero, Muñoz-Comet 2020).

A success story: 2008-2018


We calculated the paternity take-up rate as the proportion of fathers aged 20-49 among those in employment who took the leave. Figure 1 shows that the extension to four and five weeks increased take-up rates from the previous level of 70% up to 80% in 2018, with an average leave of 30 days.
Of the 20% or so of working fathers who did not use paternity leave, some may have feared being penalized at work or felt they could not be properly replaced during their absence. More importantly, there are regulatory reasons: not all working fathers are entitled to a paid leave due to the informal nature of their jobs or to insufficient previous social security contributions. Note that benefits are based on past social security contributions, which may not reflect self-employed fathers’ true monthly income (partly concealed from the fiscal authorities): in short, paternity allowances, in these cases, do not fully replace real incomes.

However, in a comparative perspective, an 80% take-up rate is a clear success story (Koslowski et al. 2020) and has narrowed the gender gap in leave allowances. More than that, actually: in 2018 slightly more fathers than mothers took their parental leave (although it is also fair to add that men more often have jobs with better social security coverage, and therefore have a stronger incentive to tap this resource).

Taking paternity leave seems to have become a social norm that cuts across different social groups. We analysed how fathers’ likelihood of uptake evolved over the whole period across social groups, during the economic crisis (2008–2013); during the economic recovery (2014–2016); and during the parental leave extension to 4/5 weeks (2017–2018).

Figure 2 shows the average adjusted probabilities of using paternity leave for fathers by type of employment, educational level, social class and type of contract, the four most frequent social divides identified in research. Note, first, that changes over time are statistically significant only during the period of leave expansion.
During this final period, a reduction was observed in the take-up gap between employed and self-employed fathers (top left) and also between fathers with permanent and fixed-term contracts (bottom right). Even more than that, the gap between fathers with tertiary education and those with lower secondary education or less even reversed (top right), as did the gap between professionals and unskilled workers (bottom left).

This norm of extended paternity leave proved somewhat less effective for immigrant fathers, fathers with an inactive wife and those working in the private sector. Overall, however, the political and social legitimation of paternity leave now seems to be well established in Spain.

Good intentions and practical results


Little is known as yet about the 2021 reform that increases leave to 16 weeks. The first indications are good: fathers seem to have been particularly keen to use it (more male than female beneficiaries). However, in 75% of cases, fathers use the leave simultaneously with mothers, immediately after the birth. Nice as it may be for parents to share the joys of a newborn child, the practical issue of taking turns to look after the baby may not have found a better solution with the new law. Indeed, according to the international platform PLENT, the new law has a pitfall: fathers are obliged to use their leave together with the mother, while most couples would probably prefer to take leave alternately in order to facilitate the mother’s return to the labour market. On top of that, we do not yet know how many weeks fathers have taken up, or if they use the leave full- or part-time. And we may not know until a survey is conducted, because the Spanish social security releases little current information, and does not provide the data required to monitor and evaluate the effects of the reform.

In short, while the new Spanish leave system is better designed in principle for equal use than the 2019 EU directive, it may have made equal sharing of childcare more difficult than it was before.

References

  • European Commission (2017) Communication from the Commission to the European parliament, the Council, the European Economic and Social Committee and the Committee of the Regions – An initiative to support work-life balance for working parents and carers, Brussels, 26.4.2017, COM(2017) 252 final.
  • Jurado-Guerrero T., Muñoz-Comet J. (2021) Design Matters Most: Changing Social Gaps in the Use of Fathers’ Leave in Spain. Population Research and Policy Review, 40: 589-615. Koslowski, A., Blum, S., Dobrotić, I., Kaufman, G. and Moss, P. (2021) International Review of Leave Policies and Related Research 2021. DOI: 10.18445/20210817-144100-0. Available at: www.leavenetwork.org/annual-review-reports/review-2021/Moss P., Duvander A.Z. (Eds.) (2019) Parental leave and beyond: Recent international developments, current issues and future direc

The Spanish platform for Equal and Non-transferable Birth and Adoption Leave


Wednesday, May 19, 2021

Where Europeans Get To Work From Home

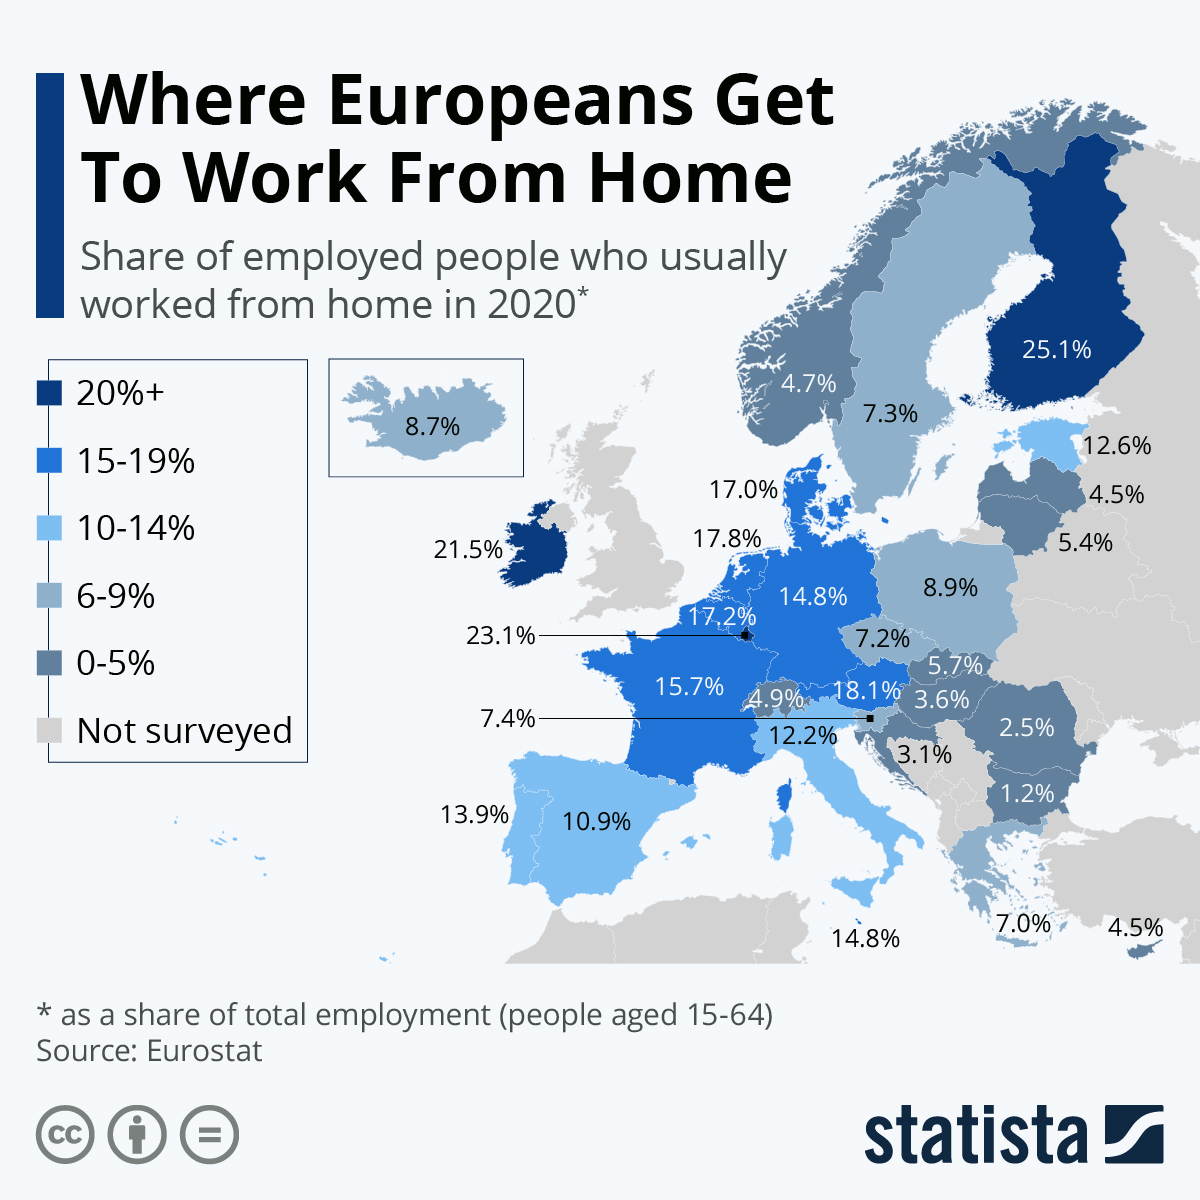
The social distancing measures introduced in response to the Covid-19 pandemic has forced many people to work from home and accelerated the trend of remote working. Eurostat have released some interesting new data showing the share of employed people aged between 15 and 64 in Europe who usually do home office. Over the past decade, that has been hovering at around five percent and the pandemic has seen it rise to 12.3 percent.

With a quarter of its employed residents usually working from home, Finland now has the highest share of remote workers in the EU. It is followed by Luxembourg and Ireland, both of which have home working shares in excess of 20 percent. Home office rates are far lower in parts of Eastern Europe and it's practically unknown in Bulgaria and Romania where the share is just 1.2 percent and 2.5 percent respectively. This infographic shows the situation across the continent and it also includes rates in EEA countries - Iceland, Switzerland and Norway. UK data was not available.Infographic: Where Europeans Get To Work From Home | Statista
интересно: чтов РФ?

Tuesday, November 3, 2020

homelessness in Australia

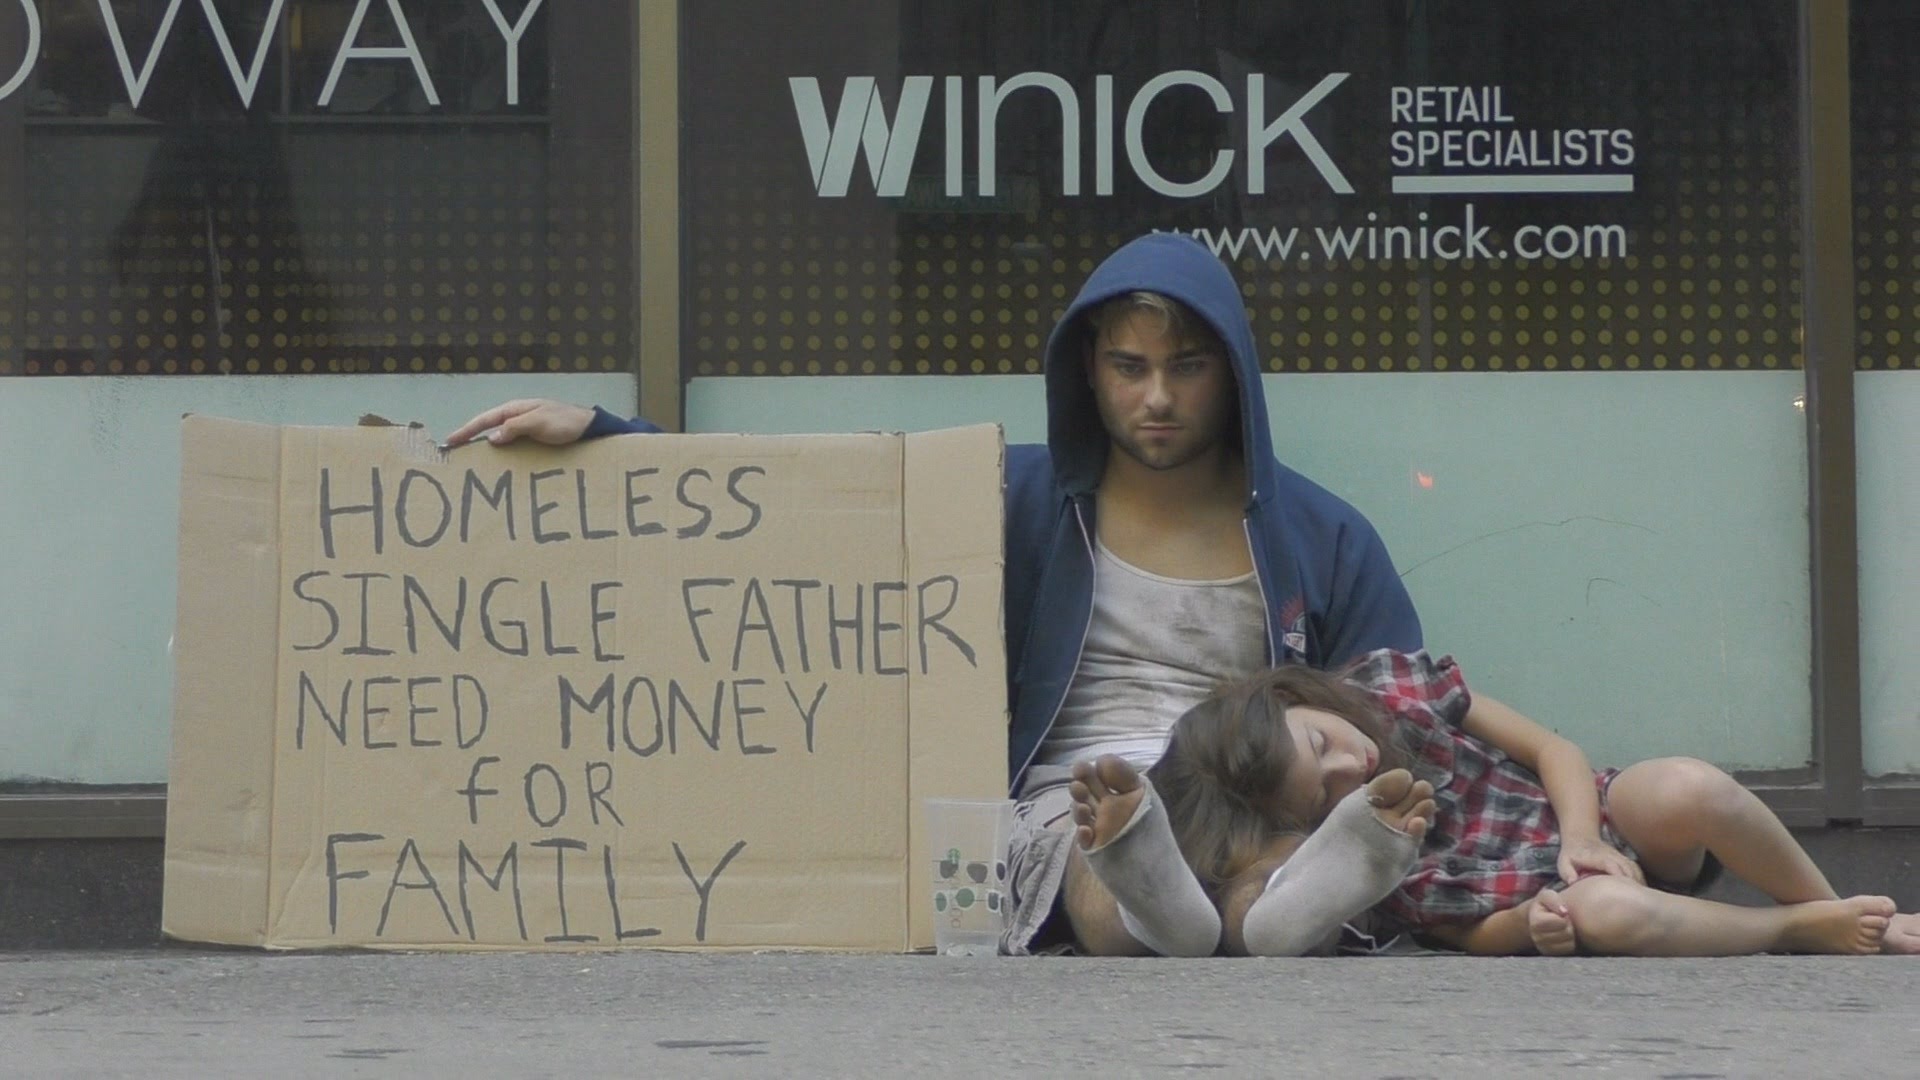
винник, дай денег
Published on N-IUSSP.ORG November 2, 2020

How many people experience homelessness in Australia?


James O’Donnell

Homelessness is damaging to individuals and society – and an exceedingly difficult phenomenon for researchers and policymakers to measure and analyze. In this article, James O’Donnell describes a new approach to estimating annual homelessness. Demonstrating the approach with existing data from Australia, the results point to the wide impact of homelessness and housing deprivation in society.

Most estimates of homelessness are based on point-in-time counts, such as the night or consecutive nights of a homelessness count. These are important because they provide critical information on the daily need for housing and homelessness services such as crisis accommodation. However, because homelessness is often experienced temporarily or episodically (Culhane et al. 2007; Link et al. 1995), more people experience it than are ever captured at a single point‑in-time.

Capturing the effects of these dynamics is difficult. Administrative data collected from homelessness service providers is an important source of longitudinal information (Culhane et al. 2007), but only capture data on those who come into contact with services. Household surveys sometimes ask retrospective questions about past episodes of homelessness, from which estimates of annual and lifetime rates of homelessness have been calculated (Chamberlain and Johnson 2015). However, these surveys invariably miss the potentially large population who are experiencing homelessness at the time of the survey. Thus, we do not really know how many people experience homelessness in any given year.

Estimating the currently homeless


In new research, I propose a method for estimating the size of the population missed in retrospective household surveys (O’Donnell 2020). Inspired by Capture‑Recapture techniques, the approach sets out to establish a relationship between the population whose homelessness over a 12 month period is ‘observed’ in a household survey to the population whose homelessness episodes are ‘unobserved’.

Observed episodes are those that conclude in the 12 months prior to a household survey, making individuals eligible for selection into the survey sample (barring death, imprisonment or emigration). Unobserved episodes are those that are ongoing at the time of the survey, making individuals ineligible for sample selection (see Figure 1). Dividing the number of unobserved episodes by the observed episodes gives what I call the k ratio.

fig 1 (should appear here https://www.niussp.org/wp-content/uploads/2020/11/fig_1_niussp.jpg)

There are in fact a set of k ratios specific to the duration of homelessness episodes. To understand their rationale, take the example of an individual who is homeless for one month in the year. This person will have a one-in-12 chance on being homeless on an average day. Under a certain set of assumptions (e.g. homelessness occurs uniformly throughout the year), this could also be taken to be the probability of the episode occurring at the time of a survey and therefore being unobserved. Dividing it by its complementary probability of the episode being observed (i.e. 11‑in‑12) gives a k ratio specific to episodes lasting one month. Calculating ratios for each duration and multiplying them by the number of observed homelessness episodes gives an estimate of the non‑sampled population experiencing homelessness at the time of the survey.

Applying the approach using Australian data


I use retrospective data from Australia’s General Social Survey (GSS) 2014 to operationalize the approach (ABS 2015). The GSS was a survey representing almost all private households in Australia. A homelessness module in the survey asked responding adults (aged 15 years and over) several questions about past experiences of homelessness, including the timing and duration of their most recent episode.

Respondents were recorded as having experienced homelessness when they reported not having a permanent place to live for reasons outside of their personal control and choice. Living circumstances included those often described as ‘literal’ and ‘hidden’ homelessness. Literal homelessness includes people sleeping rough on the streets and in makeshift dwellings (e.g. tents, cars, abandoned buildings, and train stations) and people staying in homeless shelters. Hidden homelessness or ‘housing exclusion’ includes people staying with family and friends (e.g. ‘couch surfing’) or in caravans/mobile homes, motels, hostels, and boarding/rooming houses.

A microsimulation model was used to account for several aspects in calculating the k ratios. Ratios were calculated by simulating homeless episode start and end dates and survey sample selection dates for a synthetic population. Episodes that overlapped selection dates were considered unobserved, while episodes that finished in the prior 12 months were observed. Microsimulation allows for the incorporation of auxiliary data on seasonal variation in the onset of homelessness, the size of the population who experience long-term homelessness, or the occurrence of multiple homelessness episodes. It also takes account of people who die or otherwise move out of the sample frame (e.g. due to imprisonment and migration).

Annual estimates of homelessness


According to the GSS, 351,000 adults experienced a completed episode of literal or hidden homelessness in Australia in the 12 months to 30 June 2014. On top of this, I estimate that 148,400 adults were experiencing homelessness at the time of the survey and a further 8,900 episodes may have been otherwise missed (e.g. due to people dying before the survey). Thus, 508,300 adults or 2.7 per cent of the Australian population were estimated to have experienced homelessness in the 2013-14 financial year.

The impact of homelessness and housing deprivation in society is considerably larger than existing measures suggest. The population who experience homelessness over a one-year period is predicted to be 3.4 times larger than the number counted on any single night. Further, only one-in-five homeless people are predicted to seek help from housing and homelessness services, suggesting that administrative data from such services substantially understate the scale of the problem.

The experience of homelessness is more diverse than commonly measured. Of the 508,300 adults who experienced homelessness in 2013-14, only 52,300 people (0.28 percent of the population) experienced literal homelessness on the streets or in a homeless shelter. Approximately 90 percent of episodes involved at least one period of staying with family or friends. And while 25 percent of episodes are predicted to last 12 months or longer, approximately 20 percent last less than two weeks. As shown in Figure 2, this contrasts strongly with point‑in‑time counts which tend to overrepresent long-term homelessness.

fig 2 (should appear here https://www.niussp.org/wp-content/uploads/2020/11/fig_2_niussp.jpg)

Implications


Estimating homelessness is difficult and the results are imprecise. In addition to sampling and non-sampling error, estimates in this article are the product of how homelessness is defined and how data are collected and measured in Australia. Nevertheless, two key implications have broader application. Firstly, homelessness and housing deprivation impact a larger and more diverse population than conventional measures suggest, highlighting the position of literal homelessness within a much larger dynamic of housing and financial disadvantage and deprivation.

Secondly, much of the burden for preventing and responding to homelessness falls on interpersonal support networks. While staying with family and friends is often not considered a form of homelessness, it appears to be the most common arrangement for people without their own permanent home and is likely to be an important staging and landing point for people entering and exiting the street and sheltered homelessness (O’Donnell 2019).

Such implications highlight the importance of public policy in rectifying housing market deficiencies and providing a safety net when interpersonal supports fail or no longer exist. They also underscore the value of annual estimates, not just to measure the scale of homelessness, but also to reveal something of its nature and experience.

References

  • ABS (2015). General Social Survey: Summary Results, Australia, 2014. Cat no. 4159.0. Canberra: Australian Bureau of Statistics.
  • Chamberlain, C. and Johnson, G. (2015). How many Australians have slept rough? Australian Journal of Social Issues, 50(4), 439-456.
  • Culhane, D.P., Metraux, S., Park, J.M., Schretzman, M., and Valente, J. (2007). Testing a typology of family homelessness based on patterns of public shelter utilization in four U.S. jurisdictions: Implication for policy and program planning. Housing Policy Debate, 18(1), 1‑28.
  • Link, B.G., Phelan, J., Bresnahan, M., Stueve, A., Moore, R.E., and Susser, E. (1995). Lifetime and Five-Year Prevalence of Homelessness in the United States: New Evidence on an Old Debate. American Journal of Orthopsychiatry 65(3), 347-354.
  • O’Donnell, J. (2020). Estimating annual rates of homelessness. Demographic Research, 43(1), 1-34.
  • O’Donnell, J. (2019). Does social housing reduce homelessness? A multistate analysis of housing and homelessness pathways. Housing Studies, DOI: 10.1080/02673037.2018.1549318, 1-27.

Saturday, July 25, 2020

eggs again

а был ли ГОСТ?
мб, на яйца и не было

всё равно = размер яиц, просто возмутительный

Sunday, May 31, 2020

structural shocks and extreme exposures related to covid

Sex During Coronavirus

Социология коронавируса, сборник статей


In the United States, nearly all states have issued stay-at-home orders. Most people’s lives are legally and structurally confined to their neighborhoods and the resources in those neighborhoods. This means that structural inequality has the potential to be exacerbated rather than reduced.Let’s take two neighborhood profiles. On one hand, people in well-resourced neighborhoods with stocked grocery stores, spacious yards, and telework may largely live their days typing on laptops, accidently displaying their video on Zoom meetings, and exercising on their new Peloton bikes. On the other hand, people in low-income neighborhoods are stuck with limited produce and food options, a reduced public transportation schedule that further exposes them to risks of contracting the coronavirus, and “essential” work with low wages that has not kept pace with inflation and often leads them to serve those living in the well-resourced neighborhood.

The articles in this wave of our COVID-19 special online issue address shocks to social institutions that lead to extreme outcomes. Branch documents how the coronavirus may lead to over policing and a lasting legacy that formalized a surveillance state. Lewis-McCoy and Pothen address how local geographies matter. Lewis-McCoy gives us insights into the lives of people in New Rochelle, New York (considered ground zero of the COVID-19 outbreak in the United States). Pothen discusses how social networks matter during unstable times. Accordingly, it is even more important for scientists to be trusted.

Eyal discusses why the COVID-19 pandemic may be a make or break moment for the science community. He argues it is critically important for academics and scientists to reestablish themselves with the public as a trusted source during an era of perceived “fake news.”

The final three pieces in this issue address how families are being impacted by the coronavirus. Gengler discusses how families simply are not structurally prepared to live in a moment of crisis, while Balboa highlights the strength of family ties. Carpenter ends by discussing sex and the role the coronavirus may have on romantic and sexual relationships.

We hope the articles being released in this special online issue are useful for providing more in-depth analysis beyond headlines and White House meetings where the president discusses TV ratings. People are dying, healthcare providers and frontline workers are trying to preserve their physical, mental, and emotional health, and families are struggling. Social context matters in moments like these for people to put what is occurring on a micro-level in a broader structural context. We believe these articles help to provide this balance.

– Rashawn Ray and Fabio Rojas

Tuesday, May 5, 2020

A 5-point strategy for improved connection with relatives of critically ill patients with COVID-19

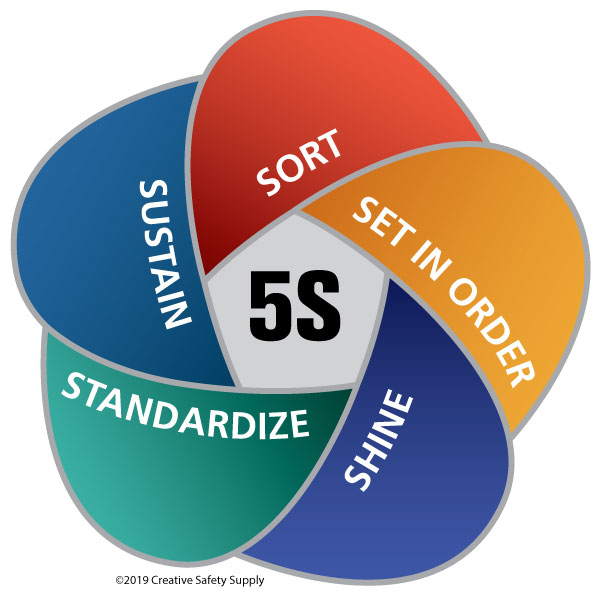
5s
  1. Stimulate family visits by restricting them to the closest relative who is asymptomatic and able to apply optimal personal protective measures.
  2. Standardized written information for relatives. This letter is sent to the relatives but also discussed during the first remote call between the health-care professionals and the family.
  3. Schedule routine telephone calls with the relatives to maintain continuity of communication. The calls could be made by a medical student, a non-ICU physician, another health-care professional, or a volunteer. In addition to these calls, family members are invited to call the physician and bedside nurse once a day to receive basic information. More detailed information is to be provided during a face-to-face meeting when the relative visits the patient. For conscious patients, smartphones and digital tablets can allow video calls or virtual ICU visits.
  4. Stay in touch by encouraging the family to find ways to improve the link with the relative (web-based remote family conferences, diaries, drawings, text messages, and media groups).
  5. Switch to a different approach in end-of-life situations to avoid depriving family members of the opportunity to say goodbye to a relative. For example, family conferences should be organized, remotely if needed, to meet family needs and prepare for the bereavement. The relative should be allowed to stay in the room as much as possible. However, the safety of the relative is a primary concern, and the health-care professionals must provide the relative with training in the use of personal protective equipment.

The Lancet

Thursday, April 16, 2020

do you have ?

как правильно пользоваться санитайзером
висит у нас в подъезде уже третий день,
а внутри спирт, и ещё не спёрли — брезгуют?

Tuesday, March 10, 2020

Where Europeans Get To Work From Home

Eurostat has released some interesting new data showing the share of Europeans who regularly do home office. In 2018. 5.2 percent of people aged between 15 and 64 regularly worked from home across the EU. That share has remained relatively constant at about five percent over the past 10 years. The Netherlands has the highest share of workers who say they usually work from home at 14 percent, closely followed by Finland with 13.3 percent.

Home office rates are far lower in parts of Eastern Europe and it's practically unknown in Romania and Bulgaria where the rates are just 0.3 percent and 0.4 percent respectively. This infographic shows the situation across the continent and it also includes rates in EEA countries - Iceland, Switzerland, and Norway. Eurostat states that older people tend to work from home more often than younger people. In 2018, 1.8 percent of 15-24 year-olds worked from home in EU countries compared to 5 percent of 25-49 year-olds and 6.4 percent of 50-64 year-olds.
Infographic: Where Europeans Get To Work From Home | Statista

Friday, December 13, 2019

Demographic change and aging without family: a global perspective

Published on N-IUSSP.ORG December 9, 2019

Vieillir sans famille dans un contexte d'évolution démographique : perspectives mondiales


Rachel Margolis, Ashton M. Verdery

Some older adults do not have spouses or biological children, i.e. the types of family members who are most likely to provide help in case of need. Rachel Margolis and Ashton M. Verdery discuss the demographic causes, the prevalence and the likely future evolution of “kinlessness” around the world.

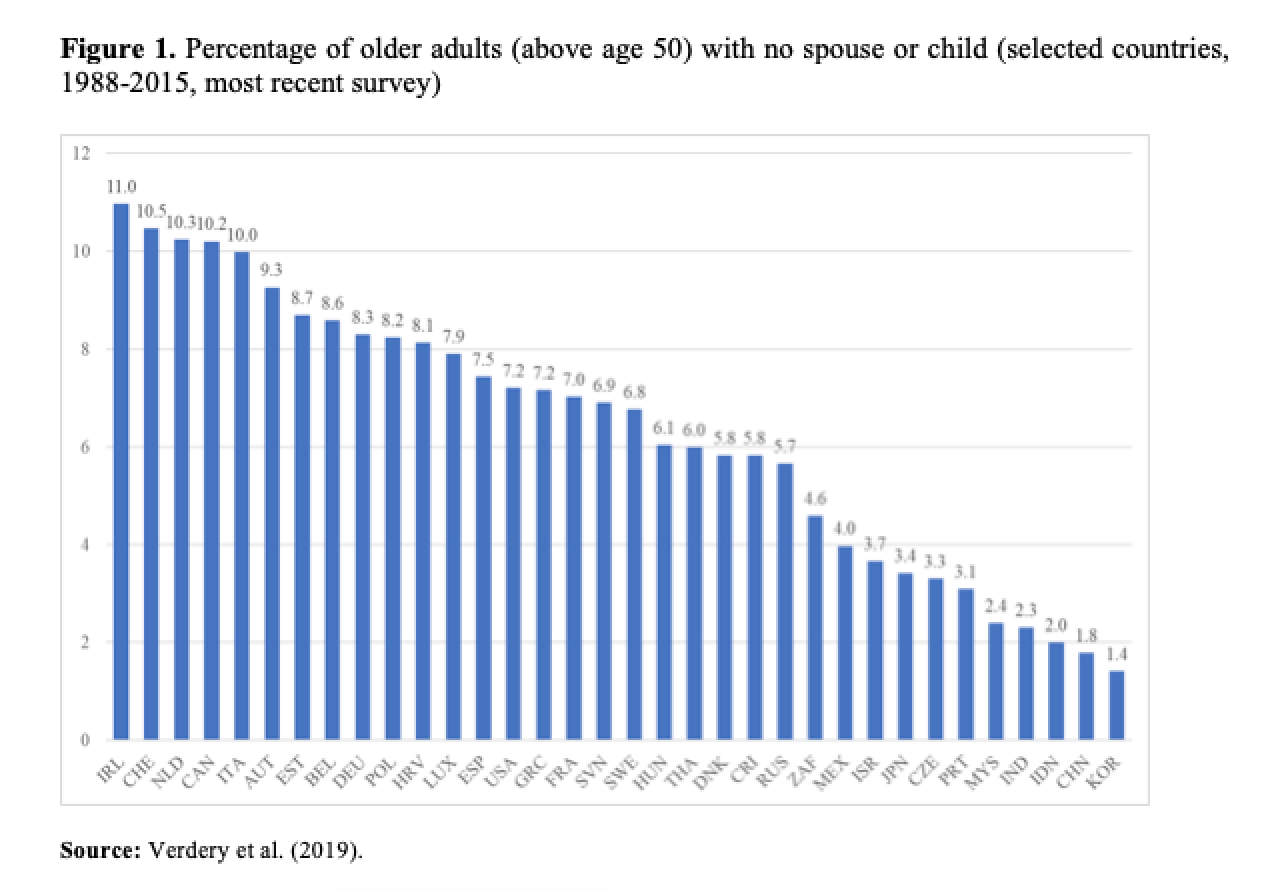
In a recent article (Verdery et al. 2019) we examined the prevalence of kinlessness among adults over age 50 around the world, the demographic processes that may explain this prevalence, and the associations between kinlessness and health and well-being. We document extensive cross-national variation.

Demographic processes strongly correlate with national prevalence of kinlessness. In fact, current levels are predicted by fertility and marriage rates from decades ago. Given that low fertility and lower rates of marriage have spread throughout all regions of the world, we expect to witness increasing rates of older adult kinlessness in the future. This potential growth has important but heterogeneous implications for the global health and well-being of older adults.

Background


Many studies have found that as older adults age, their social networks shrink due to less contact with co-workers and friends (e.g. Cornwell, Laumann and Schumm 2008). This means that they often rely heavily on family members for help with health problems, economic insecurity, and social interaction. Recent research on the characteristics of older adults in the United States with no living kin has found that they tend to be disadvantaged in terms of health and economic security (Margolis and Verdery 2017).

The demographic changes that have led to an increasing population of kinless older adults in the United States – low fertility, childlessness and increases in non-marriage and divorce – are also occurring elsewhere in the world (Glaser et al. 2006; Raymo et al. 2015). However, the parallel trends of mortality decline and of increases in remarriage, non-marital partnerships and step-families may blunt the effects of this increase.

How common is it for older adults to lack a spouse and children?


We examined how common it is for contemporary older (50 years and over) adults around the world to lack living kin, the demographic correlates of this prevalence, and whether such individuals are uniformly disadvantaged across contexts. To do this, we analyzed survey data from 34 countries that together make up 70% of the world’s population over age 50 and come from all areas of the world. We did the best that we could to include sources from understudied regions like Africa, Southeast Asia and Latin America. From each data source, we used the most recent survey year that was nationally representative of the older adult population to get the most current estimates of kinlessness (1988-2015). Because we were examining data from so many contexts, we focused on measures that were available and reasonably comparable across surveys: whether the respondents had legally recognized marriages, for example. In our previous research on the United States and China, we found that rates of kinlessness vary little when our estimates include non-marital partnerships, because most older adults in non-marital partnerships already have children (Margolis and Verdery 2017; Zhou et al. 2019). As we could not capture the geographic proximity of family members in most surveys, this analysis is a conservative estimate of older adult family isolation, since having a kin tie is necessary but not sufficient for having a relationship with that family member.

There is great variation in the prevalence of older adults lacking close kin, i.e. a spouse or a living child (Figure 1). The percentage is highest (10-11%) in Canada, Ireland, the Netherlands and Switzerland. In Austria, Belgium, Croatia, Estonia, France, Germany, Greece, Hungary, Italy, Luxembourg, Poland, Slovenia, Spain, Sweden, Thailand, and the United States levels range between 6% and 10%, and in Costa Rica, Czech Republic, Denmark, Israel, Japan, Mexico, Portugal, Russia, and South Africa they are between 3% and 6%. A last group of countries has very low levels of kinlessness, about 2% or lower, and these countries are all in Asia: China, India, Indonesia, Malaysia, and the Republic of Korea.

Are older kinless adults disadvantaged?


We also examined micro-level associations between lacking a spouse and children and sociodemographic and health indicators and found that characteristics of the kinless population of older adults vary considerably across countries. Table 1 highlights the countries where older adults without family are more – or less – likely to be male vs. female, in fair or poor self-rated health vs. good health, have low education given their context, and live alone vs. live with others; all results are adjusted for age. There is no causal direction assigned to these associations. For example, one could be kinless due to extreme poor health, or in poor health due to a lack of close kin, or the association could be linked to other social factors.

We find that in most countries, older adults without close kin have equivalent or worse self-rated health and lower education than their counterparts with family, although there are some notable exceptions in the middle column. We also find substantial variation in the gender composition of the kinless population. For example, in China, it is predominantly male. Many other countries, including Ireland, Denmark, Slovenia, Germany, and Poland, also have more men than women among kinless older adults, controlling for age. Yet others, such as Indonesia, Portugal, Thailand, Greece, Canada, and Russia have more kinless women than men, controlling for age. Still others are in the middle, with no age-adjusted tendency for the kinless to be men or women. Although we find that kinless older adults in all countries are more likely to live alone than older adults with kin, we also find substantial variation in the odds of this across different contexts. For instance in Mexico, kinless older adults are 3.1 times more likely to live alone than those with kin, but in Greece, they are 45 times more likely to be living alone.


Implications for the future


Our rough estimate is that 3.8% of the adults 50+ (43.6 million) in the countries we examined do not have a spouse or biological children. As global fertility decline continues, and childlessness and non-marriage continue to spread throughout many global regions, we will likely see more older adults lacking spouses and children. In addition to a likely increase in the percentage of older adults lacking close kin, their number is also likely to grow because of both population aging and population growth. The rise of older adults with no close family members presents challenges for policy-makers, and innovative social policies will be needed to ensure their future well-being.


Acknowledgments


The authors acknowledge funding from the multi-country project, “Care, Retirement and Well-being of Older People across Different Welfare Regimes” (CREW).

References