Showing posts with label мужчина. Show all posts

Friday, February 16, 2024

conservative men vs liberal women

В самых разных странах мира в последние годы женщины становятся либеральнее, а мужчины - консервативнее.


Например, разрыв в рейтингах одобрения Билла Клинтона мужчинами и женщинами в 1992-2000 годах составлял от 1% до 9%, причём в шести опросах его больше любили женщины. Доля мужчин, одобрявших Трампа, превосходила долю женщин от 12 до 22 п.п. (До 16%).

Южная Корея по всей видимости и здесь - страна будущего, в дальнейшем, такой огромный разрыв во взглядах полов будет характерен и для других развитых стран.

The Economist

Monday, July 17, 2023

tolerance

Россияне стали терпимее к привычкам вторых половин


Сервис по поиску высокооплачиваемой работы SuperJob узнал, какие привычки супругов раздражают россиян. В открытом опросе приняли участие экономически активные граждане из всех округов страны, состоящие в браке.

Женщин в супругах чаще всего раздражает курение (10%), храп (7%) и беспорядок (6%). О пристрастии мужей к алкоголю говорили 5% женщин, еще 4% раздражает, что мужчины повышают голос. По 3% женщин жаловались на лень и интернет-зависимость своих вторых половин.

Мужчин больше всего раздражает, когда жена курит (8%). О занудстве и болтливости своих спутниц упоминали по 2%.

Бесконечный просмотр телевизора и несовпадение биоритмов одинаково раздражает мужчин и женщин (по 1%).

Среди других раздражающих привычек своих партнеров россияне называли нотации, упрямство, чрезмерный контроль, ложь, постоянные опоздания, долгие сборы и непрошенные советы.

По сравнению с аналогичным исследованием 2010 года, россияне стали терпимее к привычкам вторых половин: сегодня ничто не раздражает 37% мужчин и 3 из 10 женщин. 13 лет назад таковых было 24 и 14% соответственно.

Место проведения опроса: Россия, все округа
Населенных пунктов: 351
Время проведения: 1—14 июля 2023 года
Исследуемая совокупность: экономически активное население России старше 18 лет, состоящее в браке
Размер выборки: 1600 респондентов


Sunday, April 30, 2023

sperm donor

Донора спермы из Нидерландов подозревают в отцовстве 600 детей по всему миру. Суд лишил его прав на донорство


Теперь этому 41-летнему мужчине, которого зовут Джонатан, придется заплатить штраф в 100 тысяч евро, если обнаружится, что он нарушил запрет и попытался снова предоставить свою сперму клинике или потенциальным родителям.

Высокая донорская активность Джонатана уже становилась предметом судебного разбирательства в стране. В 2017 голландский году суд запретил ему продолжать сотрудничать с местными клиниками, когда выяснилось, что от его спермы родились более 100 детей.

Но вместо того, чтобы остановиться, Джонатан стал посылать свою сперму датской клинике с клиентурой по всему миру, а также предоставлять ее через интернет.

По правилам, регулирующим голландскую медицину, один донор не должен становиться отцом более 25 детей в 12 семьях. Это связано с беспокойством о том, что из-за большого числа людей с одним отцом, не подозревающих о родстве, в будущем могут появиться случайные близкородственные семейные союзы.

Saturday, April 29, 2023

save the males

Мальчиков рождается больше.
Почему же «
на 10 девчонок по статистике 9 ребят»?

Берегите мужчин!


Издревле повелось считать женщин «слабым полом». Если иметь в виду их физическую силу, это правильно. Действительно, ни Власовых, ни Жаботинских среди женщин не сыскать... Но если поставить вопрос в демографическом плане, то есть все основания назвать «слабым полом», наоборот, мужчин.


Их «слабость» проявляется уже с самого рождения. Судите сами. В 1966 г. в нашей стране появилось на свет 2 млн 175 тысяч мальчиков, из них 63 тысячи не дожили до одного года. Это составит 29 на 1000 родившихся. В том же году родилось 2 млн 66 тысяч девочек, из них 48 тысяч не дожили до одного года, т.е. 23 на 1000 родившихся. 23 и 29 – различие существенное! А ведь младенец-мальчик не пьёт, не курит и пользуется всеми преимуществами, предоставляемыми советским здравоохранением, на равных правах с младенцами-девочками. Младенец-мальчик не может пожаловаться также на недостаточное внимание к себе матери, которая в равной мере щедро дарит ласку своему ребёнку, независимо от его пола.

В чём же причины повышенной смертности грудных младенцев-мальчиков? Очевидно, эти причины следует искать в большей биологической жизнестойкости женского организма, которая выработалась на протяжении сотен тысяч лет существования человека: ведь жизнь женщин более важна для сохранения вида, чем жизнь мужчин!

Ну, хорошо, с биологией спорить никто не станет. А как обстоит дело со смертностью взрослых мужчин по сравнению со взрослыми женщинами? И здесь, должны мы сказать, дело у мужчин обстоит неважно. Несколько месяцев назад ЦСУ СССР впервые опубликовало данные по смертности с группировкой по полу и возрасту. Из этих публикаций стало ясно, что уже в возрасте 15–19 лет у юношей коэффициент смертности в два раза выше, чем у девушек этих же лет. С возрастом это различие увеличивается, и у мужчин 25–29-летних коэффициент смертности в 2,5 раза выше, чем у женщин! В более старших возрастах разница сохраняется до преклонных лет – коэффициент смертности мужчин вдвое выше, чем у женщин тех же лет.

Может быть, это тоже биология? Нет, здесь уже действуют причины, над которыми мы имеем власть и на которые мы можем влиять.

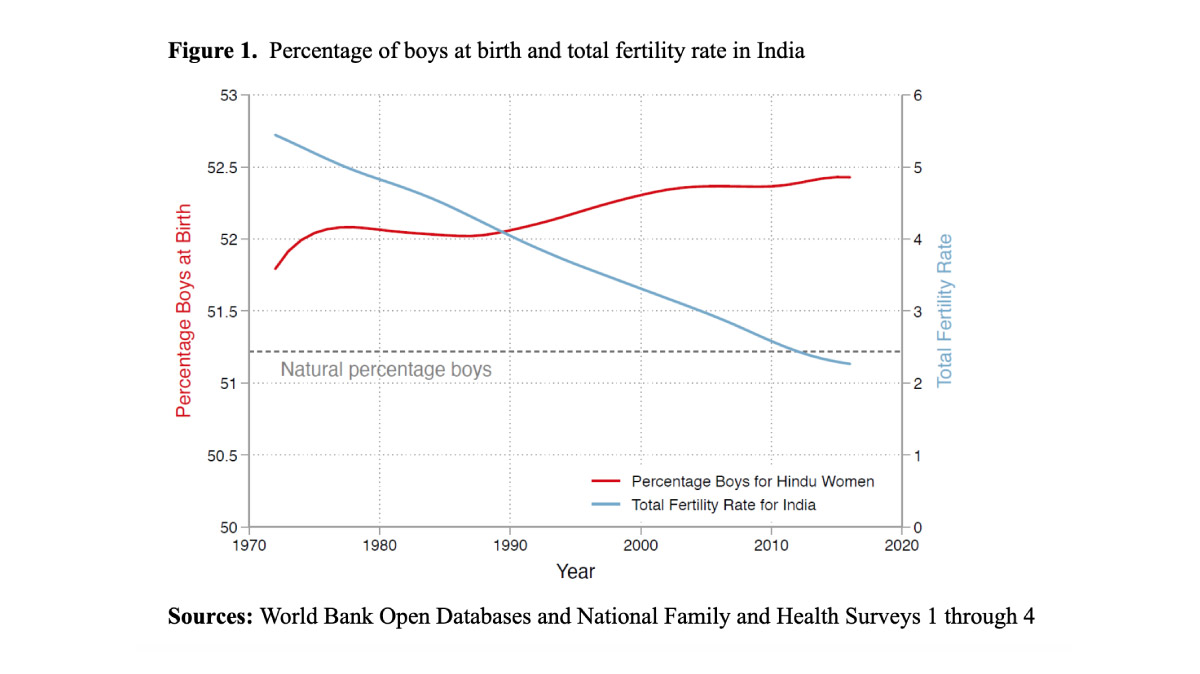
Ещё 306 лет назад стало известно, что мальчиков рождается больше, чем девочек, на шесть процентов. Но, к сожалению, этот драгоценный перевес мужских рождений над женскими, перевес, могущий обеспечить равновесие полов, быстро расходуется за годы младенчества, детства и юности. Примерно к 20–24 годам численность юношей уже сравнивается с численностью девушек. А дальше начинается «женский перевес», он усиливается всё более. Так, по данным последней переписи, в возрасте 20–24 лет женщин было уже на 230 тысяч больше мужчин, а в возрасте 25–29 лет – на 350 тысяч. В последующих возрастах эта разница быстро и неуклонно увеличивается.

Подумать только, какие были бы огромные положительные последствия во всех областях нашей жизни, если бы взрослых мужчин было столько, сколько взрослых женщин!

Начнём с экономических. Ведь каждый человек является как бы аккумулятором народных средств, потраченных на его прокормление, воспитание и образование… Взрослый человек на протяжении рабочей жизни своими золотыми руками, строя дома и заводы, находясь за рулём трактора или стоя у станка, обеспечивает народ самым необходимым, этим самым как бы возвращая средства, потраченные на него в дорабочий период его жизни… И вот как раз на протяжении рабочего периода жизни мужской пол несёт потери в 2–2,5 раза более значительные, чем женщины. Нетрудно представить себе, какой урон это приносит народному хозяйству страны.

Велики также последствия повышенной мужской смертности и с точки зрения жизни семьи.

Муж, жена, дети – вот каков должен быть состав семьи. Если же в семье остаётся мать с детьми, то этим уже резко нарушается нормальное существование всех членов семьи. Только в оперетте вдова может быть весёлой. Обычно у вдов нет особенных причин веселиться. И уже не так много шансов выйти замуж второй раз и ввести в дом хотя бы отчима… «Мужчины делают всё для того, чтобы их не хватало», – говорит героиня одной старой пьесы. Эта «нехватка» мужчин весьма пагубно отражается на многих областях нашей жизни. Правда, распространённая песенка о том, что «на 10 девчонок по статистике 9 ребят», преувеличивает ситуацию, но одновременно и предвосхищает – когда этим девчатам и ребятам будет по 25–30–35 лет, соотношение числа мужчин и женщин будет приближаться к тому, о чём говорится в песне.

Таким образом, перевес мужской смертности над женской означает сотни тысяч «осколочных» семей, сотни тысяч женщин, теряющих все блага нормальной семейной жизни.

Некоторые могут подумать, что здесь решающее значение имеет война. Но это не так. Сейчас почти все мужчины в возрасте до 42 лет не принимали участия в военных действиях в годы Великой Отечественной войны. Между тем именно на возраст 30–40 лет приходится резкое превышение мужской смертности по сравнению с женской. Значит, дело не в войне и не в её последствиях. А дело в том, что по сравнению с женщинами мы гораздо меньше оказываем внимания охранe здоровья мужчин.

Взять хотя бы консультации. Женские у нас есть, а мужских нет! Почему? Убеждён, что необходимо покрыть всю страну густой сетью мужских консультаций. Каковы должны быть иx функции?

Во-первых, в них должна быть сосредоточена борьба по предупреждению несчастных случаев в микрорайоне. Ведь от несчастных случаев гибнут главным образом мужчины.

Во-вторых, в них должна проводиться антиалкогольная и антиникотиновая пропаганда. Алкоголизм – одна из важных причин повышенной мужской смертности. Борьба с алкоголизмом особенно важна ещё и потому, что с ростом доходов населения увеличивается потребление алкоголя. Так, например, за 7 лет, с 1960 по 1967 г., продажа алкогольных изделий возросла гораздо больше, чем численность населения. С таким положением мириться нельзя. Алкоголизм приносит большой урон нашей экономике, нашему обществу, вносит разлад в семью, увеличивая число разводов. Алкоголизм подрывает здоровье мужчин, увеличивая случаи отравления алкоголем, заболевания циррозом печени, нарушения нормальной сердечной деятельности. Надо вести активную борьбу с «зелёным змием» и начинать эту борьбу со школьной скамьи, чтобы на всю жизнь привить отвращение к злоупотреблению алкоголем.

Курение также наносит существенный урон мужскому организму. А между тем потребление табачных изделий также у нас очень быстро растёт. Особенно настораживает распространение курения среди подростков…

В предлагаемых нами мужских консультациях надо было бы также сосредоточить профилактику и лечение специфических мужских заболеваний, консультации по вопросам половой жизни и сексуальной патологии в частности. В них же следует осуществлять профессиональную консультацию, систематически наблюдая за соответствием между профессией мужчин и состоянием их здоровья. При этом, конечно, важно, чтобы эти консультации взяли на учёт мужчин рабочего возраста своего микрорайона и систематически вызывали бы их повестками в порядке, схожем с диспансерным наблюдением.

У нас подавляющая часть (точнее – четыре пятых) врачей – женщины. Следовательно, здоровье наших мужчин в руках наших женщин. Этот факт даёт нам основание рассчитывать на полное понимание важности проблемы сохранения жизни мужчин. Ведь если сберечь мужчин, то все девушки нашли бы спутников своей жизни и многим молодым людям их бы даже не хватило.

Обобщающим показателем уровня смертности является средняя продолжительность жизни. Для мужчин она в нашей стране равна 66 годам, а для женщин – 74 годам: разница в 8 лет! В самом деле, какая же «пропасть разрыва легла между нами»...

Если бы нам удалось сократить разрыв с 8 до 4 лет, то это имело бы огромные благоприятные последствия для жизни всего нашего народа.

Мы стоим перед бурным вторжением техники во все области нашей жизни. Уже, наверное, извлечена из земных недр та железная руда, из которой сварят сталь и в 1969 и в 1970 гг. сделают сотни тысяч автомобилей, за руль которых сядут главным образом мужчины. Каждое применение технических средств таит в себе некоторые опасности, которые должны быть нейтрализованы техникой безопасности. Технику безопасности мы должны поднять на более высокий уровень. Это поможет нам сберечь мужчин в самый ценный период их жизни.

Для женщин и детей наша революция сделала колоссально много, обеспечив их особенным вниманием и заботой, что привело к огромному снижению детской и женской смертности.

Продолжительность жизни мужчин тоже значительно возросла, но она могла бы увеличиться ещё более. Поэтому мы имеем все основания сказать: «Женщины, берегите мужчин, ведь они не менее прекрасная половина рода человеческого… Давайте добьёмся, чтобы у нас встречались не только прабабушки, но и прадедушки, являющиеся в настоящее время большой редкостью».

Борис Урланис, доктор экономических наук
1968, № 30

Tuesday, April 18, 2023

Male–Female Fertility Differentials

Across 17 High-Income Countries: 
Insights From A New Data Resource

Christian DudelSebastian Klüsener
European Journal of Population volume 37, pages 417–441 (2021)Cite this article

Obtaining cross-country comparative perspectives on male fertility has long been difficult, as male fertility is usually less well registered than female fertility. Recent methodological advancements in imputing missing paternal ages at childbirth enable us to provide a new database on male fertility. This new resource covers more than 330 million live births and is based on a consistent and well-tested set of methods. These methods allow us to handle missing information on the paternal age, which is missing for roughly 10% of births. The data resource is made available in the Human Fertility Collection and allows for the first time a comparative perspective on male fertility in high-income countries using high-quality birth register data. We analyze trends in male–female fertility quantum and tempo differentials across 17 high-income countries, dating as back as far as the late 1960s for some countries, and with data available for the majority of countries from the 1980s onward. Using descriptive and counterfactual analysis methods, we find substantial variation both across countries and over time. Related to the quantum we demonstrate that disparities between male and female period fertility rates are driven to a large degree by the interplay of parental age and cohort size differences. For parental age differences at childbirth, we observe a development toward smaller disparities, except in Eastern Europe. This observation fits with expectations based on gender theories. However, variation across countries also seems to be driven by factors other than gender equality.

Monday, February 27, 2023

Son preference and birth spacing in Pakistan

February 27, 2023 Rashid Javed and Mazhar Mughal

Rashid Javed and Mazhar Mughal investigate how son preference affects birth spacing in Pakistan. The impact they find is strong, with several negative consequences on the demographic transition of the country and on the quality of life of its inhabitants, especially females.


Reducing gender bias and achieving gender equality is one of the 2030 Sustainable Development Goals (SDG 05). Son preference is a form of gender bias that persists in many parts of the developing world. The phenomenon has a number of economic, social and cultural causes. When insurance markets and social safety net programmes are missing, sons become a major economic asset, as they take up family businesses and cover parents’ old age needs. Conversely, daughters are considered an economic burden: parents must save for their dowry, and they leave home after their marriage to join their husband’s household. In Pakistan, for instance, women who bear sons often enjoy higher status at home and have more say in household decision-making, while women not bearing sons face social stigma (Javed and Mughal 2019).

Couples continue childbearing until they achieve the desired number of sons, and those with no sons at earlier birth orders go for the next child after a shorter interval (Milazzo, 2014). Shorter birth spacing leads to higher demands on the mother’s body and affects the nutrition and health of existing children (Kozuki & Walker, 2013). It is not by chance that the World Health Organization (WHO) recommends a minimum interval of 24 months between two consecutive births to reduce the risk of disease, malnutrition and mortality, particularly among girl children.

Pakistan’s case


In a recent study, we examined the son preference–birth spacing relationship in Pakistan, a populous, Muslim-majority country where son preference is widespread, even though, unlike in other son-preferring Asian countries such as China and India, sex-selective abortion is not commonly practiced. The reproductive effects of son preference are instead reflected in differential birth stopping and spacing patterns (Javed and Mughal 2020).

We employed data from three rounds of the Pakistan demographic and health survey (PDHS 1990-91, 2006-07 and 2012-13), restricting our sample to women who had completed their childbearing period with at least one child. Our outcome variable is the duration (in months) between parity n and subsequent parity n+1. For son preference, we used a number of indicators: at least one son at parity n, sex of the firstborn, number of sons at parity n, and overall sex ratio. We controlled for women’s individual characteristics (age, education, employment status, age difference with the husband, exposure to electronic media), husband’s education and household characteristics (family size, wealth, location and province of residence). As an estimation strategy, we employed an array of semi- parametric, non-parametric and parametric duration models.
We found a strong relationship between son preference and subsequent birth spacing. The effect is statistically significant at early birth orders but fades out beyond the third birth interval. Women with a son at birth order 1 are 10 % (1-0.90) to 13% (1-0.87) more likely to delay the second birth compared to women whose first child is a girl (Panel A). Likewise, women with at least one son out of the first two children are 10 % (1-0.90) to 15 %(1-0.85) more likely to delay the third birth compared to women without a son (Panel A). In the same vein, we find that women, whose two children are both boys, are 13 % (1-0.87) to 17% (1-0.83)% more likely to delay child births compared to women whose two children are girls (Panel B). We also found a role of son preference on the last birth interval. Women with sons only are 14-18% more likely to delay the birth of their last child than women with one or more daughters (results not shown).

We also found son preference to be associated with high-risk births. Women with at least one son are less likely to have subsequent birth spacing of less than 18 or 24 months (results not shown).

Another indication of this differential spacing is found in contraceptive prevalence, as women with one or more sons who do not report their fertility to be complete, are found to be more likely to use contraception than women with no sons (results not shown).

Conclusions


To summarize, we found conclusive evidence that Pakistani couples avoid contraception and shorten their subsequent birth interval to reach the desired number of sons. This manifestation of son preference has important consequences at national level. Connubial bliss may indeed require a son or two, but the disproportionate preference for sons that it entails affects the country’s demographic transition by hampering efforts to control rapid population growth, reduce high incidence of child and maternal mortality, and improve health outcomes. Pakistan has one of the highest child mortality rates in Asia (65 deaths per 1000 births), especially among girl children, which derives in part from the short birth intervals associated with excessive preference for boys. Maternal mortality is also high. Policy measures and awareness campaigns that promote gender equality in the country (and reduce son preference) can help lessen the occurrence of high-risk births, thereby not only lowering the risk to both mother and child’s life but also improving their health outcomes.

References

  • Javed, R., Mughal M. (2019) Have a Son, Gain a Voice: Son Preference and Female Participation in Household Decision Making, The Journal of Development Studies, 55(12), https://doi.org/10.1080/00220388.2018.1516871
  • Javed, R., Mughal M. (2020) “Preference for boys and length of birth intervals in Pakistan.” Research in Economics 74(2): 140-152. https://doi.org/10.1016/j.rie.2020.04.001
  • Kozuki, N., & Walker, N. (2013). Exploring the association between short/long preceding birth intervals and child mortality: Using reference birth interval children of the same mother as comparison. BMC Public Health, 13(SUPPL.3). https://doi.org/10.1186/1471-2458-13-S3-S6
  • Milazzo, A. (2014). Son Preference, Fertility and Family Structure: evidence from reproductive behavior among Nigerian women (English). World Bank Policy Research working paper no. WPS 6869, Washington, D.C.

Monday, February 20, 2023

should all men sit down to urinate?

The splashback scandal: should all men sit down to urinate?

Sitting down to pee allows the bladder to empty faster and more completely.

The Germans call them Sitzpinklers, and more and more men are now taking the weight off their feet in the bathroom. It could be good for their health – and help protect the family toothbrushes


In German, there’s a word for one. Of course there is. In German, there’s a word for everything. But this is an especially excellent word: Sitzpinkler. You can probably guess what it means even if you don’t speak German: a Sitzpinkler is a man who sits to pee.


We have German friends: Flora, Till, their two boys. Flora confirms that the males in the house are encouraged to sit at home, as is common throughout the country. Some German bathrooms have amusing signs reminding men to sit. There’s even a device called a WC-Geist – toilet ghost – that lives under the seat and, when the seat is lifted, orders you to sit down. You can get a WC-Geist with the voice of Angela Merkel. Germany is a brilliant country.

Wait, though. Because, Flora says, Sitzpinkler is used in a negative way to imply unmasculine behaviour. Something like “wuss” in English. In 2015, a court in Düsseldorf ruled in favour of a man’s right to urinate while standing when his landlord sought financial compensation for urine damage to the marble bathroom floor. Stand up for your rights, literally. Not all German men are happy to sit.

Not all British ones, either. There is no reliable data (come on, YouGov, get on it). A straw poll of my male friends, mostly in their 50s, reveals the majority – about 70% – to be standers. Their reasons: they’ve always stood; men stand, women sit; why would they; no, of course they don’t pee on the floor (we’ll come back to that – in short, they’re lying).
For men with lower urinary tract symptoms ‘the sitting voiding position is preferable’

I may need to change my friends. My editor Chris is half my age; this article stems from a conversation he had with his friends in the pub. Then he asked Twitter and got about 400 responses, with just over half saying they are sitters. Chris has better followers than I have friends, though he is a stander. I may need to change my editor.

There is a poll from 2020 showing that 70% of men in Japan sit. Five years previously the figure was 51%. It seems the world – Japan at least – is changing. To clarify, we are talking about inside the home. Out and about, where there are urinals and queues, it’s a whole different world and a whole different article. I should probably also say that though I’ve been talking about men, it applies to anyone with a penis.

Time to get personal: I am, I confess, a Sitzpinkler. No, not confess, I am proud to sitzpinkle. It wasn’t a sudden epiphany – a urethra moment, if you like – but things change as you age. Maybe your aim isn’t what it once was, flow rates decrease, bladders take longer to empty, you need more time, sitting is more comfortable and you can check Twitter while you’re at it (remember what happened once when you did that standing).

For some men it can also be healthier. In 2014, researchers from the department of urology at Leiden University Medical Center investigated how body position during urination affects “voiding time”, maximum flow rate and “post-void residual volume”. They concluded that sitting has a “more favourable urodynamic profile”, allowing the bladder to empty faster and more completely. For men with lower urinary tract symptoms (Luts), for example, caused by an enlarged prostate – “the sitting voiding position is preferable to the standing”.

We don’t have Luts, say my unreconstructed friends, our prostates are perfect. I think mine is OK, too. (Are we sure, though? We should get them checked.) There are other reasons to sit. Going back to that poor Düsseldorf landlord … Actually, no need, it’s hard to feel sorry for a Düsseldorf landlord with a marble floor and I can just look at my own bathroom floor. I have two sons who have been reluctant to adopt the Sitzpinkler approach. And the floor – not marble, admittedly, but fake wood laminate – is often disgusting. Awash. They piss all over it.

Boys will be boys; we’re grown men, say my friends. We may be getting on a bit but our aim is still true – we’re Robin Hood, snipers of the bathroom, the Jackal … Well, first of all, I don’t believe you. And second of all, even if you hit the bullseye every time, that’s not good enough. Once again we turn to science, this time to an American professor of mechanical engineering, Tadd Truscott. A while back, using a urination simulator and high-speed cameras, he and a colleague did an investigation into “splashback” caused by urination, which he presented at the 66th annual meeting of the American Physical Society’s Division of Fluid Dynamics in 2013.

If your toothbrush is 3 or 4 metres away you’re probably fine; if it’s just 1 or 2 metres, that’s not goodProf Tadd Truscott

Truscott now lives in Saudi Arabia and works at the King Abdullah University of Science and Technology, but I catch up with him by phone in a Japanese ski resort where – he admits – he has been investigating the fluid dynamics of a few sakes after a tough day on the slopes. Still, he manages to explain what happens when urine leaves the penile urethra. “A stream comes out but after between 3 and 6 inches it starts to break up into droplets, and that’s where most of the problem comes from. The droplets start to impinge on each other, then you get what we call satellite droplets and they splash off at very large angles and this is what causes it to splash on to your toothbrush …”

Yep, he said toothbrush, and maybe not just your toothbrush. It will depend on how big your bathroom is. “If your toothbrush is 3 or 4 metres away you’re probably fine; if it’s just 1 or 2 metres, that’s not good.”

That’s just from the falling stream. There’s also splashback from the wee hitting the surface of the water. “Water tends to have a large splash when droplets hit it from that height. That means a lot of splash can come out of the toilet. I was actually telling a friend tonight that when you pee into a toilet like that, you tend to pee on your toothbrush.”

Interesting topic for apres-ski chitchat. But this splash is ickier still, and possibly dangerous. “Pee in general is very sterile. It’s not really a big deal if it lands on your toothbrush and you brush your teeth then. But droplets are quite capable of harbouring bacteria, and in the toilet this is a problem if you’ve just used the restroom for something else. There can be faeces in there – urea is a wonderful harbinger of E coli growth – so later in the day it might not be safe to use your toothbrush.”

Stop saying toothbrush! Anyway, surely that’s enough to convert any remaining sceptics. For any splashback deniers or cavemen, I’ve got great role models too. Larry David, for starters. “It’s more comfortable when you get up in the middle of the night; you don’t have to turn the light on and wake up, and you get to read,” he says, in episode four of season four of Curb Your Enthusiasm. Lionel Messi, probably the greatest footballer of all time, admitted to sitting to pee on a Uruguayan TV show called Por La Camiseta (For the T-shirt). Messi by name, not so in the bathroom. Still not macho enough for you? Well, guess who he was talking to, also a confirmed Sitzpinkler (there is no Spanish word, we’ll have to stick to German). Only Luis Suárez – not only a brilliant football player but also a cannibal.

Speaking of cannibals and cavemen, I’m wondering what our ancestors and nearest relatives did and do. Ben Garrod, a professor of evolutionary biology at the University of East Anglia and a primate expert, tells me: “Gorillas and chimps just pee where they are. They might be walking through the forest and have a bit of a pee, they might be sitting in a tree eating figs and they’ll just pee beneath them and woe betide anyone beneath – I’ve been on the receiving end of that. We’re the only primate that is bipedal so we’re in a bit of a brave new world when it comes to peeing.”

Great apes don’t seem to mark territory. We are not olfactory-based like dogs or cats, which scent-mark. “That’s a sort of urban myth, that men pee standing up so they can pee higher and it’s all a bit of an evolutionary pissing contest,” says Garrod. “Sounds nice, sounds plausible, but there’s no evidence for it whatsoever.”

It’s thought that one of the reasons for humans becoming upright was to see further across the savannah. I wonder if standing to pee could be useful in spotting predators, and if squatting might make us more vulnerable. “I guess if I stand up while I pee I’ve got more of a chance of spotting a sabre-toothed cat running towards me, or someone from a different community who might wish me harm,” Garrod concedes. Again, sounds nice but no evidence. “It might be a nice addendum to my evolutionary journey but it hasn’t driven my evolution as a species.”

From an evolutionary point of view, then, it doesn’t really matter how we pee. Garrod has worked with many tribes and communities around the world. “And most of us … I don’t usually make a conscious effort to watch other people pee, but working in forests with other blokes you often see people having a quick wee … usually it’s standing up. As far as I know there aren’t any massive cultural differences.”

He’s talking about in the forest, away from rules and etiquette and porcelain, that’s the baseline. Of course I stand up in the forest, too. And if there’s a cliff, I’ll piss over that, while pummelling my chest. What does Prof Garrod do at home in Norwich, though? “I am a stander,” he says, almost apologetically. “Though I am also a runner. Occasionally, with very tired legs, I will indulge in a sit …” Too bad. I was going to ask him to be my friend, to replace some of the recently dumped.

Back to Tadd Truscott (no toothbrush talk, promise) – surely he sits? “I do, unless it’s a particularly gross bathroom, then I’m not going to sit on the toilet.” He has two boys and two girls: “The whole house sits down to pee.” He even has advice on how men should do it. “You can sort of aim for the side. If you don’t hear much it’s probably a stream, if it’s a little noisier it’s probably droplets and that’s when things get worse. But remember, by sitting you’re protecting the whole space with your bottom.”

Happy days, though doesn’t that mean droplets on your bum? “It’s good to bathe every day,” he adds, helpfully. Thanks, Tadd, we can be friends.

He is also currently skiing in Japan, remember. “They have these wonderful toilets with all the sprays and things for your rear end. I think men probably sit here because it’s comfortable. Right now it’s cold, you come in and the seat’s heated! OK! I’m going to sit down.”

Sounds lovely, and I’m thinking it may be the way to solve my own bathroom horror show: carrot, not stick. A lovely heated seat on a cold day – that’s got to be a better way than being shouted at by the ghost of Angela Merkel.

America's Most Admired Men

Former and current presidents are the people most commonly named by Americans as the men they most admire. Among those being very consistently ranked in a Gallup poll that has been running since 1946 is Jimmy Carter. The 39th president of the United States announced Saturday through his foundation that he had entered hospice care. Despite serving just one term from 1977 to 1981, Carter has remained one of the country's most beloved presidents and has been revered for his long-standing commitments to NGO Habitat for Humanity and teaching Sunday school in his hometown of Plains, Georgia. The former Navy lieutenant and peanut farmer became a state senator and the governor of Georgia before running for the presidency as a Democrat. He was awarded the Nobel Peace Price in 2002.

The only other president found in Gallup's top 10 more often than Carter is the Republican who challenged and beat him in his reelection campaign: Ronald Reagan. He was in the top 10 a total of 31 times until his death in 2004 (the poll only lists living persons). In first position of the all-time most admired poll is a man who is neither a president nor a politician: Reverend Billy Graham, a Southern Baptist evangelical minister who became well-known through his sermons being broadcast on radio and TV. While Reagan and Carter only rose to national prominence in the 1970s and 1980s, Graham was already famous internationally by the 1940s and lived to almost 100 years before dying in 2018, giving him enough time to be mentioned among the top 10 of America's most admired men 61 times.

In a similar poll by YouGov, Jimmy Carter was still listed as the third most admired man in the U.S. behind fellow former Presidents Barack Obama and Donald Trump the last time a country-specific version was published in 2020.America's Most Admired Men
Картер 1й из живых

Sunday, January 8, 2023

How Long Is Compulsory Military Service?

Taiwan is extending its mandatory military service in 2024 from four months to one year, as tensions continue to rise with China. Taiwanese President Tsai Ing-wen announced early last week that conscription will include more intense training so that the country is better equipped should China invade. Conscripts will also receive a higher monthly stipend, increasing from NT$6,500 (US$211) to NT$26,307 (US$856), which is roughly akin to minimum wage. In a poll conducted by the Taiwanese Public Opinion Foundation in December, 73 percent of respondents supported the move.

Fewer than 30 countries worldwide still require whole age cohorts to complete military service. But among those that do, four months is a relatively short period of time. Taiwan had originally stipulated two years of service, however this was gradually cut down to four months as of 2013, with the intention of relying more heavily on volunteer forces instead. As our chart shows, North Korea stands at the other end of the spectrum in terms of duration, although media reports vary. The Guardian reported 10 years for men and 7 for women as of 2015, while the Indian Express puts the figures closer to 8 years for men and 5 for women. According to media reports, those in the elite class are usually able to avoid conscription.

Israel too has a fairly long and rigorous conscription, albeit far shorter than North Korea. Most Israeli men over the age of 18 who are Jewish, Druze or Circassian must serve in the Israel Defense Forces for 32 months and women for 24 months, according to the IDF. Meanwhile, in Egypt, conscription is compulsory for men aged between 18 and 30 for up to 36 months. As with several countries on the chart, service can be pushed back until students finish their studies and there are a number of clauses that exempt men from joining the forces, for example, if they are the only son/sole breadwinner of the family.

South Korea, which is technically still at war with North Korea, also has mandatory conscription for all able-bodied men for a period of 18 months to 21 months, depending on the posting. Some athletes and classical artists are allowed to postpone or forgo the draft entirely. The K-Pop group BTS brought the issue to light recently, with debate over whether they could be excused from service. The decision was made that men can delay their military draft until the age of 28 and those working in the entertainment industry are now allowed to postpone their service until they turn 30. The oldest member of BTS, Jin, has now started his mandatory draft.

There’s huge variation in the rules for how long citizens must join the military in the countries that still have mandatory conscription as well as possible reasons for exemptions. For instance, in Turkey, new laws introduced in 2019 decreed that instead of the mandatory six months of military training, conscripts could do one month and buy-out the remaining five months for a fee of 31,000 Turkish Lira ($1,651), according to the Australian Government’s Department of Foreign Affairs and Trade. Conscripts' levels of higher education can also impact the type and length of their post.

Punishments for not enlisting vary too. In Eritrea, anyone evading or attempting to evade compulsory military service could face imprisonment of one to three years. According to DFAT, this could increase to 7-10 years imprisonment in a time of emergency or war.

While most countries with conscription only draft men, a handful of countries including North Korea, Israel, Norway, Sweden, Eritrea and Mozambique conscript women too.How Long Is Compulsory Military Service?
Интересно: как в КНДР половая жизнь устроена?

Tuesday, January 3, 2023

Quantifying the contribution of smoking to regional mortality disparities in Germany

a cross-sectional study


Pavel Grigoriev, Sebastian Klüsener, Alyson van Raalte
Correspondence to Dr Pavel Grigoriev; Pavel.Grigoriev@bib.bund.de

Objectives Substantial regional variation in smoking behaviour in Germany has been well documented. However, little is known about how these regional differences in smoking affect regional mortality disparities. We aim to assess the contribution of smoking to regional mortality differentials in Germany over the last four decades.

Design A cross-sectional study using official cause-specific mortality data by German Federal State aggregated into five macro-regions: East, North, South, West-I and West-II.

Participants The entire population of Germany stratified by sex, age and region during 1980–2019.

Main outcome measures Smoking-attributable fraction estimated using the Preston-Glei-Wilmoth method; life expectancy at birth before and after the elimination of smoking-attributable deaths.

Results In all macro-regions, the burden of past smoking has been declining among men but growing rapidly among women. The hypothetical removal of smoking-attributable deaths would eliminate roughly half of the contemporary advantage in life expectancy of the vanguard region South over the other macro-regions, apart from the East. In the latter, smoking only explains around a quarter (0.5 years) of the 2-year difference in male life expectancy compared with the South observed in 2019. Among women, eliminating smoking-attributable deaths would put the East in a more disadvantageous position compared with the South as well as the other macro-regions.


Conclusion While regional differences in smoking histories explain large parts of the regional disparities in male mortality, they are playing an increasingly important role for female mortality trends and differentials. Health policies aiming at reducing regional inequalities should account for regional differences in past smoking behaviour.

Data are available upon reasonable request.

This is an open access article distributed in accordance with the Creative Commons Attribution Non Commercial (CC BY-NC 4.0) license, which permits others to distribute, remix, adapt, build upon this work non-commercially, and license their derivative works on different terms, provided the original work is properly cited, appropriate credit is given, any changes made indicated, and the use is non-commercial. See: http://creativecommons.org/licenses/by-nc/4.0/.

http://dx.doi.org/10.1136/bmjopen-2022-064249 [приложение к предыдущему, вопросы остаются]

lung cancer mortality


я вижу половые различия, до своего рака ещё нужно дожить

а вы?
ап чом спич

Sunday, January 1, 2023

The Most Desired Christmas Gifts in The U.S.

While it may not seem like the most romantic option, the useful gift of money is the most desired Christmas present in the United States this year. According to the latest data from Statista’s Global Consumer Survey (Christmas and Holiday Season: U.S.), when asked which gifts U.S. adults would personally most like to receive this year, 36 percent of men and 46 percent of women said cash or bank transfers. For both groups, vouchers came in second position, followed by clothing, textiles or shoes in third. Respondents could choose multiple options in the poll.

When looking at a breakdown of the data for males and females, however, while there is a fair bit of overlap, some slight differences do emerge. As our chart shows, smartphones, tablets and accessories were a fairly popular choice for both men and women, being selected by 22 percent and 23 percent of the groups, respectively. Women showed slightly more interest in travel-related gifts (19 percent versus men at 14 percent) as well as event tickets (19 percent versus men at 12 percent). Out of the polled options, ‘decoration articles’ were among the lowest scoring gifts, only desired by 7 percent of female respondents and 6 percent of men.The Most Desired Christmas Gifts in The U.S.

Monday, December 19, 2022

Where Paternity Leave Is (Not) Utilized

The news of Finland's defense minister, Antti Kaikkonen, taking two months of paternity leave has brought the topic of male parental leave allowances utilization into the spotlight. Kaikkonen announced the birth of his second child in July, and commenting on his decision to take time off in early 2023, he wrote on Twitter: “Children are only small for a moment, and I want to remember it in more ways than just photographs".

As this chart using OECD data shows, Kaikkonen is far from an exception in Finland, where roughly 80 percent of live births lead to some level of paternity leave usage. While many countries by now offer a considerable length of time off for fathers, the rate at which these offers are being taken advantage of still varies greatly from country to country.

Of the 17 countries analyzed, Luxembourg had the highest rate of uptake at 95 out of 100 live births. At the other end of the scale, fathers in countries such as Austria and Hungary have a lot of catching up to do, with rates of 16 and 23, respectively.Where Paternity Leave Is (Not) Utilized

Saturday, December 10, 2022

Testosterone and partnering are linked

via relationship status for women and ‘relationship orientation’ for men


Cross-cultural evidence links pair bonding and testosterone (T). We investigated what factors account for this link, how casual relationships are implicated, and whether gender/sex moderates these patterns in a North American sample. We gathered saliva samples for radioimmunoassay of T and self-report data on background, health, and social/relational variables from 115 women and 120 men to test our predictions, most of which were supported. Our results show that singles have higher T than long-term (LT) partnered individuals, and that casual relationships without serious romantic commitment are more like singlehood for men and LT relationships for women–in terms of T. We were also able to demonstrate what factors mediate the association between partnering and T: in women, frequency of partnered sexual activity mediated the effect in men, interest in more/new partners mediated the effect. This supported our prediction of relationship status interpretations in women, but relationship orientation in men. Results replicated past findings that neither sexual desire nor extrapair sexuality underlie the T-partnering link. We were able to rule out a large number of viable alternative explanations ranging from the lifestyle (e.g., sleep) to the social (e.g., social support). Our data thus demonstrate pattern and mediators for the development of T-pair bonding associations, and emphasize the importance of neither under- nor overstating the importance of gender/sex in research about the evolution of intimacy.

Friday, November 4, 2022

The educational hypogamy puzzle in India

October 31, 2022 Koyel Sarkar

Status exchange is a leading factor behind the rising share of educational hypogamy marriages in India (women marrying less educated men), says Koyel Sarkar. Lower caste women aspire to upward mobility by caste, while higher caste women look for husbands with good employment status. Men with these desirable characteristics may “qualify for the job”, even if their educational level is low.


Background


As the gender educational gap shrinks, homogamy, i.e. a woman marrying an equally educated husband, eventually takes over hypergamy (a woman marrying a higher educated husband) (Kalmijn and Flap 2001). Hypogamy (marrying a less educated husband), on the other hand, is a distinguishing feature of western societies, where the gender gaps have reversed and women have become more educated than men (Van Bavel 2012).

In India, female education has increased at a faster rate than men’s over recent decades: according to DHS estimates (2019–21), “no education” among women decreased from more than 54% in 1971 to less than 12% in 2003, and in the same period “secondary education” increased from 26% to 76%. However, women are still less educated than men: literacy rates, for instance, were 71.5% for females and 84.3% for males in the 2019–21 DHS Indian survey.

It is therefore surprising to observe that hypogamy has increased from 5% to 35% over four decades of marriage cohorts (Figure 1). How can this be explained?

Theoretical background


Relatively little is known about couple formation in India, and the question arises as to whether the “status-exchange” theory applies. According to this theory, individuals lacking a characteristic that they consider desirable tend to marry partners with precisely that characteristic – and as this quest for “improvement through marriage” applies to both genders, status exchange takes place, each partner bringing to the couple something that the other partner lacks and deems valuable (Davis 1941). In India, increasing educational hypogamy, particularly among the lower caste groups, and an overall rise in caste exogamy (Ahuja 2016; Sarkar and Rizzi 2020; Sarkar 2022) suggest that status exchange mechanisms could be the potential driver.

Caste, education and occupation


Caste is a unique, very ancient feature of the Indian society. Although formally abolished in 1947, in practice it continues to operate, especially in rural settings and for certain social practices, such as marriage. The system is very complex, with thousands of castes and sub-castes, characterized by endogamy and social hierarchy (Ahuja 2016).

For our purposes, let us just focus on four large groups:

1) general castes, i.e. all those not listed below. These are relatively affluent and at the top of this reduced hierarchy
2) the less privileged caste groups, which can be broken down into three categories, in decreasing hierarchical order:
2.a) other backward classes (OBC),
2.b) scheduled castes (SC), and
2.c) scheduled tribes (ST).

Female education in India seems to play a peculiar role. It is not of great help to women in the labour market, where their participation is limited and irregular, even when they do have some education (Chatterjee 2018). Instead, in the marriage market, educated women are preferred because of their greater abilities in caring for children and managing household health. Thus, trading higher educational status for upward caste mobility seems to be a profitable strategy, especially for women from lower castes. Women who belong to higher caste groups, on the other hand, have little incentive to marry a higher caste husband: in their case, a better-employed or a financially secure husband may be more attractive.

For men, given that the caste system is traditionally patrilineal, a highly educated wife is desirable, irrespective of her caste
Empirical data indeed show a positive correlation across marriage cohorts: greater proportions of women marrying low-educated husbands coincides with husbands belonging to higher castes, (Figure 2, left panel) and holding more prestigious (and better paid) jobs (Figure 2, right panel).

The general preference for all education-caste-occupation subgroups is to marry within the same caste. However, the odds of marrying a higher-caste husband are highest for educational hypogamy (Figure 3; ORs: 1.3**, secondary axis). Additionally, when all husband-wife caste pairs are considered for each caste-wise assorted group, the highest odds are for caste hypergamous pairs: among the ST (ORs: 2.5**), SC (ORs: 2.0**), and OBC (ORs: 2.0***), women “marrying up” to general caste husbands. In addition, higher caste women who “marry down” both by education and caste are actually “marrying up” by occupation, when the pairs are further decomposed by partner’s occupation (Sarkar 2022).

Conclusions


Socio-economic status exchange by caste, education, and occupation seems to be at work in the Indian marriage market, and it may explain the increase in educational hypogamy. Education-caste exchange applies to lower caste women while education-occupation exchange applies to higher caste women. As such, the social and/or economic incentives are specific to the caste rank to which the women belong.

Status exchanges in Indian marriages are blurring the traditionally rigid caste boundaries, thanks to women’s higher educational achievements. Unfortunately, however, the factors behind these exchanges run counter to the expectation that education leads to empowerment. Despite often being better educated than their partners, Indian women seek economic advantages through their prospective husbands rather than engaging in the labor market themselves. This is a consequence of the conservative norms that discourage Indian women from working. Secondly, the desire for upward social mobility by caste shows that social inequalities are not necessarily diminishing, and that they still play an important part in the workings of the marriage market.
 

References

  • Ahuja, A. and Ostermann, S.L. (2016). Crossing caste boundaries in the modern Indian marriage market. Studies in Comparative International Development. 51(3): 365–387. Doi:10.1007/s12116-015-9178-2.
  • Chatterjee, E., Desai, S., and Vanneman, R. (2018). Indian paradox: Rising education, declining women’s employment. Demographic Research 38(31): 855–871.doi:10.4054/DemRes.2018.38.31.
  • Davis, K. (1941). Intermarriage in caste societies. American Anthropologist 43(3): 376–395. Doi:10.1525/aa.1941.43.3.02a00030.
  • Kalmijn, M. and Flap, H. (2001). Assortative meeting and mating: Unintended consequences of organized settings for partner choices. Social Forces 79(4): 1289–1312. Doi:10.1353/sof.2001.0044.
  • Sarkar, K. and Rizzi, E.L. (2020). Love marriage in India. Démographie et sociétés. Louvain la Neuve, Université Catholique de Louvain. (Document de travail 14).
  • Sarkar, K. (2022). Can status exchanges explain educational hypogamy in India?. Demographic Research, 46(28), 809-848. Doi:10.4054/DemRes.2022.46.28.Van Bavel, J. (2012). The reversal of gender inequality in education, union formation and fertility in Europe. Vienna Yearbook of Population Research 10: 127–154. doi:10.1553/populationyearbook2012s127.

Friday, October 28, 2022

gender aspirations of mistakes

Combotrans

У женщин и мужчин разные представления о том, к чьим ошибкам руководство относится более снисходительно


Мужчины уверены, что руководители чаще прощают ошибки женщинам. Представительницы слабого пола придерживаются противоположного мнения. В опросе сервиса по поиску высокооплачиваемой работы SuperJob приняли участие 1600 представителей экономически активного населения, работающего в смешанных коллективах, и 500 руководителей из всех округов страны.

Кому руководители чаще прощают ошибки: женщинам или мужчинам? И зависит ли это от пола самого руководителя? К счастью, и большинство сотрудников, и большинство руководителей уверяет, что отношение к недоработкам представителей обоих полов одинаково строгое. Однако все же есть те, кто подтверждает гендерную дискриминацию в отношениях начальства и подчиненных.

Так, почти каждый пятый мужчина (18%) считает, что его руководитель более снисходителен к ошибкам женщин, причем этой точки зрения чаще придерживаются как те, кто работает под начальством мужчины, так и те, кем руководят женщины.

10% женщин уверены, что их руководитель чаще прощает ошибки мужчинам, 8% — женщинам. Те сотрудницы, что работают под руководством женщин, чаще говорят о лояльности начальства к мужчинам, а среди работниц, трудящихся под руководством мужчин, примерно поровну как тех, кто говорит о большей терпимости к мужчинам, так и тех, кто видит снисхождение к женщинам.

Что касается самих руководителей смешанных коллективов, то в большей снисходительности к недоработкам женщин мужчины признаются гораздо чаще. Начальницы же чуть чаще прощают подчиненных мужчин.

Место проведения опроса: Россия, все округа
Населенных пунктов: 391
Время проведения: 21—27 октября 2022 года
Исследуемая совокупность: экономически активное население России старше 18 лет, работающее в смешанных коллективах
Размер выборки: 1600 респондентов

Подробнее


Wednesday, October 12, 2022

language.ru

Birch bark letter N 955

Ругаться матом на подчиненных стали реже


В рабочих коллективах 7 из 10 россиян не могут обойтись без использования ненормативной лексики. Сервис по поиску высокооплачиваемой работы SuperJob выяснил, как часто «местные идиоматические выражения» заменяют бизнес-лексику. В опросе приняли участие работающие экономически активные граждане из всех округов страны.

На рабочих совещания 46% россиян используется ненормативная лексика: 15% слышат ее постоянно, 31% — иногда. Крепкие слова от начальства слышит практически каждый второй: 13% — регулярно, 32% — время от времени. Впрочем, по сравнению с 2020 годом руководители стали реже использовать ненормативную лексику в общении с подчиненными. Настоящий же кладезь нецензурной брани — общение между коллегами: каждый пятый опрошенный слышит ее постоянно (22%), каждый второй (49%) — иногда.

Ненормативная лексика больше распространена в мужских коллективах. «Да это нормально, ничего страшного в этом нет»; «Это упрощает общение, понимание и отсеивает слабых духом», — считают мужчины.

Место проведения опроса: Россия, все округа
Населенных пунктов: 374
Время проведения: 6—11 октября 2022 года
Исследуемая совокупность: экономически активное население России старше 18 лет, имеющее постоянную работу
Размер выборки: 1600 респондентов


Подробнее

Friday, September 9, 2022

Wednesday, August 31, 2022

Sex-selective abortion in India: an ongoing problem


In India, the percentage of male births has increased since the mid-1980s. Claus Pörtner ties the continuously growing use of prenatal sex selection to India’s falling fertility among highly-educated women. He shows how sex selection substantially lengthens birth intervals, which, in turn, is responsible for a significant downward bias in the total fertility rate compared to predicted cohort fertility. Less-educated women still have relatively high fertility and short birth intervals when they have no sons, negatively affecting girls’ survival chances.


With the introduction of ultrasound in the mid-1980s, use of sex-selective abortion spread rapidly in India, as shown by the steadily increasing percentage of boys in Figure 1. However, access to pre-natal sex determination does not necessarily lead to sex selection. Rather, in India, the practice is driven by the combination of declining fertility (also shown in Figure 1) and the particular Hindu preference for a son. However, once that son is secured, there is no clear son preference for subsequent births (Jayachandran, 2017; Pörtner, 2015). If a family is willing to have up to six children, there is a 99% probability of achieving the goal of one son. But if the desire is for one son and a maximum of two children, about 25 percent of families must use sex selection to achieve both targets.

Three critical aspects


As striking as these overall numbers are, they obscure three critical aspects of the changes in India:
• first, the massive differences in use of sex-selective abortion across education levels that followed the availability of pre-natal sex determination;
• second, significant differences in use of sex selection by parity;
• third, the increase in birth intervals brought about by sex selection, which, in turn, has led to substantial overestimation of the rate of fertility decline in India.

In a recent paper, I use data from India from 1972 to 2016 to examine how fertility, sex ratio, and birth spacing changed by education level with the spread of sex selection (Pörtner, 2022). The data comes from the first four National Family and Health Surveys. I focus on Hindu women because Hindus constitute about 80% of India’s population and have shown stronger son preference and higher use of sex selection than Muslims.

To illustrate some of the results, Figures 2 to 4 show the probability of a third birth, the percentage of boys among third births, and the 75th percentile birth intervals after the second child for rural women with no education and urban women with 12 or more years of education. These two groups represent the extremes in India and exemplify the divergent behaviors in response to son preference. Currently, the two groups constitute approximately 15% and 20% of the female Hindu population, respectively. The graphs for the other groups are available in Pörtner (2022). The analyses cover four periods: 1972–1984, 1985–1994, 1995–2004, and 2005–2016.

Fertility is falling, but son preference still affects the likelihood of a subsequent birth


First, consistent with declining overall fertility, the likelihood of a subsequent birth has decreased over time for all parities. However, the probability of having another child remained higher for women without sons than for women with one or more sons, showing that son preference remains strong in India.

Consistent with these general trends, both groups of women shown in Figure 2 are less likely to have a third child, but are more likely to do so if they already have two daughters than if they have one or two sons. However, more than 75% of rural women with no education still have a third birth whatever the sex of their prior children. This contrasts with highly educated urban women, among whom less than 20% have a third child if they already have a boy, while more than 50% have a third child if they have only daughters.

The use of sex selection is not declining


Second, despite predictions that sex selection will eventually decline in India, there is no clear evidence to support this idea. The most likely users of sex selection—more highly educated women with no sons—continue to show substantial male-biased births. More worryingly, increasingly male-biased births among less-educated mothers suggest that sex selection is spreading as the fertility of this group declines.

The highly educated urban women in Figure 3 illustrate how the percentage of boys at birth increased for mothers with no sons as access to sex selection spread. For this group, we are fast approaching a situation where 80% of third births are boys, reflecting the fact that, as desired fertility declines, more and more women use sex selection to secure a boy before they stop childbearing.
The situation is very different for rural women with no education. Their fertility is still high, and the chance of having a son without sex selection is correspondingly high. Hence, there is still no evidence of sex selection for this group, although this might change in the future as fertility declines further.

Modest increases in birth intervals, except with sex selection


Based on the percentage of boys at birth, we can split Hindu births into two broad groups. The first group, without evidence of sex selection, includes births to highly educated mothers with at least one son and all less-educated mothers whether or not they have a son. The second, with evidence of sex selection, includes births to more highly educated mothers with no sons.
For births where sex selection is not used, median birth intervals have increased relatively little—by only three to six months over the four decades—compared to around 3.5 months per decadein other countries with declining fertility (Casterline & Odden, 2016). Despite the absence of sex selection, there is still strong evidence of son preference, as illustrated by the shorter birth intervals when rural women with no education have only daughters than when they have at least one son.

What is more, a remarkably high proportion of birth intervals are still very short. Except among the most educated women, 25% or more have their second child within 24 months of their first, and a similar proportion have their third child within 24 months of their second. These intervals are substantially below the WHO recommended 24 months between pregnancies, resulting in significantly higher child mortality risk, especially for less-educated mothers (Bocquier et al., 2021; Pörtner, 2022).

The story is very different when sex selection is used. Highly educated mothers with no sons have substantial lengthening of birth intervals, further evidence of very significant use of sex-selective abortion. For example, among highly educated urban mothers with only daughters, the 75th percentile birth interval length is now nearly 70 months, a 21-month increase over four decades. Strikingly, more than 70% of this increase occurred in the first decade after the introduction of sex selection. Therefore, some mothers with no sons now have longer birth intervals than those with sons, reversing India’s traditional spacing pattern.

Spread of sex selection led to overestimation of fertility decline


One of the unappreciated effects of the rapid expansion of sex selection and the associated increases in birth intervals is that it makes the TFR a downward-biased estimate of cohort fertility (Bongaarts, 1999; Hotz et al., 1997; Nı́ Bhrolcháin, 2011). That is precisely what appears to have happened in India. The period fertility rate substantially overestimated the speed of cohort fertility decline in the 1990s and early 2000s, as spacing increased with the spread of sex selection. For example, the TFR for urban women with 12 or more years of education went from 2.1 to around 1.6 with the introduction of ultrasound sex determination, but predicted cohort fertility declined only from 2.3 to 2.1. Although the two fertility measures have recently partly converged, predicted cohort fertility is still 10-20% higher than the period fertility rate.

These results paint a less rosy picture of India’s prospects for a continued reduction in population growth than generally accepted. With predicted cohort fertility still substantially higher than the period fertility rate, India’s TFR will likely stabilize or even increase as birth intervals lengthen more slowly. Perversely, the more successful our attempts at combatting sex selection, the greater the likelihood of an increase in the TFR. This increase stems partly from the shortening of birth intervals if sex-selective abortions are unavailable and partly from families needing more births to have at least one son.

References

Thursday, August 11, 2022

change in the US male life expectancy