
Showing posts with label продолжительность жизни. Show all posts
Showing posts with label продолжительность жизни. Show all posts
Saturday, December 14, 2024

Tuesday, November 12, 2024
life
 |
| тыцабельно |
На какие жизненные траектории ориентируются россияне
По данным исследования, самые главные вещи, к которым хотели бы прийти россияне, - это создание счастливой семьи (на это в той или иной степени ориентируется 97.2% россиян) воспитание хороших детей (важно для 97% опрошенных), и быть самому себе хозяином (93.2% - и, кстати, довольно неожиданно с учётом бытующего мнения о любви нашего народа к "жесткой руке")
Меньше всего россияне стремятся к власти (у 72.5% этого нет и не было в планах), известности (она не нужна 71.5% опрошенных) и высокому положению в обществе (без него 56.8% чувствуют себя прекрасно).
Довольно противоречивой нашим соотечественникам кажется и идея создания собственного бизнеса: тут 52% за и почти 48% - против
Tuesday, October 1, 2024
healthy nations
 Самые здоровые (и нездоровые) страны мира

Из крупных (с точки зрения экономики и общего веса в мире) стран самое здоровье население оказалось Сингапуре! Следом (с небольшим отставанием) идёт Япония, за ней (уже с отставанием побольше) - Швейцария, Испания и Южная Корея.
Самыми нездоровыми оказались ЮАР, Индия и Индонезия.
Мы (вместе с Мексикой: у нас идеально одинаковые баллы!) оказались ровно на нуле этого рейтинга - здоровье нашего населения находится на среднемировом уровне
Monday, August 19, 2024
Measuring populaton health in Moldova
Measuring populaton health in Moldova: health expectancies
Cristna Avram, Olga Gagauz Charles University, Faculty of Science, Department of Demography and Geodemography, Center for Demographic Research, Natonal Insttute for Economic Research, Academy of Sciences of Moldova
Health measures are decisive for the development and implementaton of populaton health policies. Monitoring health indicators can lead to improvements in health and decrease in the inequalites among subpopulatons. The life expectancy at birth for the Moldovan populaton did not increase considerably during the last decades, due to the social and economic crisis which led to high mortality and poor health. In Moldova, no aggregated health indicators are utlized for health monitoring. Therefore, the authors calculated health indicators to assess the populaton health and argue their importance. Mortality and subjectve data on self-per- ceived health and self-rated morbidity from the Household Budget Survey was used for constructng period morbidity-mortality tables. Thus, the authors applied Sullivan’s method to calculate the life expectancy in very good/good/fair health and the life expec- tancy without chronic morbidity for the period 2006–2015. The life expectancies in very good/good/fair health showed a compres- sion of morbidity in the older ages for both sexes, and for rural and urban types of residence. The life expectancies without chronic morbidity for males and for urban dwellers demonstrated an expansion of morbidity. Although the life expectancy is slowly increas- ing, the trends in populaton health are contradictory, depending on the applied measures. The health expectancy indicators, based on self-perceived health, depict the actual situaton in the populaton health. These indicators are becoming more essental with the ageing process and can be used for the tailoring of social and health policies and services to the real needs of the populaton.
Tuesday, July 30, 2024
sports

Сколько лет жизни прибавляет регулярная физическая активность
Больше всего жизни прибавляет бег: один час бега в неделю добавляет в среднем 3.67 года жизни! Второй час бега в неделю прибавит уже заметно меньше: 0.75 года, третий - ещё 0.45. Но в сумме это почти пять лет всего за 3 часа в неделю!
Тут, правда, речь идёт о быстром беге: на скорости 10 миль в час - это 16 км/ч. Более расслабленный без на скорости порядка 10 км/ч занял четвёртое место: 3.27 года за один час в неделю и чуть меньше 4.5 лет за три.
"Серебро" получил велосипед: 3.45 года за один час в неделю и 4.5 - за три! А "бронзу", неожиданно, rope jumping (прыжки с высоты на верёвки - по сути, "тарзанка")
Больше всего жизни прибавляет бег: один час бега в неделю добавляет в среднем 3.67 года жизни! Второй час бега в неделю прибавит уже заметно меньше: 0.75 года, третий - ещё 0.45. Но в сумме это почти пять лет всего за 3 часа в неделю!
Тут, правда, речь идёт о быстром беге: на скорости 10 миль в час - это 16 км/ч. Более расслабленный без на скорости порядка 10 км/ч занял четвёртое место: 3.27 года за один час в неделю и чуть меньше 4.5 лет за три.
"Серебро" получил велосипед: 3.45 года за один час в неделю и 4.5 - за три! А "бронзу", неожиданно, rope jumping (прыжки с высоты на верёвки - по сути, "тарзанка").
Thursday, May 23, 2024
life expectancy

Продолжительность жизни в Германии оказалась самой низкой в Западной Европе
Такие данные опубликовал Евростат. По его подсчётам, средняя продолжительность жизни в ФРГ — 81,2 года. Это меньше, чем во всех других странах Западной Европы и Скандинавии. Ещё ниже этот показатель только у стран бывшего соцлагеря. По данным немецких властей, сейчас Германия отстаёт по уровню жизни от среднего показателя Западной Европы на 1,7 года. Четверть века назад этот разрыв составлял 0,7 года.
По словам врачей, основная причина более ранней смертности в Германии — сердечно-сосудистые заболевания. Их вызывает высокий уровень курения и потребления алкоголя в стране, а также недостаточно здоровое питание.
Tuesday, April 16, 2024
LEX during covid pandemic
COVID-19 exacerbated inequalities in life expectancy in Den mark
April 15, 2024 Cosmo Strozza, Serena Vigezzi, Julia Callaway and José Manuel Aburto
Social inequalities in mortality expanded during the COVID-19 pandemic in Denmark. Cosmo Strozza, Serena Vigezzi, Julia Callaway, and José Manuel Aburto quantified life expectancy changes in 2020 and 2021 and underlying causes of death. COVID-19, as well as other causes, contributed to these changes.
The COVID-19 pandemic disrupted life expectancy trends in most high-income countries. In Denmark, while overall life expectancy returned to 2019 levels after the initial two pandemic years (2020 and 2021), this pattern was not observed across all the socioeconomic strata of the Danish population. Indeed, contrary to what many people outside the Nordic countries believe, large social inequalities in life expectancy persist in the Nordic countries (Brønnum-Hansen et al. 2021). In a recent publication (Strozza et al. 2024), using Danish registry data from 2014 to 2021 for all individuals aged 30 years and over, we investigated whether the COVID-19 pandemic magnified social inequalities in life expectancy in Denmark, and examined what causes of death contributed most to the observed changes.
Life expectancy changes during the COVID-19 pandemic
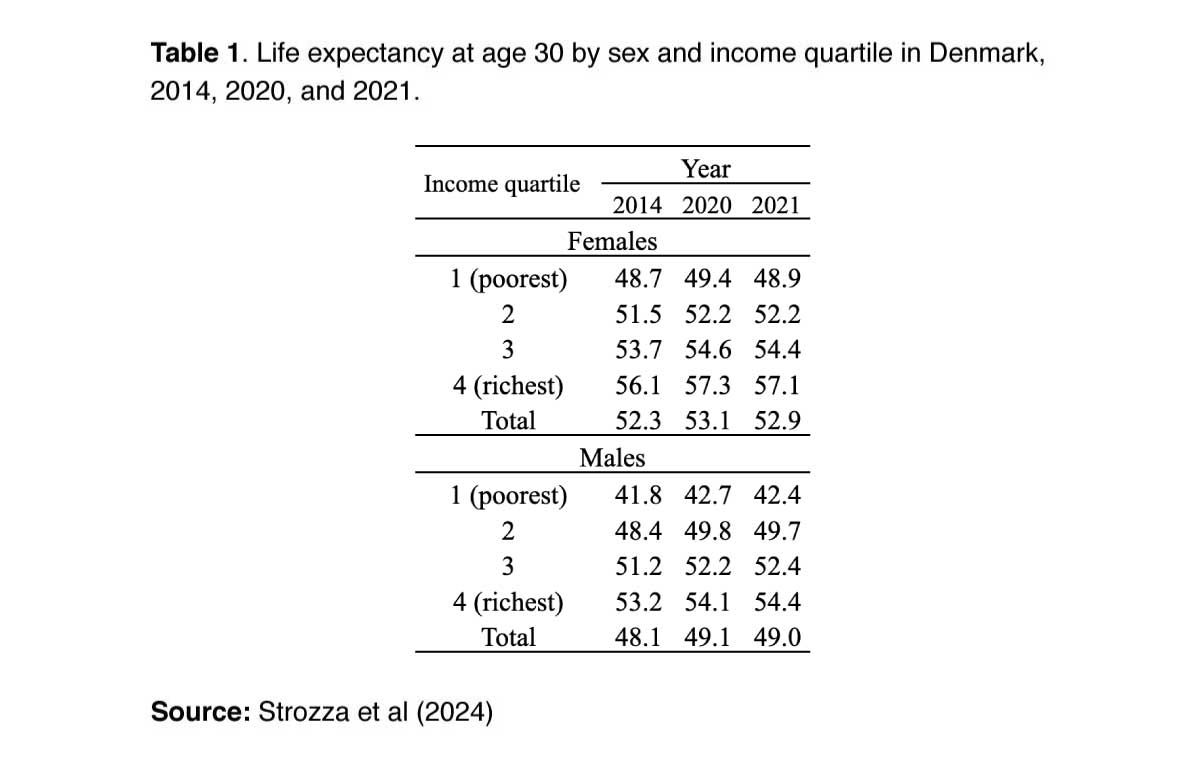
Life expectancy can be calculated in different years and at various ages. Table 1, for instance, shows life expectancy at 30 years at the beginning of the period and for the first two pandemic years by sex and income quartile, used as a proxy of socioeconomic status (SES).
Life expectancy is a snapshot of mortality conditions, and not a forecast of any individual’s lifespan. Therefore, its decline does not represent the number of years that will be deducted from the lifespans of individuals; rather, it provides a comparable measure of the impact of the mortality shock generated by the pandemic.
Table 1 shows yearly changes in life expectancy by sex and income quartile for the five years prior to the pandemic (2014-2019) and the initial two pandemic years (2020-2021).
Before the pandemic, yearly female life expectancy gains followed a social gradient. In other words, life expectancy was increasing faster for women in the highest socioeconomic groups than in the lowest. However, the confidence intervals shown in Figure 1 suggest that these results should be interpreted with caution. This was the case, to some extent, for men too, with the exception of the highest income group, where survival improvements were relatively limited. However, the differences in life expectancy changes were small, and the gap in life expectancy between the highest and lowest income groups remained large.
Figure 1 illustrates the Danish COVID-19 success story of 2020, when small gains in life expectancy were observed in the overall population (Aburto et al. 2021), as well as for most sub-populations, possibly due to the timing of policy interventions. However, the situation changed in 2021, and life expectancy losses were observed for the overall population (Schöley et al. 2022) and for most sub-populations.
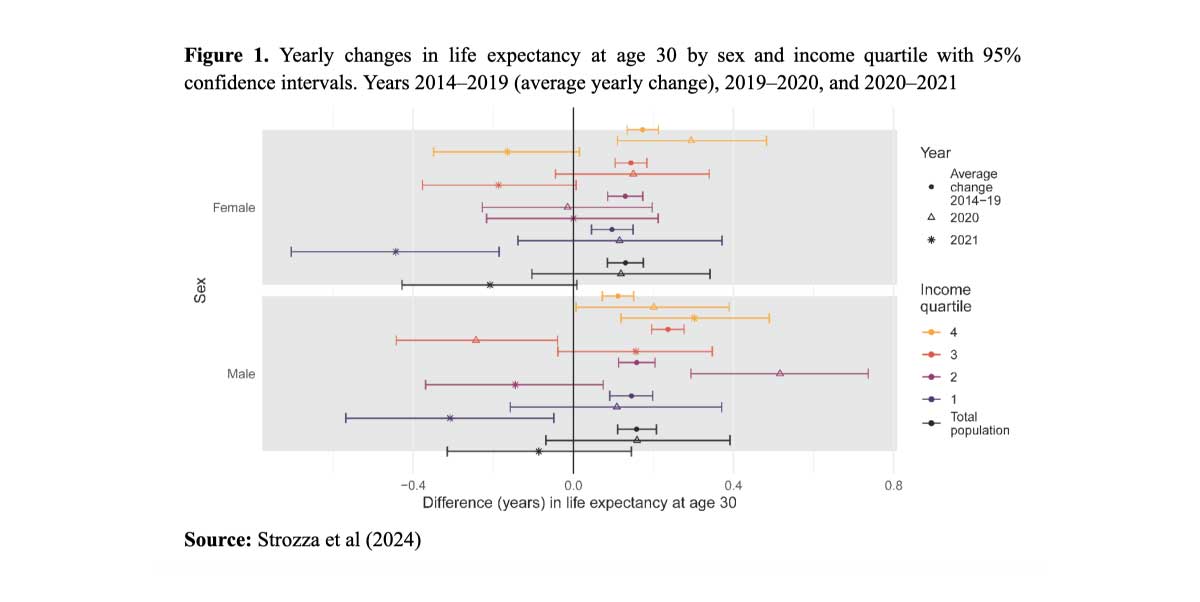
Focusing on 2021, we observe a social gradient in life expectancy changes for both men and women. Among women, all sub-populations experienced a loss in life expectancy, with those in the highest income group experiencing the smallest loss, less than two and a half months, compared to those in the lowest income group, who lost almost six months. Among men, those in the highest income groups experienced gains in life expectancy, while those in the lowest income groups experienced losses, the extent of which spanned from of almost four months gained to almost four months lost between 2020 and 2021. To summarize, inequalities in life expectancy increased across socioeconomic groups for both women and men. While the confidence intervals for the 2020 results mostly overlap, in 2021 this is the case for women but not for men, at least not when the top and the bottom quartiles are compared.
Causes of death contributing to changes in life expectancy
COVID-19 was not the only factor that contributed to changes in life expectancy over this period. Mortality from other leading causes of death changed too, illustrating socioeconomic inequalities in health caused indirectly by the pandemic.
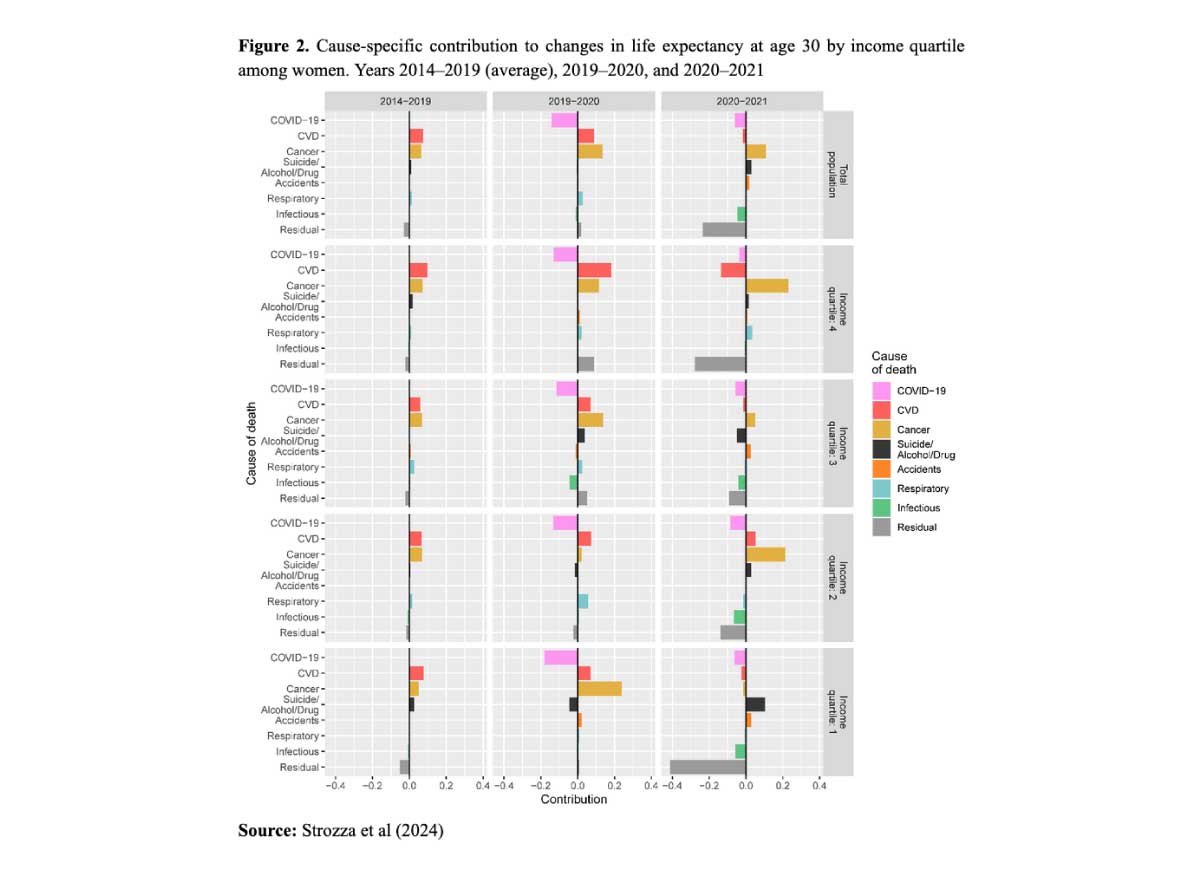
Figures 2 and 3 show cause-specific contributions to changes in life expectancy at age 30 by income quartile for women and men, respectively. Note that individual year-on-year changes include random variability, and thus require caution in their interpretation. The positive trend in 2020 was due to a decrease in cardiovascular disease and cancer mortality across income quartiles, which counterbalanced the negative contributions of COVID-19. The smaller losses among women in the highest income group in 2021 were explained by decreases in cancer mortality and a smaller negative contribution of COVID-19 and residual causes. For those in the lowest income group, cancer mortality increased slightly, contributing to small negative changes in life expectancy. Slightly higher COVID-19 mortality, together with a high contribution from residual causes and infectious diseases accounted for the rest. Analyzing changes in other causes of death, in conjunction with COVID-19 deaths, gives a more complete picture of the indirect impacts of the pandemic.
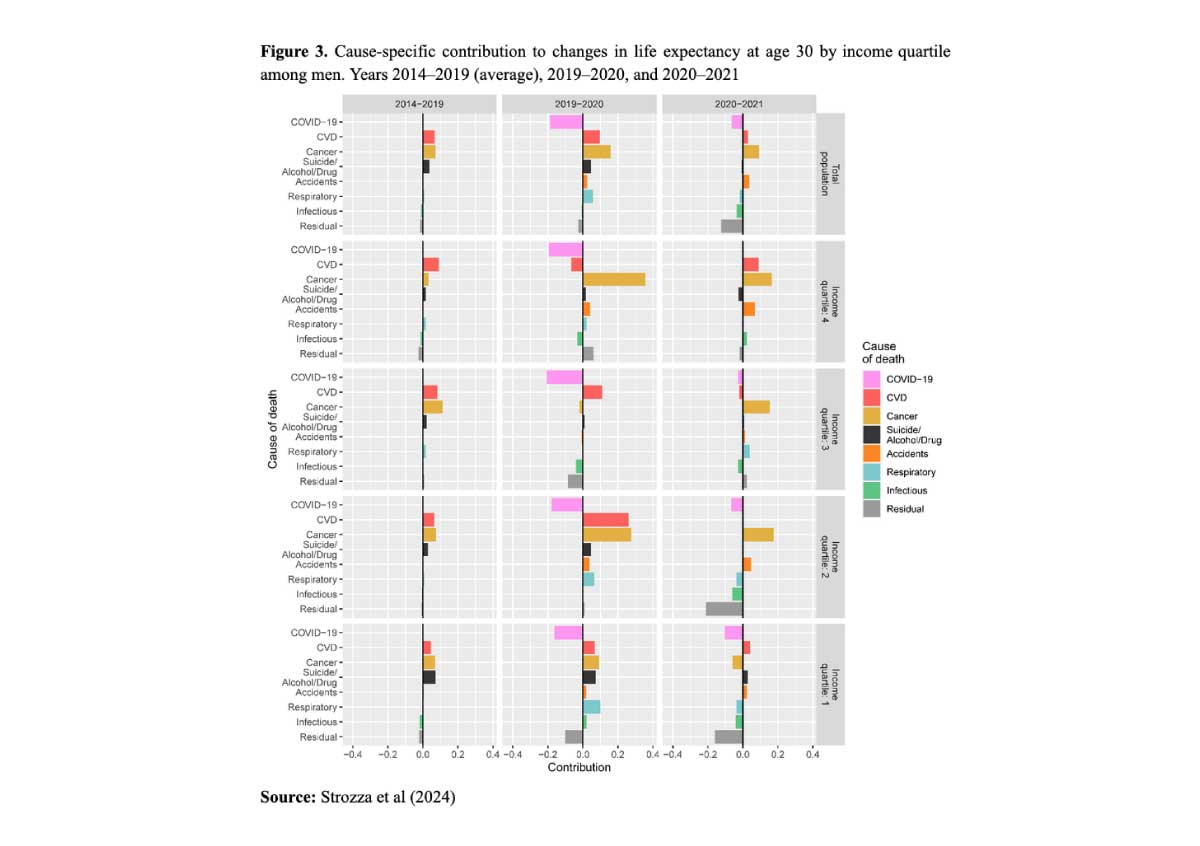
Among men, reductions in cardiovascular disease and cancer mortality also counteracted the emergence of COVID-19 in 2020, as they did for women, although other causes, such as accidents, deaths caused by suicide, drugs, or alcohol abuse, and deaths due to respiratory diseases had negative effects on changes in life expectancy in the lowest income groups. In 2021, cardiovascular disease and cancer mortality continued to decrease in high-income groups, leading to positive contributions to changes in life expectancy, while COVID-19 had practically no impact. Low-income groups, on the other hand, experienced increased mortality from COVID-19 as well as from respiratory diseases, infectious diseases, and other residual causes. For both women and men, this shows how the direct and indirect effects of COVID-19 contributed to the increasing life expectancy gap across socioeconomic groups.
Conclusions
Disparities in life expectancy across income groups in Denmark increased after the initial two pandemic years. The well-established mortality gaps were exacerbated by the dual impact of the pandemic, both directly through COVID-19 mortality, and indirectly through greater social inequalities in mortality from other causes of death. Our findings emphasize the critical need for more focused interventions for socially disadvantaged sub-groups during health emergencies. These interventions should not be restricted to the cause of the crisis itself, but are key to preventing a further widening of the gap between the most and least vulnerable sub-groups. Ultimately, this approach will foster a more equitable response to health crises.
References
- Aburto JM, Schöley J, Kashnitsky I, Zhang L, Rahal C, Missov TI, et al. Quantifying impacts of the COVID-19 pandemic through life-expectancy losses: a population-level study of 29 countries. Int J Epidemiol. 2021;51(1):63-74. https://doi.org/10.1093/ije/dyab207
- Brønnum-Hansen H, Östergren O, Tarkiainen L, Hermansen Å, Martikainen P, van der Wel KA, et al. Changes in life expectancy and lifespan variability by income quartiles in four Nordic countries: a study based on nationwide register data. BMJ Open. 2021;11(6): e048192. doi.org/10.1136/jech-2020-214108
- Schöley J, Aburto JM, Kashnitsky I, Kniffka MS, Zhang L, Jaadla H, et al. Life expectancy changes since COVID-19. Nat Hum Behav. 2022;6(12):1649–59. doi.org/10.1038/s41562-022-01450-3
- Strozza, C., Vigezzi, S., Callaway, J., and Aburto J.M. (2024). The impact of COVID-19 on life expectancy across socioeconomic groups in Denmark. Population Health Metrics 22, 3. doi.org/10.1186/s12963-024-00323-3
Friday, March 29, 2024
Racial disparities in disability and in long and happy living in America
February 26, 2024 Anthony R. Bardo and Jason L. Cummings

Now that they are growing old, have US baby boomers fulfilled the aspirations towards more positive and equitable life circumstances that characterized their youth, especially through the Civil Rights movement? One way to address this question is to focus on life expectancy, the number of remaining years that an average person can expect to live, and to analyze racial disparities in length of life.
In 1970, life expectancy at birth in the US was approximately eight years longer for Whites than for Blacks: 71.7 vs 64.1 years, respectively. By 2010 this racial gap had narrowed to slightly less than four years: 78.9 vs. 75.1 years, respectively. More recent data are difficult to compare because of the pervasive effects of the COVID-19 pandemic, but national vital statistics suggest that some progress seems to be underway.
Both survival increase and convergence are good news, of course, but it is also important to consider if these additional years are lived in good health, both in general and by subgroup. For instance, let us consider active life expectancy at age 65, or remaining years of life past the 65th birthday expected to be lived without a disability. Between the 1980s and 2010s, it increased by 2.8 years for White Americans (from 12.2 to 15.0 years) and 2.2 years for Black Americans (from 9.8 to 12.0 years). This means that the percentage of remaining years of life expected to be lived without a disability remained approximately constant, but at different levels: 76% for White people but only 67% for Blacks (Freedman & Spillman, 2016). In other words, increases in life expectancy were accompanied by an equivalent number of healthy and unhealthy years, and racial disparities remained unchanged.
While life expectancy and active life expectancy are key objective indicators of quality of life, at high levels of development, additional indicators of well-being can also be considered. One such indicator links this survival to subjective well-being, a facet of societal progress that has recently garnered wide-spread attention (Layard, 2010). Until now, few researchers have tried to determine happy life expectancy, i.e., how many years an individual can expect to live happily. This is precisely what we did in a recent study, breaking our results down by physical disability status, sex, and race (Bardo and Cummings 2023) based on representative data from the 2010 and 2012 waves of the Health and Retirement Study (n = 16,614) of the U.S. population aged 50 years and older.
The emergence of health problems is, of course, a normal and anticipated part of the aging process, and, within limits, worsening health is not a strong determinant of happiness in later life, because individuals assess their quality of life based on their expectations and ability to adapt or adjust to changing circumstances. However, the development of a disability reflects a major life change, with clear and negative consequences for both quality of life and longevity. For example, at age 50, White Americans with a disability can expect to live happily for 50% fewer years of their remaining life than their able-bodied peers. The negative influence of disability on happy life expectancy is exacerbated for Black Americans who experience a 60% reduction in remaining happy years of life when faced with a disability. These findings portray the compounding effects of cumulative (dis)advantage and circumstances that people with multiple intersecting identities (e.g., Black, male, disability) uniquely experience (Figure 1).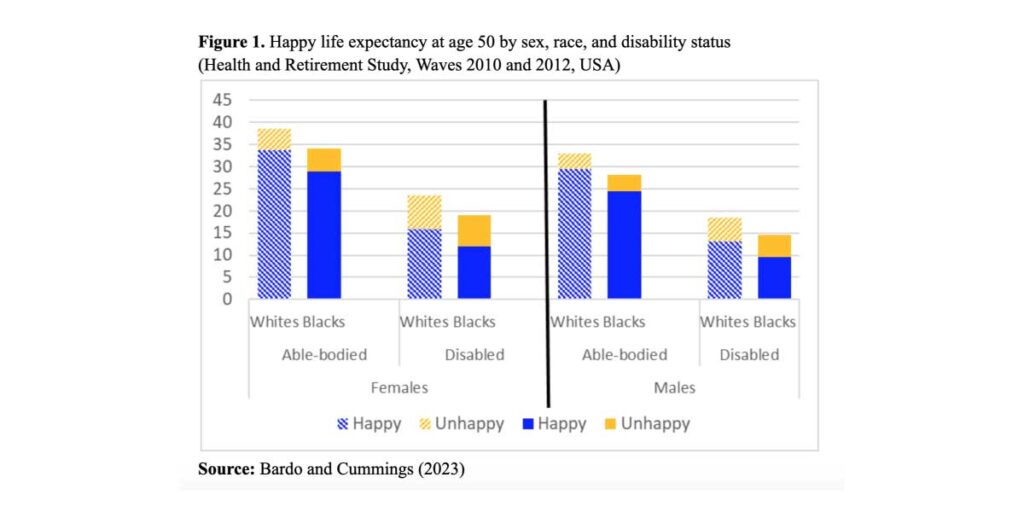
Unfortunately, in the USA, racial disparities in key resources that promote health, happiness, and longevity remain as wide today as they were in the 1970s, as, for example, in the case of the Black-White gap in median household income. Do socioeconomic differences account for racial disparities in happy life expectancy? As our analyses indicate, they do for healthy Black women but not for healthy Black men. The reasons behind this unexpected result are not self-evident, and merit further analysis.
There is no simple solution for achieving equity in opportunities to live a long, healthy and happy life. We focused on later life outcomes, but these are the consequences of cumulative chronic exposure to various race-related forms of stress and discrimination experienced throughout life, including uneven access to high quality primary/secondary education and safe housing in childhood, unequal access to quality jobs and affordable and safe housing during adulthood, and likely the high risk of imprisonment for young Black males (Gilbert et al., 2016).
It is high time that America turned attention towards the disparities in length and quality of life that persist in the land where the pursuit of life, liberty, and happiness is a supposedly unalienable right.
The racial divide is still profound in the U.S., in terms not only of survival, and survival without disabilities, but also of happiness. Anthony R. Bardo and Jason L. Cummings document some of these disparities.
Now that they are growing old, have US baby boomers fulfilled the aspirations towards more positive and equitable life circumstances that characterized their youth, especially through the Civil Rights movement? One way to address this question is to focus on life expectancy, the number of remaining years that an average person can expect to live, and to analyze racial disparities in length of life.
Trends in American longevity and physical disability
In 1970, life expectancy at birth in the US was approximately eight years longer for Whites than for Blacks: 71.7 vs 64.1 years, respectively. By 2010 this racial gap had narrowed to slightly less than four years: 78.9 vs. 75.1 years, respectively. More recent data are difficult to compare because of the pervasive effects of the COVID-19 pandemic, but national vital statistics suggest that some progress seems to be underway.
Both survival increase and convergence are good news, of course, but it is also important to consider if these additional years are lived in good health, both in general and by subgroup. For instance, let us consider active life expectancy at age 65, or remaining years of life past the 65th birthday expected to be lived without a disability. Between the 1980s and 2010s, it increased by 2.8 years for White Americans (from 12.2 to 15.0 years) and 2.2 years for Black Americans (from 9.8 to 12.0 years). This means that the percentage of remaining years of life expected to be lived without a disability remained approximately constant, but at different levels: 76% for White people but only 67% for Blacks (Freedman & Spillman, 2016). In other words, increases in life expectancy were accompanied by an equivalent number of healthy and unhealthy years, and racial disparities remained unchanged.
Racial disparities in long and happy living
While life expectancy and active life expectancy are key objective indicators of quality of life, at high levels of development, additional indicators of well-being can also be considered. One such indicator links this survival to subjective well-being, a facet of societal progress that has recently garnered wide-spread attention (Layard, 2010). Until now, few researchers have tried to determine happy life expectancy, i.e., how many years an individual can expect to live happily. This is precisely what we did in a recent study, breaking our results down by physical disability status, sex, and race (Bardo and Cummings 2023) based on representative data from the 2010 and 2012 waves of the Health and Retirement Study (n = 16,614) of the U.S. population aged 50 years and older.
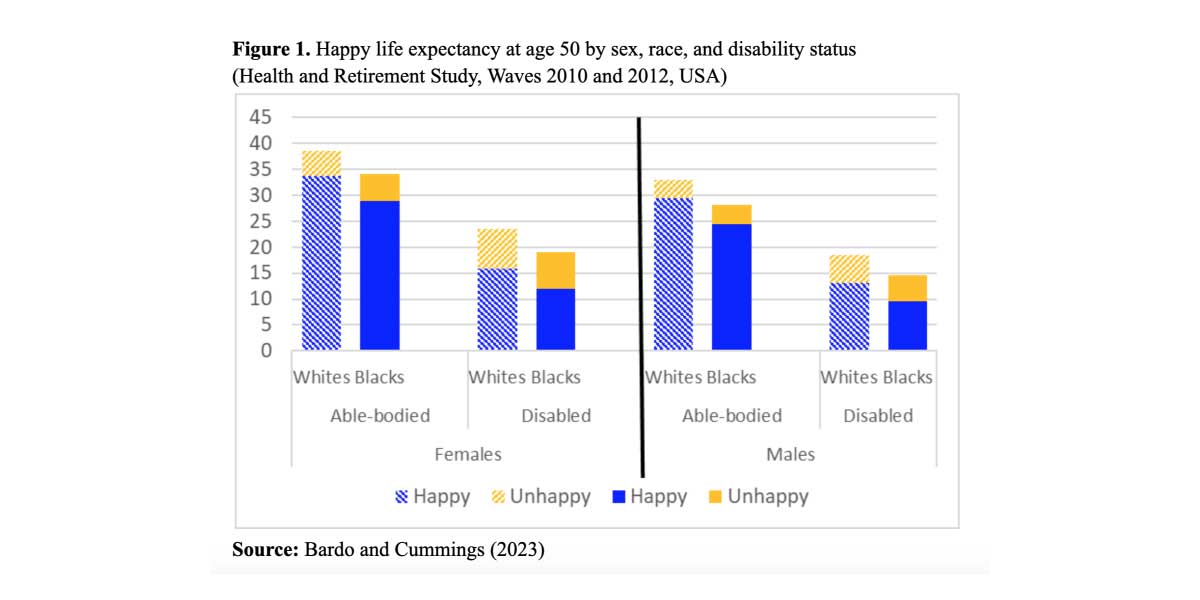
The emergence of health problems is, of course, a normal and anticipated part of the aging process, and, within limits, worsening health is not a strong determinant of happiness in later life, because individuals assess their quality of life based on their expectations and ability to adapt or adjust to changing circumstances. However, the development of a disability reflects a major life change, with clear and negative consequences for both quality of life and longevity. For example, at age 50, White Americans with a disability can expect to live happily for 50% fewer years of their remaining life than their able-bodied peers. The negative influence of disability on happy life expectancy is exacerbated for Black Americans who experience a 60% reduction in remaining happy years of life when faced with a disability. These findings portray the compounding effects of cumulative (dis)advantage and circumstances that people with multiple intersecting identities (e.g., Black, male, disability) uniquely experience (Figure 1).
Unfortunately, in the USA, racial disparities in key resources that promote health, happiness, and longevity remain as wide today as they were in the 1970s, as, for example, in the case of the Black-White gap in median household income. Do socioeconomic differences account for racial disparities in happy life expectancy? As our analyses indicate, they do for healthy Black women but not for healthy Black men. The reasons behind this unexpected result are not self-evident, and merit further analysis.
Conclusion
There is no simple solution for achieving equity in opportunities to live a long, healthy and happy life. We focused on later life outcomes, but these are the consequences of cumulative chronic exposure to various race-related forms of stress and discrimination experienced throughout life, including uneven access to high quality primary/secondary education and safe housing in childhood, unequal access to quality jobs and affordable and safe housing during adulthood, and likely the high risk of imprisonment for young Black males (Gilbert et al., 2016).
It is high time that America turned attention towards the disparities in length and quality of life that persist in the land where the pursuit of life, liberty, and happiness is a supposedly unalienable right.
References
- Bardo, A.R., Cummings, J.L. (2023) Life, Longevity, and the Pursuit of Happiness: The Role of Disability in Shaping Racial and Sex Disparities in Living a Long and Happy Life. Population Research and Policy Review. 42, 72.
- Freedman, V. A., & Spillman, B. C. (2016). Active life expectancy in the older US population, 1982–2011: Differences between blacks and whites persisted. Health Affairs, 35(8), 1351–1358.
- Gilbert, K. L., Rashawn, R., Siddiqi A., Shetty, S., Baker, E.A., Elder, K. & Griffith, D.M. (2016). Visible and invisible trends in black men’s health: pitfalls and promises for addressing racial, ethnic, and gender inequities in health. Annual Review of Public Health, 37, 295-311.
- Layard, R. (2010). Measuring subjective well-being. Science, 327, 534-534.
Tuesday, December 5, 2023
Measuring population health in Moldova: health expectancies

Tuesday, November 7, 2023
Regions with the highest life expectancy

In 2021, the overall life expectancy at birth in the EU was 80.1 years. The life expectancy for women in the EU stood at 82.9 years, which was 5.7 years longer than that for men, who averaged 77.2 years. At the time of their birth, women are expected to live longer in all 242 NUTS 2 regions where data is available.
The largest gender gap was recorded in Latvia, where life expectancy at birth for women was 9.8 years higher. The smallest gender gap was observed in the French outermost region of Mayotte, where life expectancy for women was 2.3 years higher than that for men.
Картинки см тут
Regions with the highest life expectancy Source datasets: demo_r_mlifexp
The highest life expectancy at birth for women was in the Spanish capital region of Comunidad de Madrid (88.2 years), followed by five other regions in Spain – Comunidad Foral de Navarra (87.6 years), Castilla y León (87.5 years), Cantabria (87.1 years), Galicia and País Vasco (both 87.0 years). Outside of Spain, the next highest levels of life expectancy for women at birth were reported for Rhône-Alpes in France and Provincia Autonoma di Trento in Italy (both 86.7 years).
Картинки см тут
Source datasets: demo_r_mlifexp and demo_mlexpec
The highest figure for life expectancy at birth for men in 2021, at 82.8 years, was recorded in the autonomous island region of Åland (Finland). The next highest levels were reported in two Spanish regions, Comunidad de Madrid (82.2 years) and Comunidad Foral de Navarra (81.9), and for two Swedish regions, Stockholm (82.1 years) and Småland med öarna (81.9 years).
Картинки см тут
Source datasets: demo_r_mlifexp and demo_mlexpec
Would you like to know more about the EU population?
You can read more about population statistics in the dedicated section of the Regions in Europe - 2023 interactive edition and in the Eurostat regional yearbook - 2023 edition, also available as a set of Statistics Explained articles. The corresponding maps in the Statistical Atlas provide a full-screen interactive map.
For more information
If you have any queries, please visit our contact us page.
Monday, November 6, 2023
The impact of the COVID-19 pandemic on life expectancy in the US Hispanic population
November 6, 2023 Elizabeth Arias and Betzaida Tejada-Vera

The COVID-19 pandemic had a major impact on life expectancy at birth in the United States. In 2020 it fell by 1.8 years, but the drop varied markedly by race and ethnicity, with the Hispanic/Latino (henceforth “Hispanic”) population losing substantially more than other race and ethnicity groups (Arias and Xu, 2022). Before the pandemic, the Hispanic population was characterized by better survival chances than the majority (non-Hispanic White) population, despite having lower levels of educational attainment, higher levels of poverty, and lower access to health insurance and quality care. This advantage, known as the “Hispanic Mortality Paradox”, was almost completely cancelled out by the pandemic, declining from 3.1 years in 2019 to 0.5 years in 2020 (Arias and Tejada-Vera, 2023).
The terms “Hispanic” or “Latino” were created in the US to classify persons from Spanish speaking countries and, as a result, they mask the great diversity of this population (Arias, et al. 2020). Hispanic people have origins in countries representing diverse cultural, economic, social, and political characteristics, and have distinct histories of immigration and patterns of assimilation in the US. Prior to the pandemic this diversity was also evident in differences in life expectancy at birth by country of origin (Arias and Tejada-Vera, 2023). To better understand why the pandemic disproportionately affected the Hispanic population, we examined changes in life expectancy at birth between 2019 and 2020 and the impact of changes in age and cause-specific mortality in Hispanic sub-groups across different countries of origin.
Figure 1 shows life expectancy at birth in 2019 and 2020 by Hispanic sub-group. The figure highlights differences in both levels and losses in the period, particularly among males. The overall loss of life expectancy among the Hispanic population was 4.5 years for males and 3.1 years for females, ranging from 0.6 (Other Hispanic) to 6.7 years (Central and South American) among males and from 0.6 (Other Hispanic) to 3.6 years (Mexican) among females.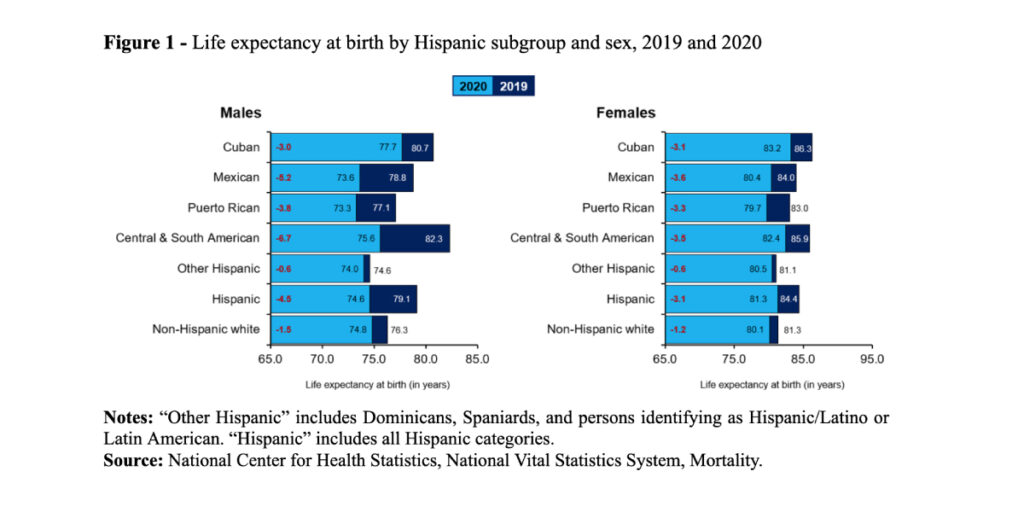
The COVID-19 pandemic increased the age-specific probability of dying during 2020, compared to 2019, differently by age and across the Hispanic sub-groups (Figure 2). For example, Central and South American males experienced probabilities of dying up to 2.5 times greater in 2020 than in 2019, concentrated in the working ages (30 to 70 years), while Cuban females experienced increases close to two times greater, concentrated in the oldest ages (75 and older).
We used a decomposition technique to explore the effects of changes in age-specific mortality on changes in life expectancy between 2019 and 2020 (see Arias and Tejada-Vera, 2023 for details). For all groups, the effects of increases in mortality below age 20 were minimal. The effects in working ages (20-69) were greater among males across all groups and, conversely, the effects in the oldest ages (70 and older) were greater among females in all groups. There were important differences across Hispanic sub-groups. Among males, increases in mortality at working ages (20-69) were largest for Mexicans (57.4%) and smallest for Cubans (39.5%). Conversely, increases at the oldest ages (70 and older) ranged from 41.3% for Mexicans to 58.4% for Cubans.
Among females, increases in mortality at working ages were smallest for Other Hispanics and Cubans (6.8% and 17.9%, respectively). The largest effects of increased mortality at the oldest ages occurred among Cubans and Other Hispanics (81.4% and 87.1%, respectively).
Figure 3 presents the contributions of increases in the five causes of death with the largest impact on the decline in life expectancy between 2019 and 2020. For all groups, increases in mortality due to COVID-19 had the largest effect on life expectancy loss and its impact was greater among the Hispanic population than among the majority population. There was variation within the Hispanic population, however. The percent contributions of increases in mortality due to COVID-19 were smallest for Puerto Rican (53.6%) and Cuban (55.3%) males compared to Central and South American (74.2%) and Mexican (72.5%) males. Among females, the impact of COVID-19 mortality ranged from 41.8% among Cubans to 77.5% and 98.2% among Central and South Americans and Other Hispanics, respectively.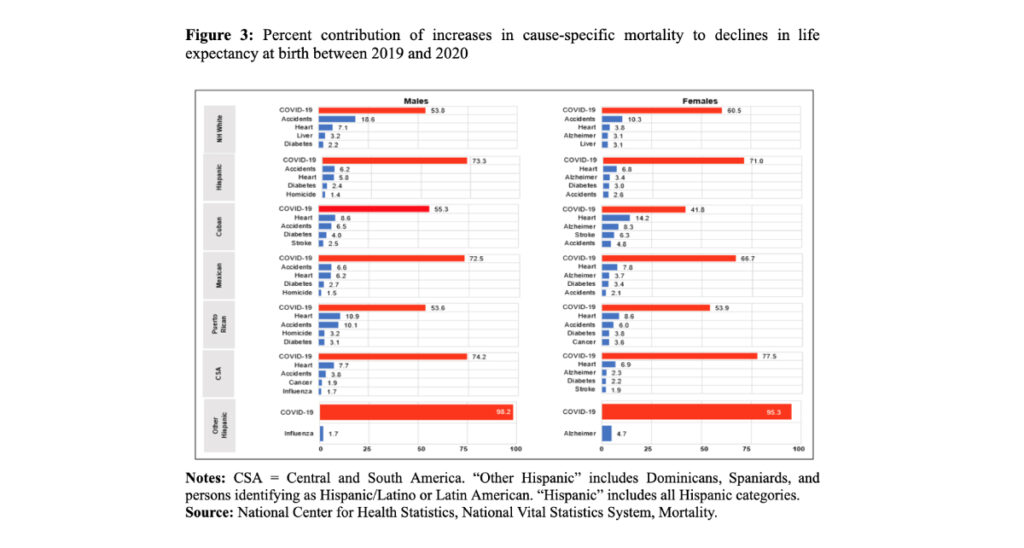
The impact of the COVID-19 pandemic on life expectancy in the Hispanic population varied by country of origin and sex. This differential impact was also linked to differences in the age distribution of excess mortality due to COVID-19 and in the relative impact of COVID-19 in comparison to other causes of death. These results suggest that for some groups, the excess burden of COVID-19 mortality was an outcome of the over-representation of some Hispanic sub-groups in essential industries with higher risks of exposure to the virus (Riley et al., 2021). For other groups, it may have been the over representation of multigenerational households where older adults were at greater risk of intergenerational transmission of the virus (Riley et al., 2021). These results highlight the importance of population disaggregation in studies of the disproportionate impact of the COVID-19 pandemic on the Hispanic population in the US.
In the United States, the Hispanic population was hit harder by the COVID-19 pandemic than the majority (non-Hispanic White) population. Elizabeth Arias and Betzaida Tejada-Vera investigate the matter and highlight a high, but often neglected level of heterogeneity.
The COVID-19 pandemic had a major impact on life expectancy at birth in the United States. In 2020 it fell by 1.8 years, but the drop varied markedly by race and ethnicity, with the Hispanic/Latino (henceforth “Hispanic”) population losing substantially more than other race and ethnicity groups (Arias and Xu, 2022). Before the pandemic, the Hispanic population was characterized by better survival chances than the majority (non-Hispanic White) population, despite having lower levels of educational attainment, higher levels of poverty, and lower access to health insurance and quality care. This advantage, known as the “Hispanic Mortality Paradox”, was almost completely cancelled out by the pandemic, declining from 3.1 years in 2019 to 0.5 years in 2020 (Arias and Tejada-Vera, 2023).
The terms “Hispanic” or “Latino” were created in the US to classify persons from Spanish speaking countries and, as a result, they mask the great diversity of this population (Arias, et al. 2020). Hispanic people have origins in countries representing diverse cultural, economic, social, and political characteristics, and have distinct histories of immigration and patterns of assimilation in the US. Prior to the pandemic this diversity was also evident in differences in life expectancy at birth by country of origin (Arias and Tejada-Vera, 2023). To better understand why the pandemic disproportionately affected the Hispanic population, we examined changes in life expectancy at birth between 2019 and 2020 and the impact of changes in age and cause-specific mortality in Hispanic sub-groups across different countries of origin.
Decline in life expectancy
Figure 1 shows life expectancy at birth in 2019 and 2020 by Hispanic sub-group. The figure highlights differences in both levels and losses in the period, particularly among males. The overall loss of life expectancy among the Hispanic population was 4.5 years for males and 3.1 years for females, ranging from 0.6 (Other Hispanic) to 6.7 years (Central and South American) among males and from 0.6 (Other Hispanic) to 3.6 years (Mexican) among females.

Age-specific variation in the probability of dying
The COVID-19 pandemic increased the age-specific probability of dying during 2020, compared to 2019, differently by age and across the Hispanic sub-groups (Figure 2). For example, Central and South American males experienced probabilities of dying up to 2.5 times greater in 2020 than in 2019, concentrated in the working ages (30 to 70 years), while Cuban females experienced increases close to two times greater, concentrated in the oldest ages (75 and older).

The impact of age and cause-specific changes in mortality on the decline in life expectancy
We used a decomposition technique to explore the effects of changes in age-specific mortality on changes in life expectancy between 2019 and 2020 (see Arias and Tejada-Vera, 2023 for details). For all groups, the effects of increases in mortality below age 20 were minimal. The effects in working ages (20-69) were greater among males across all groups and, conversely, the effects in the oldest ages (70 and older) were greater among females in all groups. There were important differences across Hispanic sub-groups. Among males, increases in mortality at working ages (20-69) were largest for Mexicans (57.4%) and smallest for Cubans (39.5%). Conversely, increases at the oldest ages (70 and older) ranged from 41.3% for Mexicans to 58.4% for Cubans.
Among females, increases in mortality at working ages were smallest for Other Hispanics and Cubans (6.8% and 17.9%, respectively). The largest effects of increased mortality at the oldest ages occurred among Cubans and Other Hispanics (81.4% and 87.1%, respectively).
Figure 3 presents the contributions of increases in the five causes of death with the largest impact on the decline in life expectancy between 2019 and 2020. For all groups, increases in mortality due to COVID-19 had the largest effect on life expectancy loss and its impact was greater among the Hispanic population than among the majority population. There was variation within the Hispanic population, however. The percent contributions of increases in mortality due to COVID-19 were smallest for Puerto Rican (53.6%) and Cuban (55.3%) males compared to Central and South American (74.2%) and Mexican (72.5%) males. Among females, the impact of COVID-19 mortality ranged from 41.8% among Cubans to 77.5% and 98.2% among Central and South Americans and Other Hispanics, respectively.

Conclusions
The impact of the COVID-19 pandemic on life expectancy in the Hispanic population varied by country of origin and sex. This differential impact was also linked to differences in the age distribution of excess mortality due to COVID-19 and in the relative impact of COVID-19 in comparison to other causes of death. These results suggest that for some groups, the excess burden of COVID-19 mortality was an outcome of the over-representation of some Hispanic sub-groups in essential industries with higher risks of exposure to the virus (Riley et al., 2021). For other groups, it may have been the over representation of multigenerational households where older adults were at greater risk of intergenerational transmission of the virus (Riley et al., 2021). These results highlight the importance of population disaggregation in studies of the disproportionate impact of the COVID-19 pandemic on the Hispanic population in the US.
References
- Arias E, Johnson NJ, Tejada-Vera B (2020). Racial disparities in mortality in the adult Hispanic population. SSM – Population Health 11.
- Arias E, Xu JQ (2022). United States life tables, 2020. National Vital Statistics Reports 71 (1). National Center for Health Statistics.
- Arias E, Tejada-Vera B (2023). Differential impact of the COVID-19 pandemic on excess mortality and life expectancy loss within the Hispanic population. Demographic Research 48, 339-352.
- Do DP, Frank R. (2021). Using race- and age-specific COVID-19 case data to investigate the determinants of the excess COVID-19 mortality burden among Hispanic Americans. Demographic Research 44, 699-718.
- Riley AR, Chen YH, Matthay EC, Glymour MM, Torres JM, Fernandez A, Bibbins-Domingo K (2021). Excess mortality among Latino people in California during the COVID-19 pandemic. SSM-Population Health 15
Wednesday, October 11, 2023
Should or should not China be afraid of population decline?
October 9, 2023 Wang Feng

China’s onset of population decline was instantly greeted by a chorus of doomsayers. The pessimists were quick to equate this demographic turning point with the end of China’s economic growth, even the end of China’s growing global geopolitical influence. Such predictions are overly simplistic and are largely based on the premise of a population-growth driven economic development model that the world has gotten so used to in the past half century and more. Yet it takes little knowledge of economics to know that labor is only one of the key ingredients of economic output. And even labor is not just a number. China’s economic boom in the past several decades indeed benefited from a large reservoir of hard-working labor, in particular the vast flows of rural migrants to cities, but one needs to be reminded that it was institutional change that has made the feared “surplus labor” during China’s planned economy era into a highly productive labor force in the last four decades.
Should China be afraid of its population decline? Can China, and the world, adapt to a new era of global demographics featured by population aging and decline, just as they adapted to the era of population explosion? Rather than being fixated on simple population numbers, be it the size of the labor force or dependency ratios, one needs to look deeper, taking stock of the characteristics of the population, and appreciating the importance of institutional conditions that have allowed past economic successes, and that will be crucial in facing future challenges.
Thanks to its historic economic boom and social transformations, China now has the most educated young population in its history. Four decades ago, when the first post-Mao population census was taken in 1982, the picture that emerged was one of a population that was already largely literate. Yet the near universal literacy among the young at the time was just that, basic literacy. Among those aged 15 to 19, who benefited the most from the expansion of education at that time, only slightly over 40 percent had junior high school or high school education. The share was only barely 20 percent among those in their 30s. The share of the population with tertiary education was miniscule: less than 1 percent of people in their late 20s and early 30s had attended college.
China has undergone an explosive growth in higher educational opportunities. Between 1998 and 2010, annual enrollment in colleges rose more than six-fold, from barely a million to nearly seven million.1 By 2020, annual enrollment in tertiary education had reached 9.7 million.2 With an annual birth number dropping to a new low of 10.6 million in 2021, China has virtually reached tertiary education enrollment saturation. Even without further expansion, all children born in the early 2020s will be able to enroll in higher education in the future.
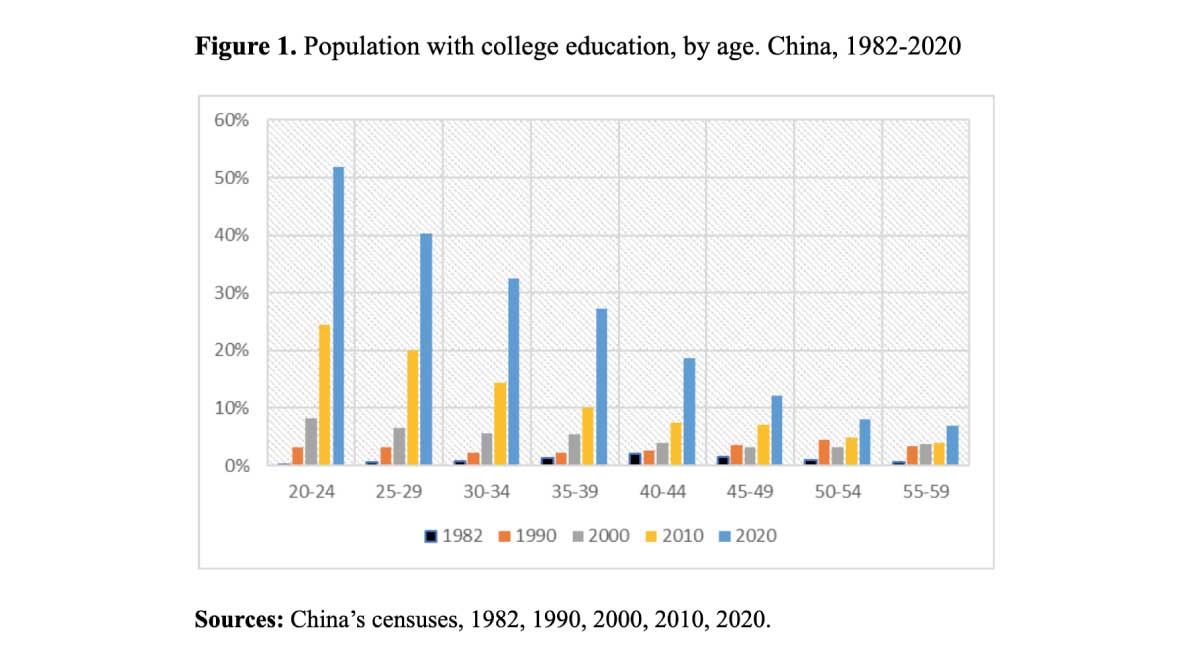
Vast improvements in educational attainment can be appreciated by comparisons across age groups and over the decades. As shown in Figure 1, around 10 percent of the population aged 45 to 49 in 2020 had a college education. Among the youngest age group, those aged 20 to 24, the share was five times higher, with over half already having tertiary educational attainment. Four decades ago, in this age group, the share was less than 0.25 percent and in 2010 the share was less than 25 percent. By 2020, more than a third of young people in their prime working age (20 to 34) already had tertiary education. Such a rapid shift in the educational level of the young population has transformed the Chinese economy and society in numerous fundamental ways, from work and income to consumption and participation in social and political affairs.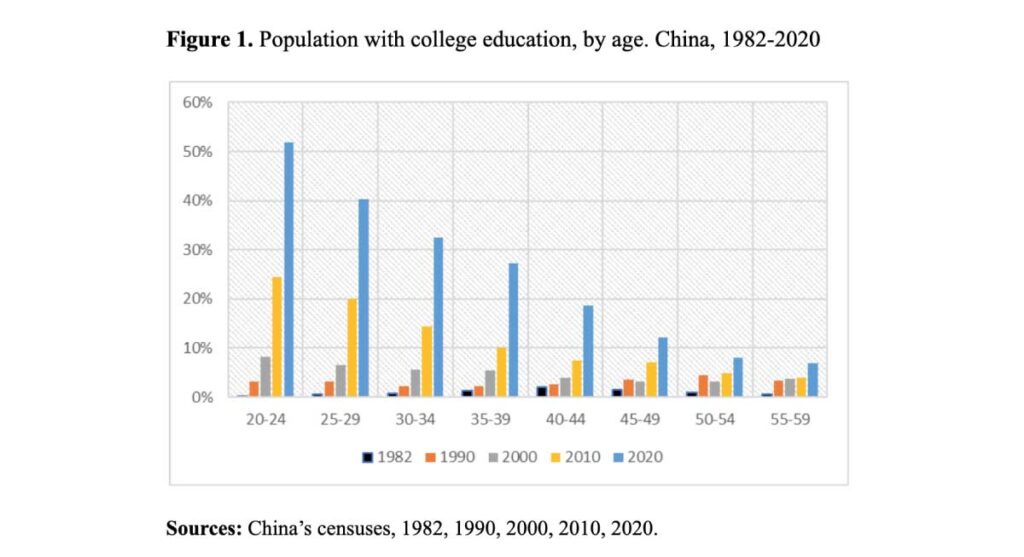
China now also has the healthiest population in its history. As China ascended from a low-income to an upper-middle income society, its population’s health profile further converged toward that of high-income countries. This convergence has come with two faces: one in the general health level of the population, and the other in disease profiles. As China’s life expectancy further increased, approaching that of high-income societies, its composition of causes of death also shifted, and is now dominated by deaths from non-communicable diseases, resembling the pattern seen in other high-income and aging populations. In contrast to earlier generations, whose early-life health risks were mostly attributable to poor nutrition, those raised during China’s age of abundance face a whole different set of risks. The term of malnutrition has acquired a new meaning in China. In the early 2010s, for instance, 244.5 million or 23.2 percent of adults aged 18 and over had hypertension, with another 435 million, or 41.4 percent having pre-hypertension, according to Chinese guidelines.3
Life expectancy is not only increasing at birth, but also at advanced ages. In China, as in the neighboring East Asian countries of Japan and South Korea, life expectancy at 65, the normal cut-off age for defining the elderly population, nearly doubled between 1950 and 2020, from 9.1 years to 17.7 years (Figure 2). Greater longevity, like educational expansion among the young, is similarly transforming the economy by enabling people to work until later ages and creating new markets to meet the needs of older adults.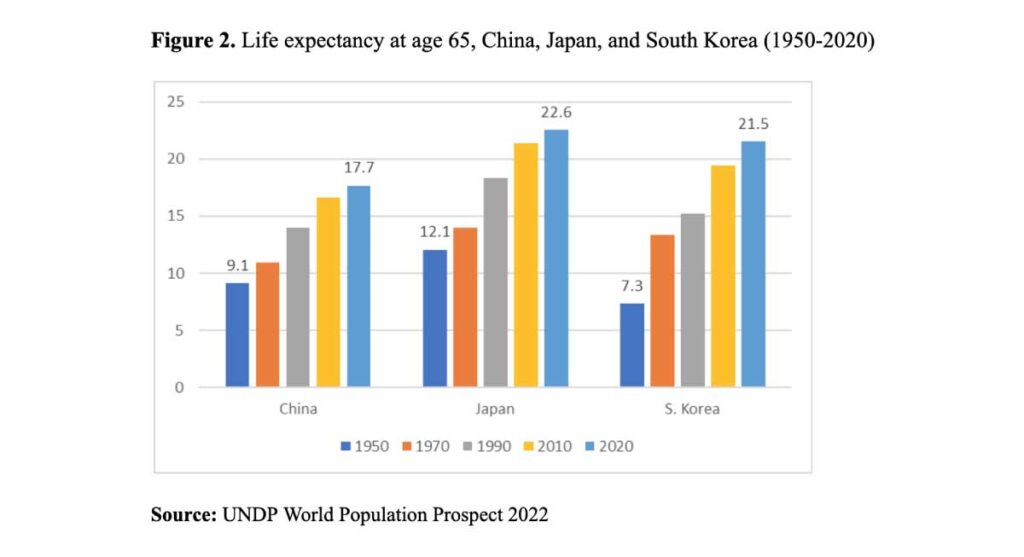
Recognizing these new features of the Chinese population is not to dismiss the challenges associated with China’s historical demographic shift. China will face serious fiscal challenges, which will make economic transformation and continued growth more imperative. In the first decades of the twenty-first century, public spending on health care and on pensions as a share of GDP has already more than doubled. This combined spending already accounted for more than a quarter of all government spending by 2020, or close to 10 percent of GDP.4 One study has projected that population aging alone could drive up such public spending to 20 percent of GDP by 2040, and to 23 percent by 2050.5 Increasing per capita benefits to levels commensurate with that of a high-income society could increase the share of public spending much faster, to 32 percent of GDP by 2050. In the absence of any substantial increase in government revenue, such a share would imply that the entire government revenue would have to be used for such public spending, mostly in support of an aging population.
Rather than spelling the country’s fate based on simple population numbers, however, a new economic growth model is essential for sustaining increased living standards of the population. China had an abundant supply of labor during its planned economy years, but that labor was not put to productive use. China has shifted its course of economic growth and now has the most educated and the healthiest population in its long history. The end of population growth, therefore, is by no means an automatic end of economic growth. What should be feared is not a smaller and older population. The challenges will give rise to innovation and adaptation, as history has shown us again and again.
China’s population boom is over: demographic aging and decline will characterize its foreseeable future. However, according to Wang Feng, this will not entail a decrease in the standard of living of its citizens, or of China’s role in the globalized world, thanks to unparalleled improvements in education and health.
China’s onset of population decline was instantly greeted by a chorus of doomsayers. The pessimists were quick to equate this demographic turning point with the end of China’s economic growth, even the end of China’s growing global geopolitical influence. Such predictions are overly simplistic and are largely based on the premise of a population-growth driven economic development model that the world has gotten so used to in the past half century and more. Yet it takes little knowledge of economics to know that labor is only one of the key ingredients of economic output. And even labor is not just a number. China’s economic boom in the past several decades indeed benefited from a large reservoir of hard-working labor, in particular the vast flows of rural migrants to cities, but one needs to be reminded that it was institutional change that has made the feared “surplus labor” during China’s planned economy era into a highly productive labor force in the last four decades.
Should China be afraid of its population decline? Can China, and the world, adapt to a new era of global demographics featured by population aging and decline, just as they adapted to the era of population explosion? Rather than being fixated on simple population numbers, be it the size of the labor force or dependency ratios, one needs to look deeper, taking stock of the characteristics of the population, and appreciating the importance of institutional conditions that have allowed past economic successes, and that will be crucial in facing future challenges.
It’s not all about a number: new faces of the Chinese population
Thanks to its historic economic boom and social transformations, China now has the most educated young population in its history. Four decades ago, when the first post-Mao population census was taken in 1982, the picture that emerged was one of a population that was already largely literate. Yet the near universal literacy among the young at the time was just that, basic literacy. Among those aged 15 to 19, who benefited the most from the expansion of education at that time, only slightly over 40 percent had junior high school or high school education. The share was only barely 20 percent among those in their 30s. The share of the population with tertiary education was miniscule: less than 1 percent of people in their late 20s and early 30s had attended college.
China has undergone an explosive growth in higher educational opportunities. Between 1998 and 2010, annual enrollment in colleges rose more than six-fold, from barely a million to nearly seven million.1 By 2020, annual enrollment in tertiary education had reached 9.7 million.2 With an annual birth number dropping to a new low of 10.6 million in 2021, China has virtually reached tertiary education enrollment saturation. Even without further expansion, all children born in the early 2020s will be able to enroll in higher education in the future.
Vast improvements in educational attainment can be appreciated by comparisons across age groups and over the decades. As shown in Figure 1, around 10 percent of the population aged 45 to 49 in 2020 had a college education. Among the youngest age group, those aged 20 to 24, the share was five times higher, with over half already having tertiary educational attainment. Four decades ago, in this age group, the share was less than 0.25 percent and in 2010 the share was less than 25 percent. By 2020, more than a third of young people in their prime working age (20 to 34) already had tertiary education. Such a rapid shift in the educational level of the young population has transformed the Chinese economy and society in numerous fundamental ways, from work and income to consumption and participation in social and political affairs.
Health and survival
China now also has the healthiest population in its history. As China ascended from a low-income to an upper-middle income society, its population’s health profile further converged toward that of high-income countries. This convergence has come with two faces: one in the general health level of the population, and the other in disease profiles. As China’s life expectancy further increased, approaching that of high-income societies, its composition of causes of death also shifted, and is now dominated by deaths from non-communicable diseases, resembling the pattern seen in other high-income and aging populations. In contrast to earlier generations, whose early-life health risks were mostly attributable to poor nutrition, those raised during China’s age of abundance face a whole different set of risks. The term of malnutrition has acquired a new meaning in China. In the early 2010s, for instance, 244.5 million or 23.2 percent of adults aged 18 and over had hypertension, with another 435 million, or 41.4 percent having pre-hypertension, according to Chinese guidelines.3
Life expectancy is not only increasing at birth, but also at advanced ages. In China, as in the neighboring East Asian countries of Japan and South Korea, life expectancy at 65, the normal cut-off age for defining the elderly population, nearly doubled between 1950 and 2020, from 9.1 years to 17.7 years (Figure 2). Greater longevity, like educational expansion among the young, is similarly transforming the economy by enabling people to work until later ages and creating new markets to meet the needs of older adults.

Not all is gold that glitters
Recognizing these new features of the Chinese population is not to dismiss the challenges associated with China’s historical demographic shift. China will face serious fiscal challenges, which will make economic transformation and continued growth more imperative. In the first decades of the twenty-first century, public spending on health care and on pensions as a share of GDP has already more than doubled. This combined spending already accounted for more than a quarter of all government spending by 2020, or close to 10 percent of GDP.4 One study has projected that population aging alone could drive up such public spending to 20 percent of GDP by 2040, and to 23 percent by 2050.5 Increasing per capita benefits to levels commensurate with that of a high-income society could increase the share of public spending much faster, to 32 percent of GDP by 2050. In the absence of any substantial increase in government revenue, such a share would imply that the entire government revenue would have to be used for such public spending, mostly in support of an aging population.
Rather than spelling the country’s fate based on simple population numbers, however, a new economic growth model is essential for sustaining increased living standards of the population. China had an abundant supply of labor during its planned economy years, but that labor was not put to productive use. China has shifted its course of economic growth and now has the most educated and the healthiest population in its long history. The end of population growth, therefore, is by no means an automatic end of economic growth. What should be feared is not a smaller and older population. The challenges will give rise to innovation and adaptation, as history has shown us again and again.
Foot notes
- 1 China Statistical Yearbook 2010, Table 20-7. The enrollment number includes both four-year university courses and three-year vocational courses. In 2010, 3.1 million of the 6.6 million enrolled students were in three-year vocational institutions.
- 2 China Statistical Yearbook 2021, Table 21-7.
- 3 www.ahajournals.org/doi/full/10.1161/CIRCULATIONAHA.117.032380
- 4 Public spending as a share of GDP estimated by the IMF for 2020 was 35.4 percent.
- 5 Cai, Yong, Feng Wang, and Ke Shen. 2018. “Fiscal Implications of Population Aging and Social Sector Expenditure in China.” Population and Development Review 44 (4): 811–31. http://www.jstor.org/stable/45174458.
Wednesday, October 4, 2023
Measuring population health in Moldova: health expectancies
 |
| тыцабельно |
Friday, September 22, 2023
lex

Ожидаемая продолжительность жизни при рождении в странах Европы
Самая низкая ожидаемая продолжительность жизни при рождении среди стран Европы - в Молдове: средний родившийся тут в 2023 году ребёнок проживёт 69.5 лет. В Болгарии это число чуть выше: 72.8 года, в Украине - 73 года.
А на четвёртом с конца месте расположились мы: 74.6 года проживёт средний родившийся в этом году в России ребёнок. Это даже меньше, чем в Беларуси (там 75 лет)!
Другая сторона рейтинга выглядит довольно необычно - там одновременно страны Южной и Северной Европы! 84+ лет в среднем проживут родившиеся в этом году в Испании, Италии и Швейцарии дети; 83+ - дети из Швеции, Норвегии, Исландии и Франции
Tuesday, September 19, 2023
Where Air Pollution Is Cutting Lives Short
The average person on the planet could live 2.3 years longer if global particulate pollution levels were reduced to meet the World Health Organization guideline. This is according to research carried out by the Energy Policy Institute at the University of Chicago and published in the Air Quality Life Index 2023.
In many countries, this figure is far worse. Bangladesh recorded the worst PM2.5 levels worldwide at 74 ug/m3, a stark contrast to the WHO recommendation of a maximum of 5 ug/m3. If these levels of pollution persist, resident’s lives are estimated to be cut short by an average of 6.8 years. The next three worst offenders are also in South Asia, with India ranking second (5.3 years), Nepal in third (4.6 years) and Pakistan in fourth place (3.9 years).
China has seen a marked improvement in recent years. Since 2013, the country has extended its inhabitants’ average life expectancy by 2.2 years - again, so long as these reductions in pollution are sustained. This has been thanks to a push to improve air quality in the nation. However, levels are still dangerous enough to take around 2.5 years off people’s lives.
African countries are also overrepresented in the top nine roundup with the Democratic Republic of the Congo, Rwanda, Burundi, and Republic of the Congo all included. According to the report, the DRC's regions of Mai-Ndombe, Kwilu and Kasaï are all experiencing levels of air pollution that are losing its residents up to four years of life. This is partly due to waste burning, mining and practices such as cement manufacturing.
The United States ranks comparatively lower with its residents’ lives shortened by 3.6 months. As with all countries surveyed, there are considerable differences depending on the location within the country. For example, in 2021, 20 out of the top 30 most polluted counties were in California due to wildfires.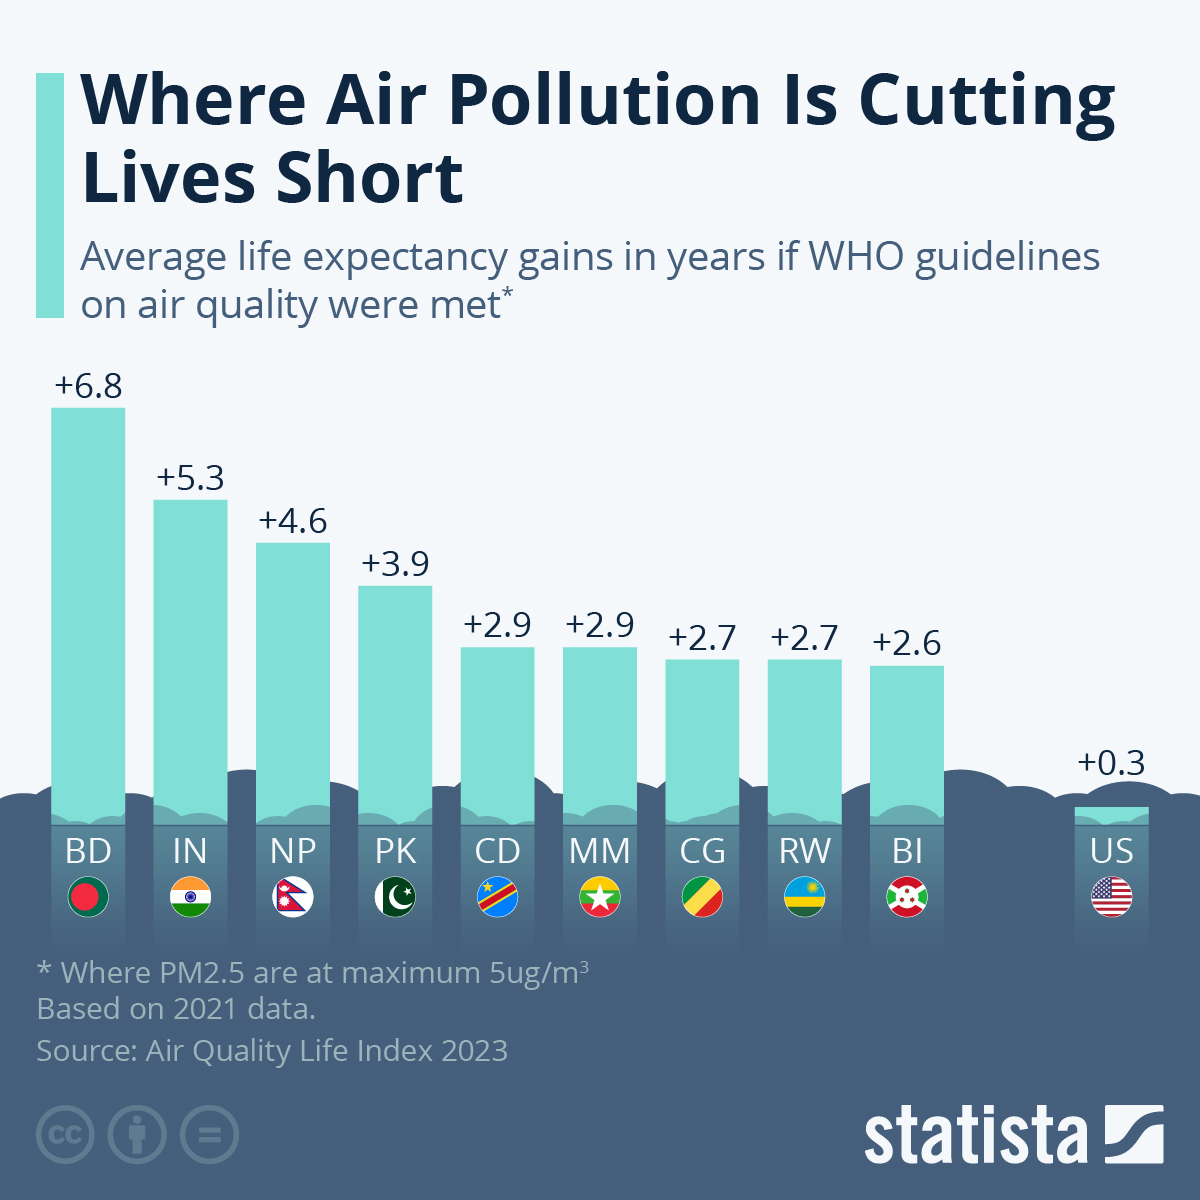
In many countries, this figure is far worse. Bangladesh recorded the worst PM2.5 levels worldwide at 74 ug/m3, a stark contrast to the WHO recommendation of a maximum of 5 ug/m3. If these levels of pollution persist, resident’s lives are estimated to be cut short by an average of 6.8 years. The next three worst offenders are also in South Asia, with India ranking second (5.3 years), Nepal in third (4.6 years) and Pakistan in fourth place (3.9 years).
China has seen a marked improvement in recent years. Since 2013, the country has extended its inhabitants’ average life expectancy by 2.2 years - again, so long as these reductions in pollution are sustained. This has been thanks to a push to improve air quality in the nation. However, levels are still dangerous enough to take around 2.5 years off people’s lives.
African countries are also overrepresented in the top nine roundup with the Democratic Republic of the Congo, Rwanda, Burundi, and Republic of the Congo all included. According to the report, the DRC's regions of Mai-Ndombe, Kwilu and Kasaï are all experiencing levels of air pollution that are losing its residents up to four years of life. This is partly due to waste burning, mining and practices such as cement manufacturing.
The United States ranks comparatively lower with its residents’ lives shortened by 3.6 months. As with all countries surveyed, there are considerable differences depending on the location within the country. For example, in 2021, 20 out of the top 30 most polluted counties were in California due to wildfires.
Thursday, September 14, 2023
The Continued Deadly Effects of 9/11
Over twenty years have passed since 2,977 victims lost their lives to the September 11 terrorist attacks. Part of this number, the New York fire and police departments count a total of 343 and 23 personnel, respectively, among the fallen that day.
Since then though, over 650 more have lost their lives to illnesses related to their participation in the rescue and recovery efforts on and in the aftermath of 9/11. Cancer and respiratory diseases have caused the most deaths over the past 22 years but research suggests that first responders also display higher rates of cardiovascular disease. Published in the medical journal JAMA Network Open in 2019, researchers found that the first firefighters on the scene were 44 percent more likely to develop cardiovascular disease than those who were first present a day later.
Speaking at a ceremony last week which added a further 43 names to the FDNY's Memorial Wall, New York Fire Commissioner Laura Kavanagh said: "Each year, this memorial wall grows as we honor those who gave their lives in service of others. These brave men and women showed up that day, and in the days and months following the attacks to participate in the rescue and recovery efforts at the World Trade Center site. We will never forget them."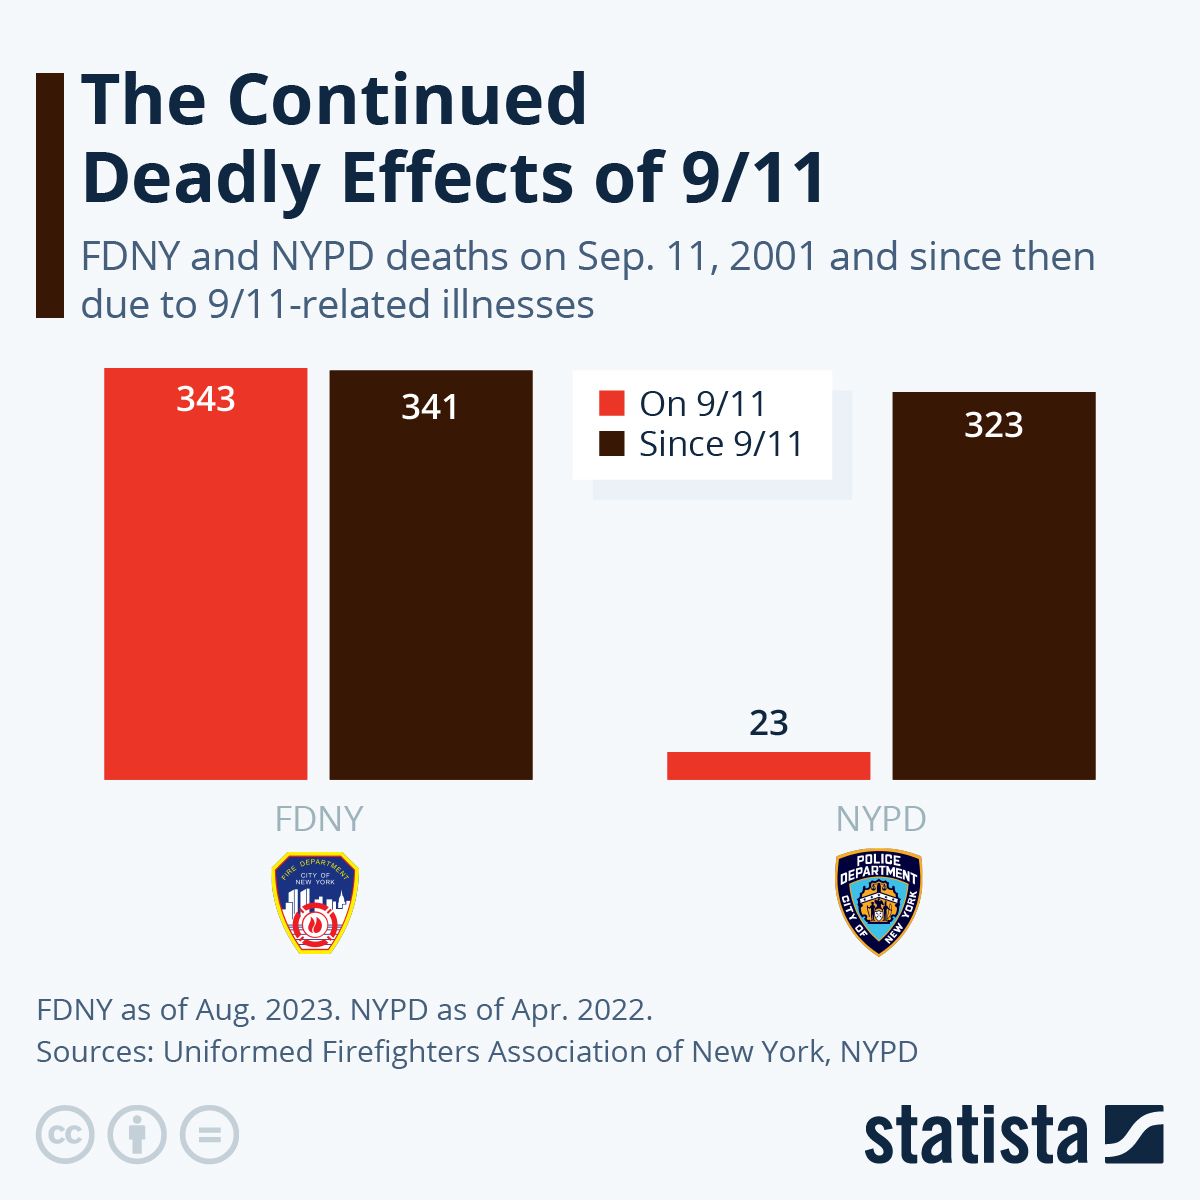
Since then though, over 650 more have lost their lives to illnesses related to their participation in the rescue and recovery efforts on and in the aftermath of 9/11. Cancer and respiratory diseases have caused the most deaths over the past 22 years but research suggests that first responders also display higher rates of cardiovascular disease. Published in the medical journal JAMA Network Open in 2019, researchers found that the first firefighters on the scene were 44 percent more likely to develop cardiovascular disease than those who were first present a day later.
Speaking at a ceremony last week which added a further 43 names to the FDNY's Memorial Wall, New York Fire Commissioner Laura Kavanagh said: "Each year, this memorial wall grows as we honor those who gave their lives in service of others. These brave men and women showed up that day, and in the days and months following the attacks to participate in the rescue and recovery efforts at the World Trade Center site. We will never forget them."
Saturday, August 26, 2023
BRICS countries: life expectancy at birth from 2000 to 2021
Globally, average life expectancy from birth has risen from 67.6 years in 2000 to 72.75 years in 2020. Of the BRICS countries, life expectancy in Brazil and China has been above the global average during this time, while India's and South Africa's have consistently been below, and Russia's was below until 2017. Life expectancy from birth has risen in all five BRICS countries over these two decades, although there was a drop of almost three years in South Africa between 2000 and 2005, due to the prevalence of HIV/AIDS, and a slight drop of almost half a year in Russia from 2000 to 2003, due to the prevalence of unhealthy lifestyles and alcohol/substance abuse.
Sunday, August 20, 2023

Thursday, July 20, 2023
billionaires in Europe
Количество долларовых миллиардеров в странах Европы в 2023
 |
| если кортинко не видно, тыцайте выше — она есть |
Tuesday, June 20, 2023
school expectancy

Ожидаемая продолжительность обучения в странах Европы
Дольше всех в Европе учатся жители Греции: в среднем 20 лет (эта цифра включает все уровни образования)! Чуть меньше учатся в Бельгии: 19.6 лет и Швеции: 19.4. В целом же, по средней ожидаемой продолжительности обучения в Европе лидируют страны северной её части: больше 19 лет в среднем учатся и в Финляндии и Исландии, немногим меньше - в Ирландии, Дании и Нидерландах
А вот Греция здесь - изрядный выброс, потому что в странах-соседях учатся заметно меньше: 13.6 лет в Северной Македонии (третье с конца место после Сан-Марино и Андорры), 13.9 - в Болгарии, в районе 14-15 лет на больше части Балканского полуострова
У нас средний человек учится 15.8 лет - уровень Франции и вполне себе средняя цифра для Восточной Европы. Но всё же ниже средней продолжительности в странах Западной Европы
А вот Греция здесь - изрядный выброс, потому что в странах-соседях учатся заметно меньше: 13.6 лет в Северной Македонии (третье с конца место после Сан-Марино и Андорры), 13.9 - в Болгарии, в районе 14-15 лет на больше части Балканского полуострова
У нас средний человек учится 15.8 лет - уровень Франции и вполне себе средняя цифра для Восточной Европы. Но всё же ниже средней продолжительности в странах Западной Европы
Subscribe to:
Posts (Atom)