Showing posts with label ТВ. Show all posts

Sunday, December 3, 2023

hny

Новогодние огоньки 31 декабря каждый третий россиянин включит для фона


Только 1 из 9 россиян будет смотреть голубые огоньки по телевизору. В опросе сервиса по поиску высокооплачиваемой работы SuperJob приняли участие экономически активные граждане из всех округов страны.

Музыкальные развлекательные передачи в новогоднюю ночь собираются смотреть 11% россиян, 33% включат их для фона. 45% не будут смотреть огоньки 31 декабря.

Женщины чаще мужчин смотрят новогодние передачи и включают их в фоновом режиме. Аудитория голубых огоньков выше среди россиян с детьми, чем среди бездетных. Среди молодых россиян поклонников таких телепередач меньше, чем среди тех, кто старше.

За три года число россиян, отказывающихся от просмотра новогодних огоньков, выросло с 38 до 45%.

Место проведения опроса: Россия, все округа
Населенных пунктов: 456
Время проведения: 28 ноября — 1 декабря 2023 года
Исследуемая совокупность: экономически активное население России старше 18 лет
Размер выборки: 2000 респондентов

Подробнее

Saturday, October 21, 2023

heavy drinking bastard

​​«Сильно выпивающая шмара» довела до увольнения: Евгения Сатановского уволили с «Соловьев LIVE» за слова о Марии Захаровой


Востоковед и политолог, бывший президент Российского еврейского конгресса Евгений Сатановский уволен с прокремлевского канала «Соловьев LIVE», где работал экспертом, за слова о сотрудниках МИД России Марии Захаровой и Михаиле Богданове. Об этом сообщил ведущий Владимир Соловьев.

Сатновский участвовал в программе израильского журналиста Александра Вальдмана на канале в YouTube. Сатановский и Вальдман обсуждали текущее противостояние Израиля с ХАМАС.

Богданова Сатановский назвал «сильно спившимся замминистра, который еще в Каире послом бухал, как не в себя». Про Захарову Сатановский сказал, что она «сильно выпивающая шмара», которая «в принципе евреев-то не особенно любит, а Израиль и терпеть не может».


«Вот ситуация, при которой Путину до зарезу нужны иранцы, арабы, турки. И он утирается и умывается вне зависимости от того, чего происходит - с теми же турками, с тем же Эрдоганом. А это главная крыша», — отметил Сатановский.

«Я не вижу возможности продолжать профессиональное общение с Евгением Яновичем и принял решение об увольнении Евгения Яновича Сатановского с нашего канала», — сказал Соловьев в видеообращении.

Tuesday, April 25, 2023

info sources

Основными источникам и информации для россиян остаются ТВ, Интернет-издания, соцсети и Telegram-каналы. После изменений весны прошлого года, когда наблюдался всплеск доверия телевидению, снижение доверия интернет-источникам и резкий рост аудитории Telegram-каналов, аудитории основных источников информации стабилизировалась. Однако, несмотря на то, что телевизионные новости по-прежнему представляются респондентам более значимыми и более надежными, аудитории регулярных потребителей телевизионных и интернет-новостей уже сравнялись в размерах: около половины респондентов регулярно смотрят новости по ТВ или читают их в Интернете, каждый пятый регулярно смотрит видеоблоги. Самые популярными журналистами, ведущими общественно-политических программ оказались В. Соловьев, О. Скабеева, Е. Попов и М. Симонян. По всем вопросам наблюдаются заметные различия по возрасту респондентов.

Saturday, November 19, 2022

FIFA World Cup: The Biggest Stage of All?

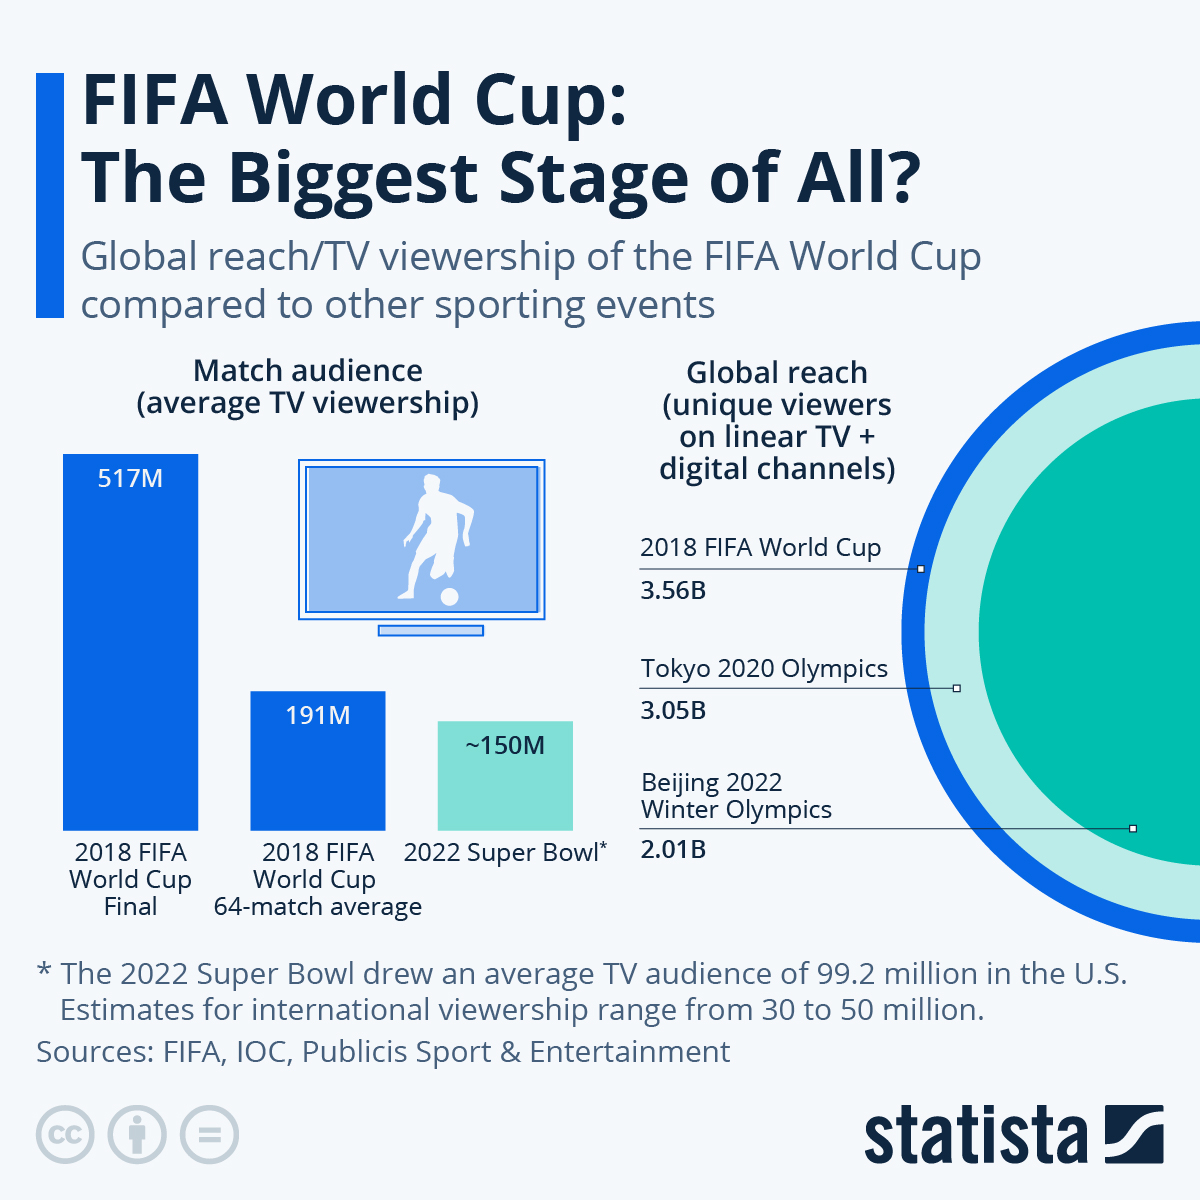
When Qatar and Ecuador kick off the 2022 FIFA World Cup on Sunday, it is the beginning of what is arguably the biggest sporting event in the world. While maybe not the greatest spectacle in sports – that honor goes to the Super Bowl, which is bridging the gap between sports and entertainment unlike any other event – the quadrennial FIFA World Cup is probably the most followed competition in the world of sports.

Taking the Super Bowl as a measuring stick reveals the extraordinary scale of the World Cup’s global appeal. According to FIFA, the average live TV audience for the 64 matches at the 2018 World Cup in Russia was 191 million. That’s significantly more than estimates for the Super Bowl’s TV viewership, which was just short of 100 million in the U.S. this year plus an estimated 30 to 50 million across the globe. Keep in mind, it’s not the World Cup final we’re talking about, it is every single one of the 64 matches played over the course of a month. The final is at another level altogether, with the 2018 clash between France and Croatia drawing an average TV audience of 517 million people, as live coverage of the game reached more than a billion people in total.

Looking at the overall reach of the FIFA World Cup, it even puts the Olympics to shame. In 2018, an estimated 3.56 billion people watched at least one minute of World Cup coverage on linear TV or across digital channels, compared to 3.05 billion for the Tokyo 2020 Olympics and 2.01 billion for the Beijing 2022 Winter Games. And Russia 2018 was no outlier in that respect: Brazil 2014 reached similar numbers and so did South Africa 2010 before it. The matter of fact is that football truly is a global game, played and followed across the globe like no other sport. Whether the controversial decision to award the 2022 World Cup to Qatar will affect the event’s reach is yet unclear, but polls suggest that, all criticism aside, hundreds of millions of football fans will tune in once the ball is actually rolling.FIFA World Cup: The Biggest Stage of All?

Wednesday, May 18, 2022

UN family and cholera

ВОЗ боится распространения холеры в Мариуполе


Из-за разрушенной системы водоснабжения в Мариуполе возможно распространение инфекционных заболеваний, в частности, холеры, заявила региональный директор по чрезвычайным ситуациям Всемирной организации здравоохранения Дорит Ницан.

"Мы получили информацию от неправительственных организаций, которые там работают, что на улицах просто болото, и канализационная вода смешивается с питьевой", - сказала Ницан на пресс-конференции.

Она напомнила, что случаи холеры были зафиксированы в Мариуполе еще до 2011 года, поэтому ВОЗ готовится к возможности новых вспышек, в частности, готовит противохолерные комплекты и вакцины.

Стали понятны опасения РФ по поводу холеры, вспомнил ещё дружбанские времена и интервью украинского Онищенко телевизору:
— что вы собираетесь делать с холерой?
— ничего
— ???
— она идёт вверх по Днепру, а обещают заморозки — вибрион погибнет.

Tuesday, January 4, 2022

tsargrad knows everything

перепись ещё не посчитана, но результат на лице

ПЕРЕПИСЬ НАСЕЛЕНИЯ НАСЧИТАЛА В ПОДМОСКОВЬЕ 11 МИЛЛИОНОВ ЧЕЛОВЕК


За 10 лет население Московской области увеличилось в полтора раза.

В Подмосковье первые итоги переписи населения оказались шокирующими - с предыдущей переписи 2010 года население региона выросло в полтора раза. По данным закончившейся вчера, 14 ноября, переписи-2020 в Московской области живет около 11 миллионов человек, 10 лет назад было 7,1 миллиона.

Но это еще не точно. Официально итоги переписи подведут в апреле 2020 года. Уже сейчас известно, что первичные данные по численности населения могут быть завышенными - так как переписчики не спрашивают никаких документов, в число жителей могли попасть временно проживающие. Или семью могли переписать несколько раз, со слов разных членов семейства. Все эти данные будут "вычищаться" при обработке.

Но все равно очевидно, что за 10 лет Подмосковье стало гораздо более населенным. Больше всего жителей прибавилось в городских округах Ленинский, Одинцовский, Истра, Долгопрудный, Домодедово, Солнечногорск и Наро-Фоминский [действительно, что ли сельского населения больше нет?].

КОНКРЕТНО


По итогам переписи 2010 года в Подмосковье насчитали 7,095 миллиона жителей, из них 5,68 миллиона городского населения и 1,41 сельского.

Уважаемые читатели, если вам есть чем поделиться с редакцией «Царьград Подмосковье», присылайте свои наблюдения, вопросы, новости на электронную почту mo@tsargrad.tv

Sunday, January 2, 2022

TV

Цветной телевизор Рубин 61ТЦ403Д

"Я не смотрю телевизор"


Эта фраза давно и прочно вошла в моду. Ее произносят с гордостью, с придыханием, с чувством собственного превосходства.

Ну, не все, но многие. Я, например, просто констатирую факт. Я его действительно не смотрю, мне он совершенно без надобности.

И да, наше телевидение вполне заслужило такую репутацию. Хотя почему только "наше"? Разница с "не-нашим" если и есть, то скорее количественная, чем качественная.

Но нет, отказ от телевизора не является показателем ни ума, ни оригинальности и независимости мышления, ни даже здоровой психики. Есть сколько угодно людей, которые принципиально не смотрят телевизор, но в голове у них при этом овсяная каша. Потому что ингредиенты для этой каши можно почерпнуть где угодно, у телевидения нет никакой монополии на глупость.

Одним словом, дурак, который не смотрит телевизор - рядовое явление.
Другой вопрос, что умный человек, который регулярно и добровольно смотрит телевизор (не в рамках формального или неформального исследования, а просто так) - большая редкость.

Потому что в чем смысл просмотра телевизора в современном мире? Единственное более или менее разумное его применение - в качестве "фона" при выполнении однообразной, механической задачи, не требующей концентрации. И то я бы в этом случае просто поставил хорошую музыку.

Сегодня смотреть телевизор - это в чистом виде форма досуга. В условиях массового доступа к быстрому Интернету (я сейчас не беру какую-нибудь глухую деревню) информацию гораздо проще и быстрее получить именно оттуда (я уж не говорю про качество этой информации). И в качестве формы досуга телевидение, на мой взгляд, с треском проигрывает всем возможным альтернативам, как то:
  • пообщаться с живыми людьми - живьем или в Интернете
  • почитать книгу
  • посмотреть хороший фильм или интересное видео.
Хорошие фильмы и передачи, разумеется, есть и на телевидении. Но у любого канала - жесткая сетка вещания, которая не подстраивается под конкретного зрителя. И количество каналов в этом совершенно ничего не меняет. В Интернете я могу посмотреть то, что мне интересно, тогда, когда у меня есть на это время.

Единственное преимущество телевизора - не надо думать, выбирать и вообще утруждать свое серое вещество. Все уже выбрали за тебя, просто садись и потре​**яй. Вопрос о том, для кого это преимущество актуально, на мой взгляд, совершенно риторический.

UPD. Речь в данном случае не идет о телевизоре как тяжелом тупом предмете, способном воспроизводить изображение и поэтому использоваться для просмотра фильмов из Интернет-кинотеатров, работы на компьютере или колки орехов. Речь идет о его использовании по прямому назначению - для просмотра программ обычного телевидения.

Thursday, July 1, 2021

Trust In The News

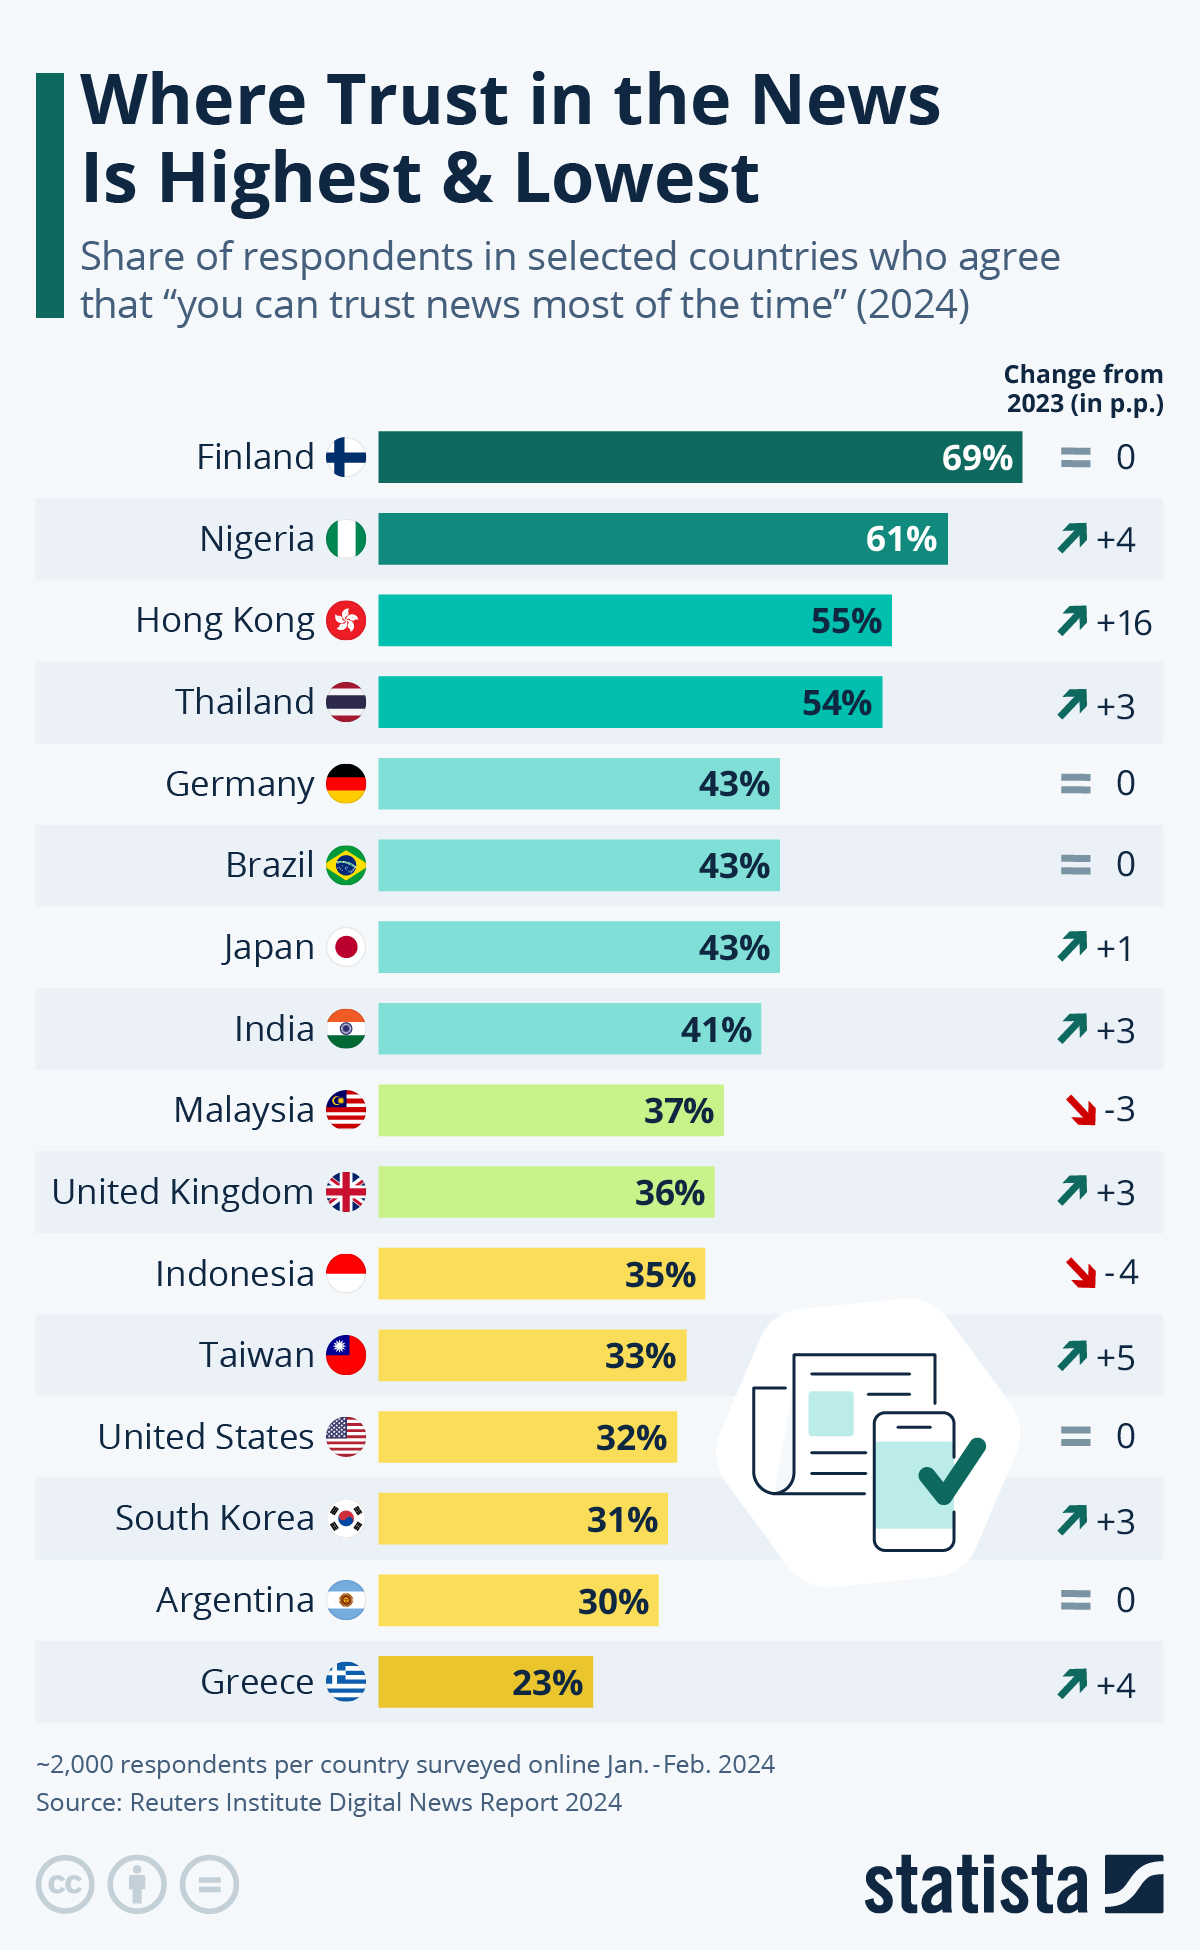
The Reuters Institute For The Study Of Journalism released its 2021 Digital News Report this week which polled 92,000 consumers in 46 markets about a range of digital news topics ranging from the pandemic's impact on consumption to the progress of paid business models as well as trust and misinformation. When it comes to the latter, the research found that overall trust in the news rebounded strongly over the past year across the majority of the 46 markets analyzed.


Finland had the highest share of respondents agreeing "you can trust news most of the time" at 65 percent which marks a nine percentage point increase since the last edition of the report. The United States made little progress and it is rock bottom of the report with only 29 percent of people trusting the news most of the time.

The research states that the trust gains across most markets might be due to extensive coverage of Covid-19 which may have had the effect of making news more straightforward and fact-based in addition to pushing partisan politics off the main agendy. According to the report, the United States did not record the gains seen in other countries due to deep division about an allegedly stolen election as well as the aftermath of George Floyd's killing. Infographic: Where Trust In The News Is Highest & Lowest | Statista

Sunday, February 14, 2021

RenTV and belgazprombank.by

Белорусские менты вскрываю банковские ячейки
  • смотрите ли Вы RenTV, как смотрю его я?
  • не смотрите и прально делаете, но
  • но в каждой шутке есть доля шутки, и RenTV может показать такое:

Великобритания, 1971 год. Терри встречает старую знакомую Мартин, которая предлагает ему ограбить банк и одним махом решить все финансовые проблемы. Но на самом деле это идея служащего МИ-5, которому нужно выкрасть компромат на члена королевской семьи. Ограбление проходит успешно, но события принимают неожиданный поворот.

В банке хранятся не только деньги, речь пойдёт о банковских ячейках, где можно хранит что угодно, к примеру, ведомость выдачи денег полицейским с целью коррупции.
А теперь читайте: Беларусь, 2020 год. Налёт на Белгазпрёмбанк и тут.

Ограбление на Бейкер Стрит 

на улице Притыцкага 60, 2 


Monday, October 26, 2020

The Most Surveilled Cities in the World

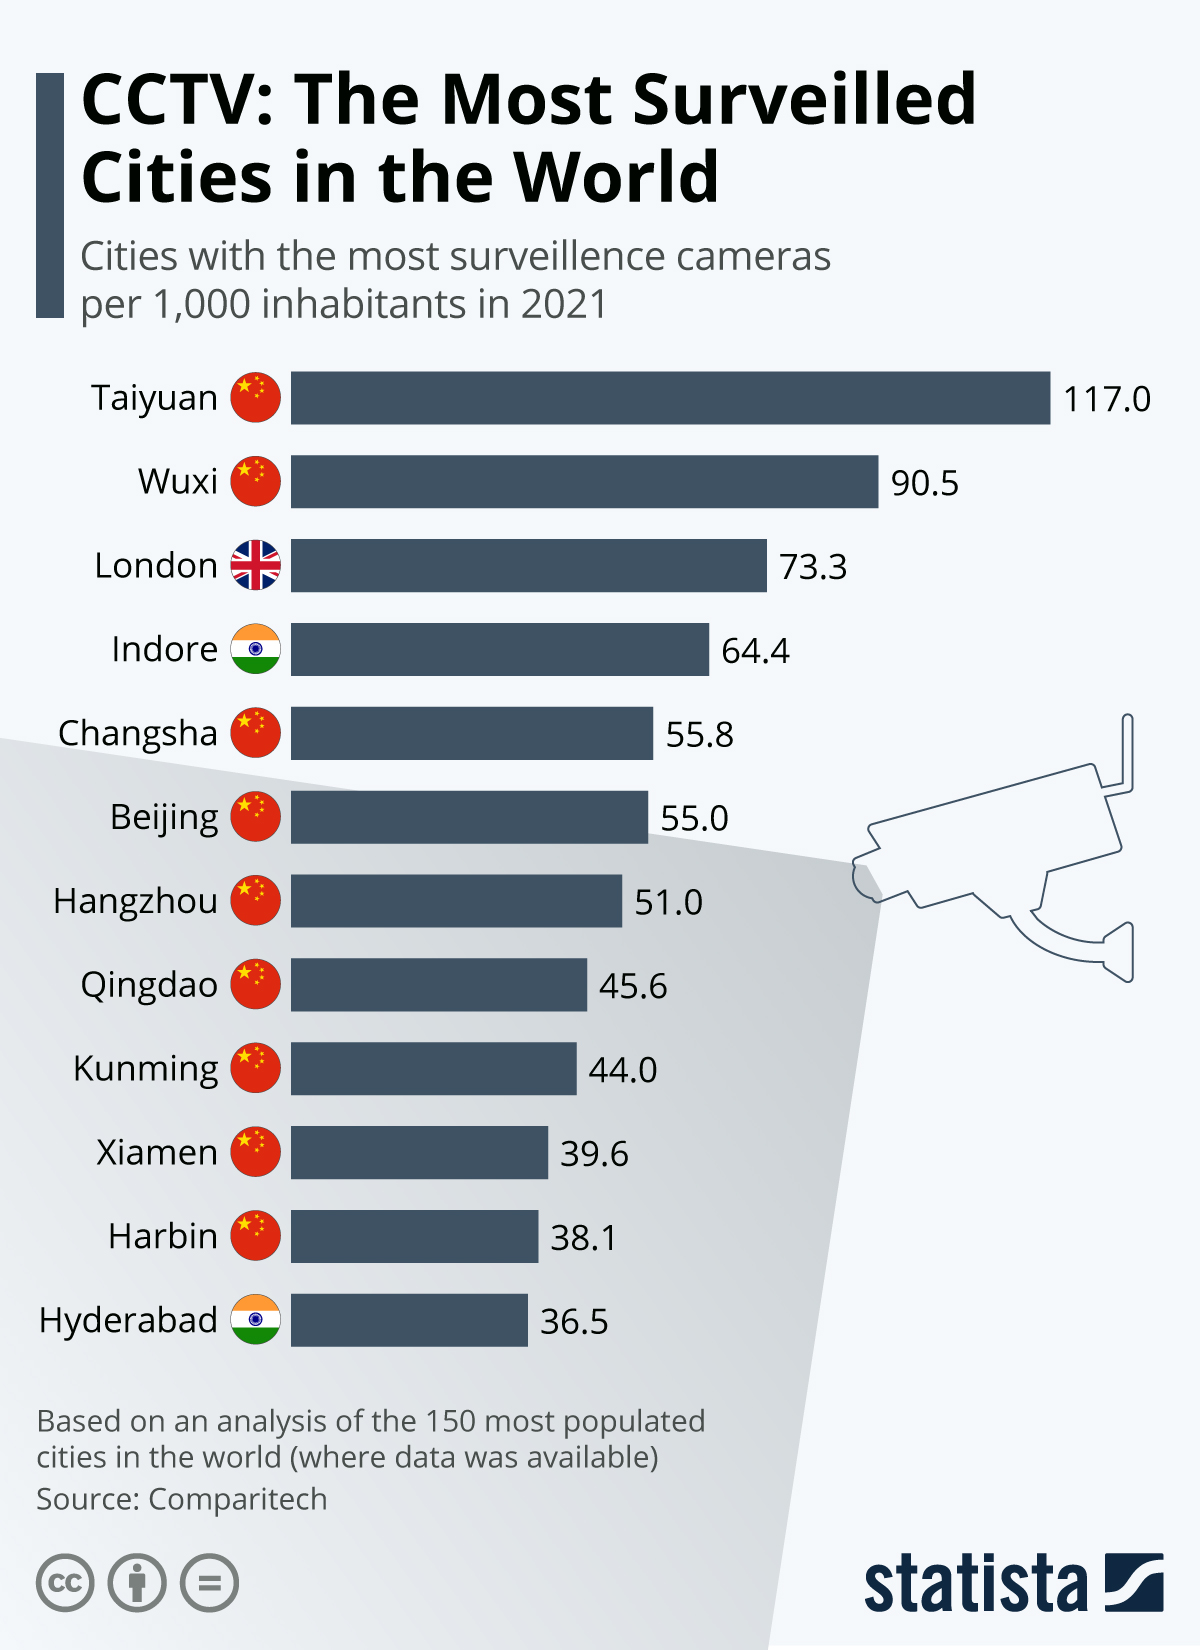
According to a study by research website Comparitech, most of the world's most surveilled cities are located in China. The country has been making headlines for its generous use of surveillance technology and is featured heavily throughout the whole ranking that looked at the 150 most populous cities worldwide, excluding those for which insufficient data was available.

The Chinese city of Taiyuan, located in the Shanxi province roughly 300 miles Southwest of Beijing, tops the list with 120 public CCTV cameras per 1,000 inhabitants. The highest-ranked non-Chinese city is London, also notorious for its strict surveillance of public spaces, with 67 cameras per 1,000 people, with Los Angeles the highest-ranked U.S. city in the ranking with 6 cameras per 1,000 inhabitants.

CCTV technology is controversial in many places around the world, with proponents touting its benefits for fighting crime and opponents cautious about surveillance’s potential to be used as a tool of public control and to violate privacy rights. The makers of the survey said that they found little correlation between lower crime rates or a heightened feeling of security and surveillance in the cities surveyed.Infographic: The Most Surveilled Cities in the World | Statista

Wednesday, April 29, 2020

The State Of World Press Freedom

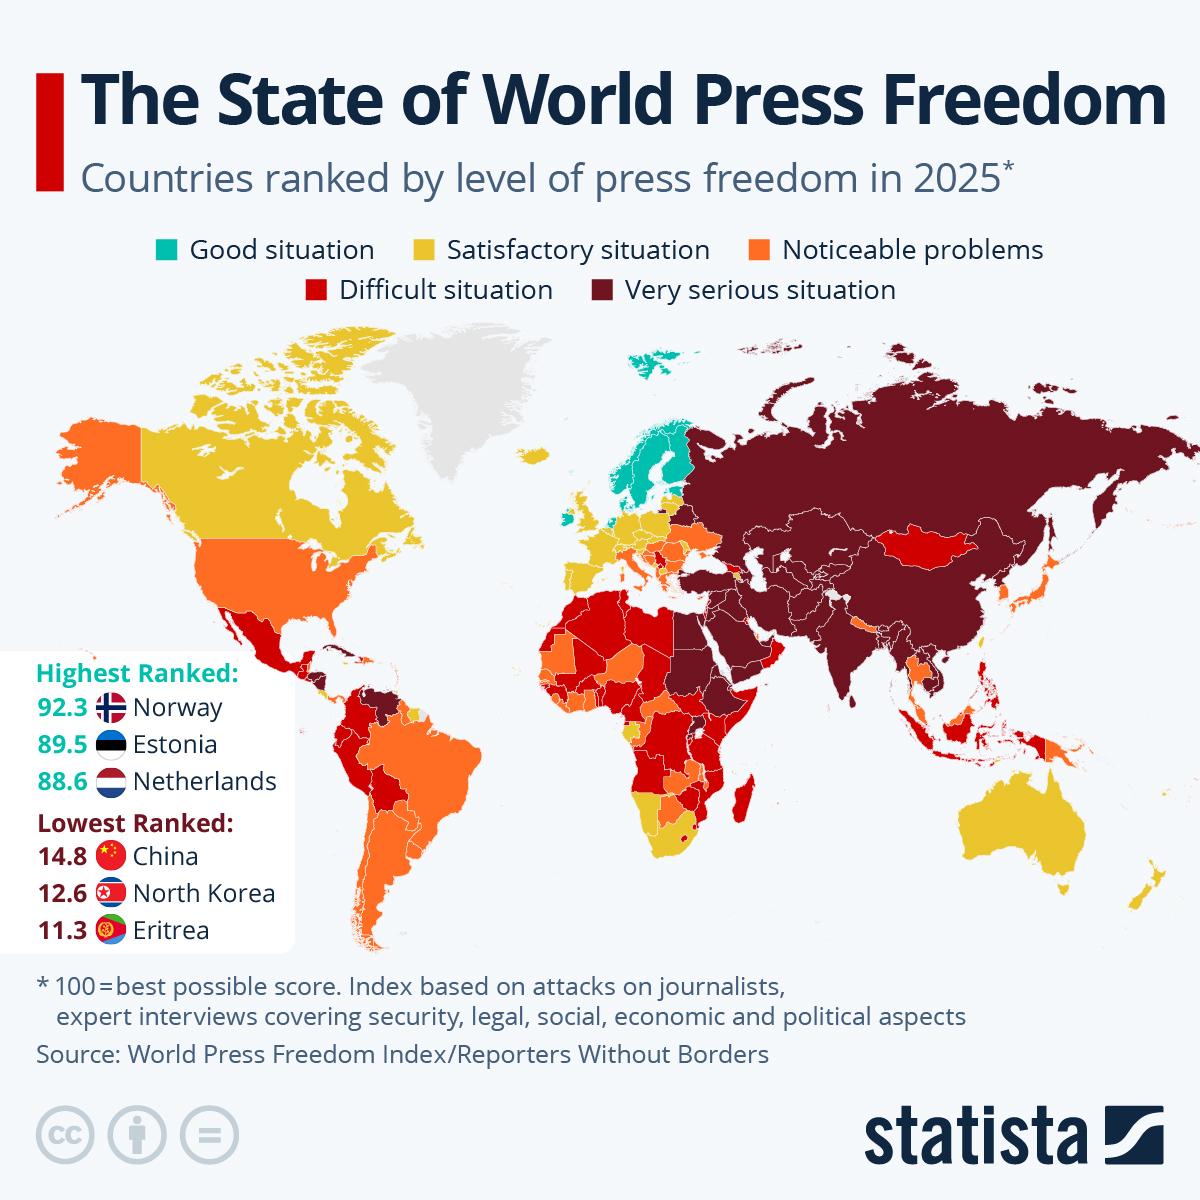
The 2020 World Press Freedom Index, compiled by Reporters Without Borders, was released this week. It states that the next 10 years are going to prove pivotal for press freedom due to five converging factors - geopolitical crisis (driven by aggression from authoritarian regimes), a technological crisis (due to a lack of democratic guarantees), a democratic crisis (due to polarization and repression), a trust crisis (suspicion and hatred of the press) and an economic crisis (impoverishing quality journalism). These are all going to be compounded by the coronavirus pandemic.

The research states that the response to the pandemic has illustrated a clear correlation between levels of media suppression in some countries and their position on the index. Iran and China are key examples who suppressed coverage during their outbreaks and they rank 173rd and 177th respectively. The past two editions of the Global Press Freedom Index called attention to a crisis emerging in some democracies where flagrant attacks on the media and open hostility towards journalists are resulting in more frequent and serious acts of violence that are creating an unprecedented state of fear.

President Trump has displayed repeated and open hostility towards journalists throughout the pandemic and the U.S. only manages 45th position in the index. Brazil is languishing in 107th and its leader, Jair Bolsonaro, has also stepped up steep criticism of his country's media with his cabinet even orchestrating large scale online attacks on journalists. North Korea is rock bottom of the index, followed by Turkmenistan and Eritrea.

Northern Europe has the highest levels of media freedom worldwide and Norway was ranked first. It is followed by Finland and Denmark in the top-three while the top-five is rounded off by Sweden and the Netherlands. The Reporters Without Borders have compiled the index annually since 2002 and levels of press freedom are calculated through a range of indicators such as media independence, transparency, and the media environment in general.
Infographic: The State Of World Press Freedom | Statista

Friday, April 3, 2020

teleabortions in Ireland


Friday, February 21, 2020

Coronavirus Expected to Impact Tech Industry

Considering the fact that most technology companies rely heavily on Chinese manufacturing and components, it doesn’t come as a surprise that industry heavyweights such as Apple and Xiaomi have publicly announced that the COVID-19 outbreak would affect their results for the ongoing quarter. Huawei, also believed to be heavily exposed to the virus’ impact, has not made an announcement yet, the same as market leader Samsung, which some believe could actually benefit from the crisis.

The South Korean electronics giant has moved much of its smartphone production to Vietnam in recent years and pulled the plug on its last mobile phone plant in China in late 2019. Having largely receded from the Chinese market, Samsung will also be less affected by store closures and other demand effects that will impact most of its rivals.

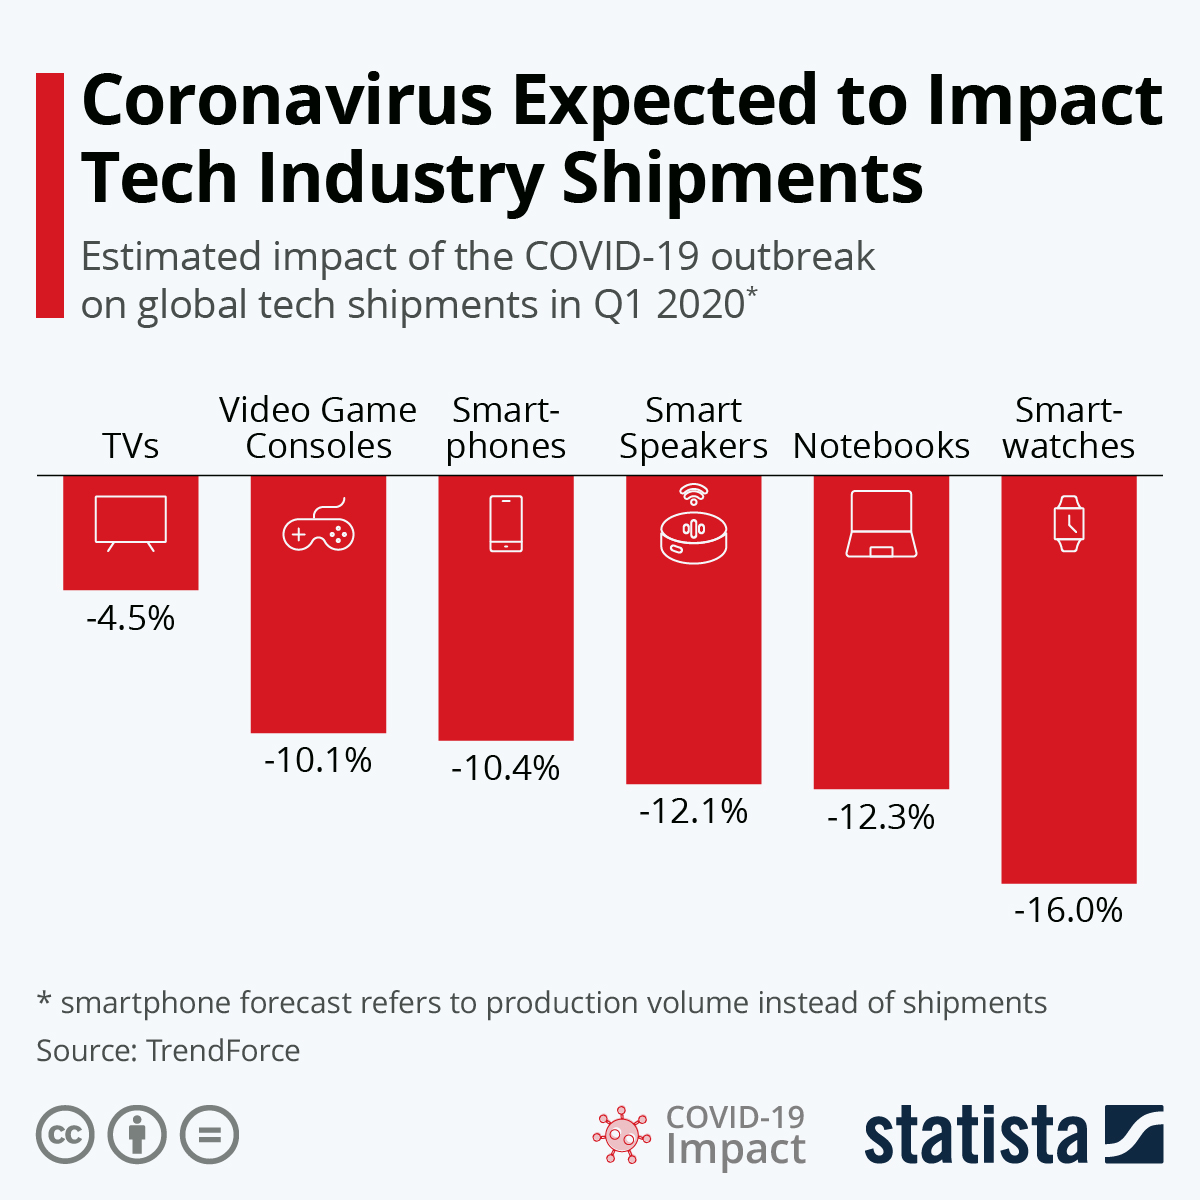
Chinese market research company TrendForce expects global smartphone production in the first quarter to be 10 percent lower than originally expected due to the COVID-19 epidemic. The negative effects on output won’t be limited to the smartphone industry, however, as the following chart shows. Smartwatches, notebooks, smart speakers and video game consoles are all expected to suffer double-digit hits on unit shipments this quarter, with TV shipments expected to be 4.5 percent lower than forecast before the outbreak.
Infographic: Coronavirus Expected to Impact Tech Industry Shipments | Statista

Thursday, January 9, 2020

HIV in TV.ru

гл герой?
мб, не про ВИЧ, а про гендер, или Mariage Story (антифеминистский) 

Пришло в ЖЖ рассылке, рецензия на сериал (выборочно):

Егор Румянцев - звезда популярного сериала про врачей. Он слетает с катушек от успеха: срывает съемки, путается в любовных связях, всем врет. Румянцев чувствует себя неуязвимым и живет для себя, ни во что не ставя чувства других людей. Но в один миг его мир переворачивается. Он узнает, что у него ВИЧ.

Самый отвратительный персонаж сериала - жена брата главного героя.
Настоящая жена российского мужика, беременная мать двоих детей, надежда и опора семьи, подталкивающая мужа к свершениям. Таких мерзейших женщин хочется видеть реже в своем окружении.

Но она такая, каких сейчас миллионы. Актриса отыграла на полную, больше было бы просто нереально. Это даже не роль, это невозможно описать словами.

И молодая е​**нутая наглухо девушка этого самого друга-бизнесмена, влюбленная содержанка двадцати четырех лет. [похоже на соседку снизу]

Сериал о том, насколько мы современные бескомпромиссно безответственны и е**нуты.

И о том, как легко, глупо и непринужденно ВИЧ гуляет по стране.

Это не просто российский сериал, это прорыв в реальности.
И это заслуга всех и каждого, кто писал, снимал, монтировал и кто, конечно же, играл в этом кино.
Это очень-очень больно и очень приятно, он возбуждает и топит одновременно.
Восемь серий о живых, настоящих, безответственных нас.
________
© Екатерина Безымянная

Thursday, January 2, 2020

The Crown

без короля?
Дочь подсадила меня на сериал, не скажу, что особо подсел. но смотрю с любопытством. По первому сезону раз очаровался в королеве, а по второму — обратно полюбил. В частности, за это (в изложении вики):
Vickers wrote that Queen Elizabeth did condemn the Duke of Windsor after she read the Marburg Files, but claimed that the series gave a false implication that the Duke was banished from the royal family upon publication. He remained in contact with his family, and his public appearances continued.
А сегодня наткнулся на архивы, онИ на самом деле открыты. 

Tuesday, December 10, 2019

GroupM estimates the face

According to new estimates from GroupM, the world’s largest advertising media company, the U.S. advertising market is poised for further growth in the next few years. GroupM expects ad revenue to grow to $281 billion a year by 2024, up from $227 billion this year. Unsurprisingly, the increase will mainly be driven by a steep rise in online advertising sales, which are expected to grow by $60 billion between 2019 and 2024.

Fortunately for traditional media outlets, in this case, TV and radio broadcasters, advertising is not a zero-sum game and a dollar spent online is not necessarily pried away from a struggling radio station. In fact, both TV and radio advertising revenues are expected to remain more or less at the same level through 2024 with minimal ups and downs along the way. The same cannot be said of print adverts, which are expected to continue their sharp decline.
Infographic: The Changing Face of the U.S. Advertising Landscape | Statista
телевизор жив

Sunday, December 8, 2019

in a fridge

Averaging almost 8 hours a day, people around the world spend more time-consuming media than ever before. That’s according to Zenith's latest Media Consumption Forecast, published earlier this year, which shows an interesting trend in media consumption.

For decades, TV was the undisputed number 1 in terms of daily media usage, and it still is if desktop and mobile internet usage are counted separately. If you combine the two, however, total internet consumption is expected to exceed TV consumption for the first time this year.

According to Zenith, daily mobile internet consumption will amount to 130 minutes per day, up from just 80 minutes in 2015. Adding 40 minutes of desktop internet use, total internet use is expected to amount to 170 minutes per day this year, compared to 167 minutes of daily TV viewing. In line with the old advertising adage “money follows eyeballs”, online advertising expenditure is also on the rise and, according to Zenith, surpassed TV ad spending for the first time in 2017.

Please note that time spent with television only includes time with traditionally broadcast channels and stations in this case. According to Zenith time spent with online platforms owned by broadcasters is counted as internet consumption.
Infographic: 2019 Marks an Inflection Point in Media Consumption | Statista Гвельфы и Гиббелины со времённозди

Thursday, July 4, 2019

Does the news reflect what we die from?

This blog post draws on data and research discussed in our entry on Causes of Death.


One of the primary motivations for our work at Our World in Data is to provide a fact-based overview of the world we live in — a perspective that includes the persistent and long-term changes that run as a backdrop to our daily lives. We aim to provide the complement to the fast-paced reporting we see in the news. The media provides a near-instantaneous snapshot of single events; events that are, in most cases, negative. The persistent, large-scale trends of progress never make the headlines.
But is there evidence that such a disconnect exists between what we see in the news and what is reality for most us?
One study attempted to look at this from the perspective of what we die from: is what we actually die from reflected in the media coverage these topics receive?1 To answer this, Shen and his team compared four key sources of data:
For each source the authors calculated the relative share of deaths, share of Google searches, and share of media coverage. They restricted the considered causes to the top 10 causes of death in the US and additionally included terrorism, homicide, and drug overdoses. This allows for us to compare the relative representation across different sources.2

What we die from; what we Google; what we read in the news

So, what do the results look like? In the chart below I present the comparison.
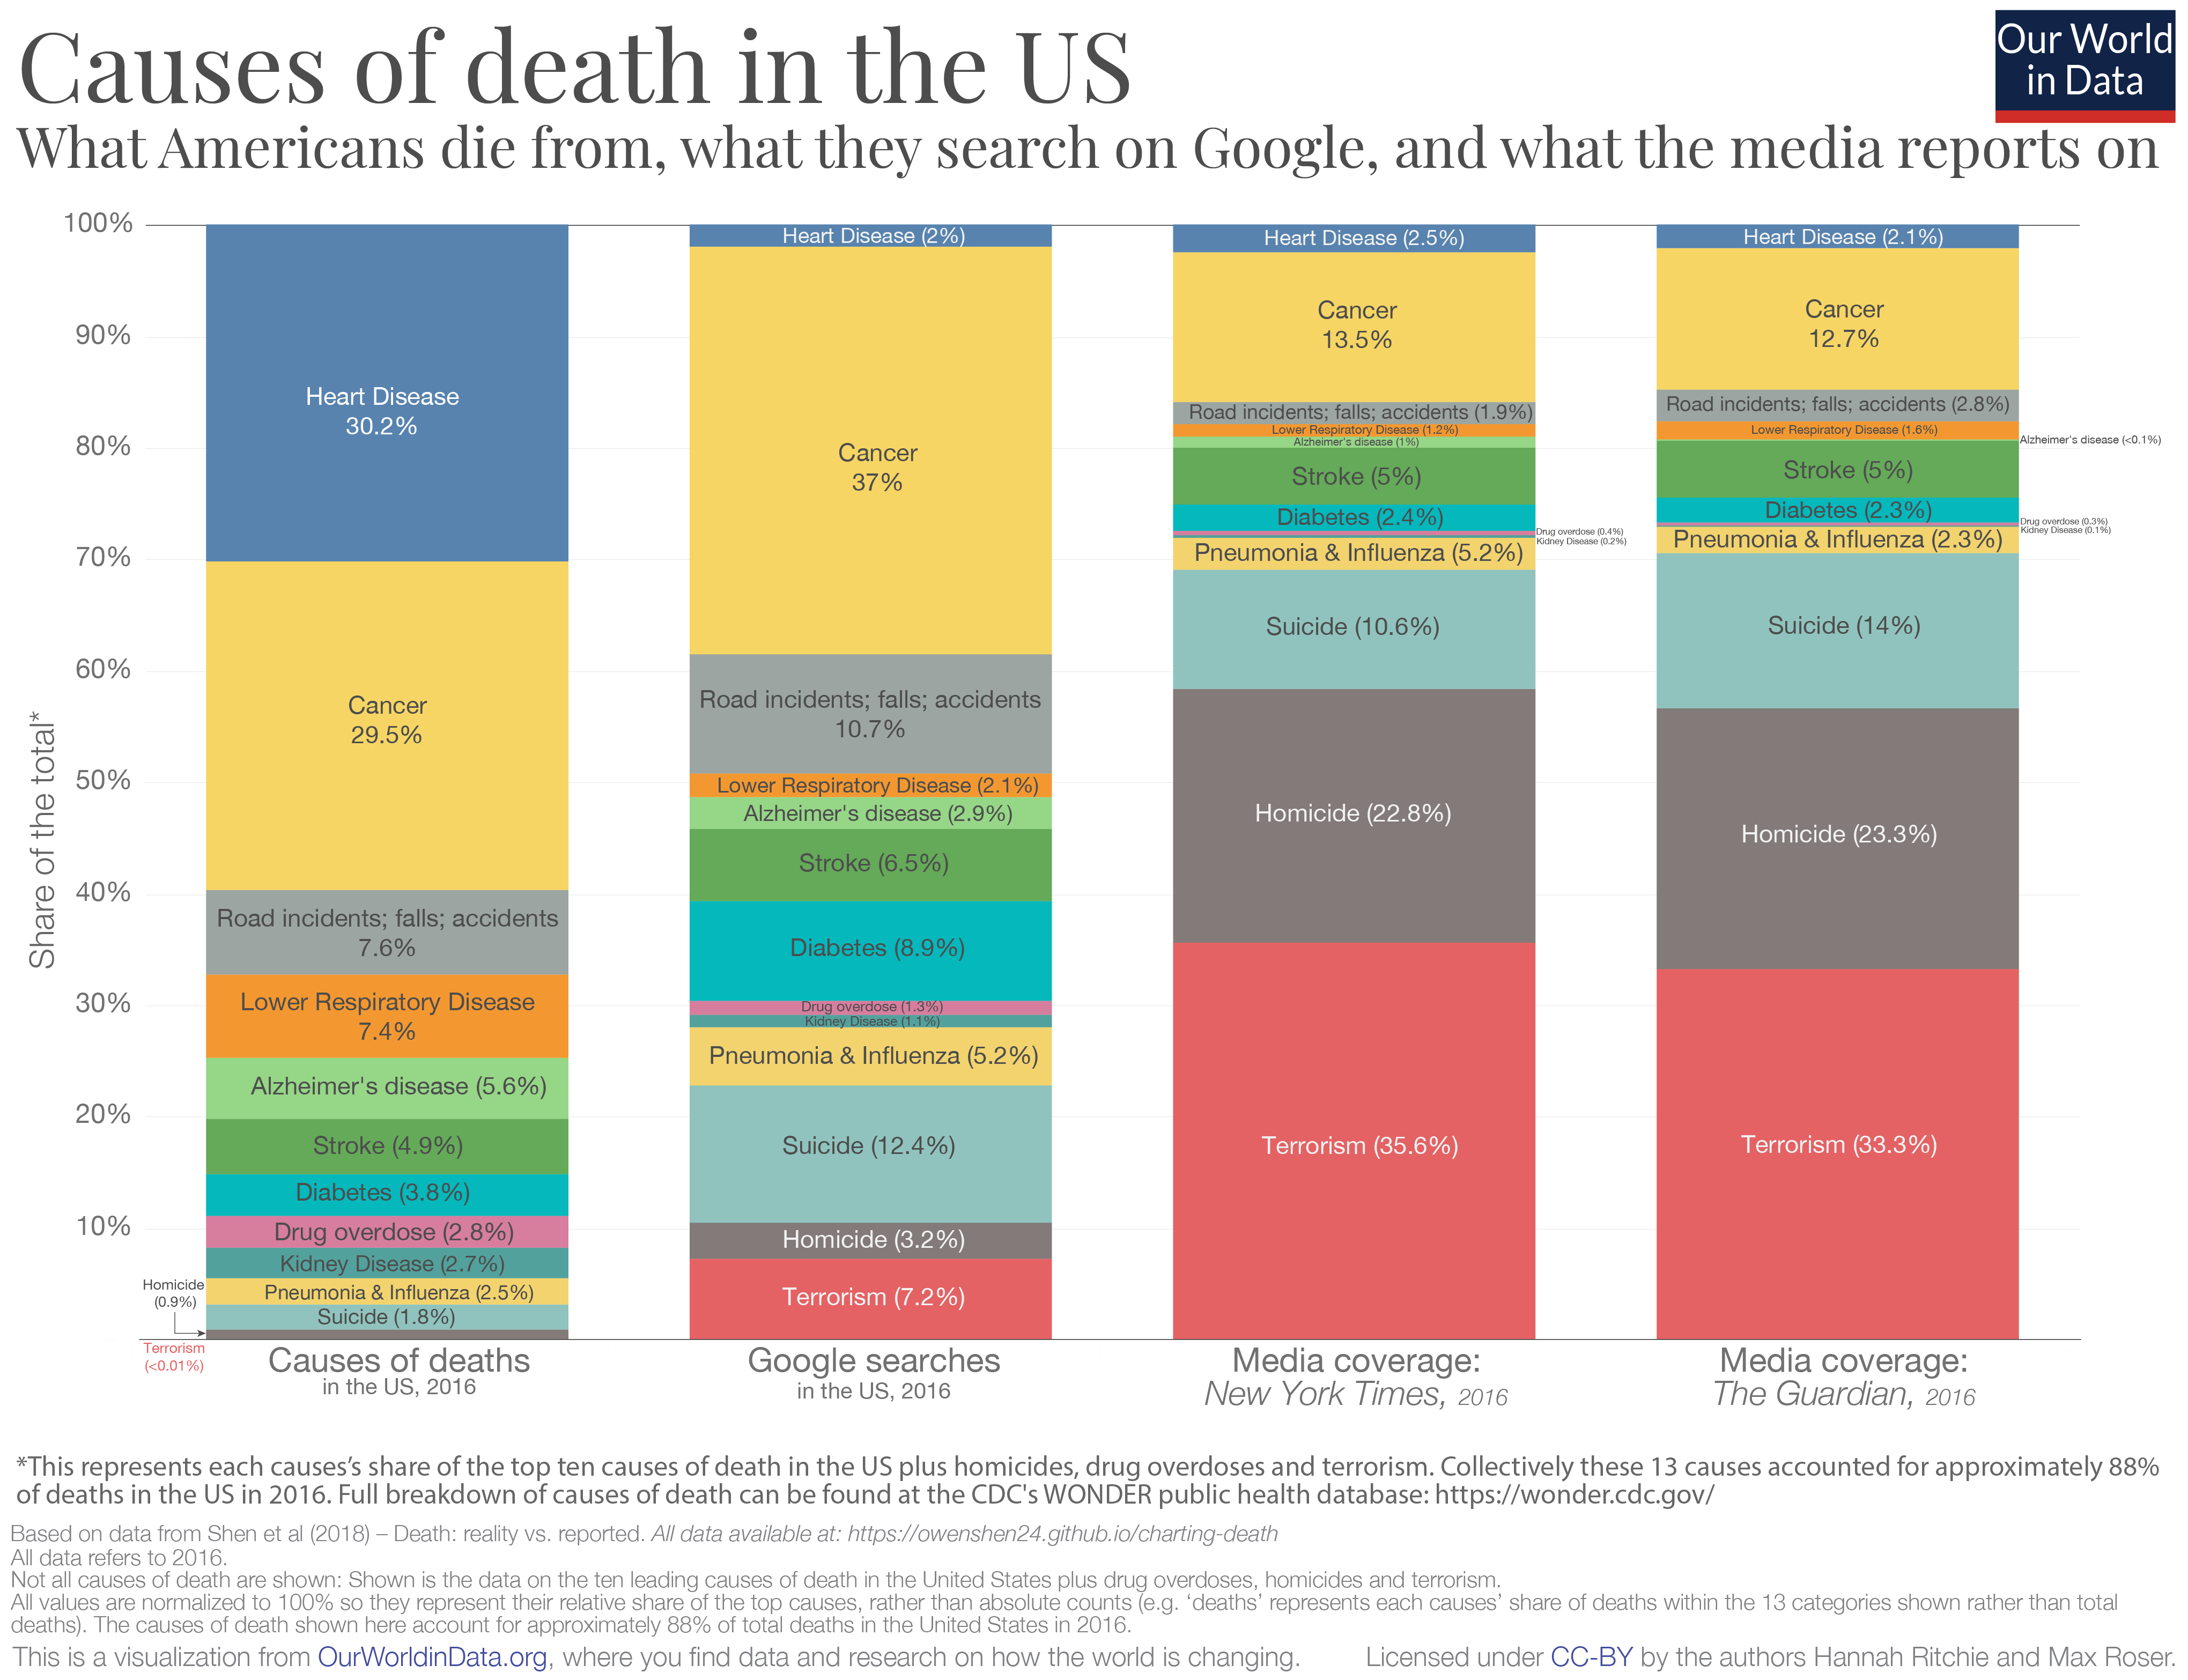
The first column represents each cause's share of US deaths; the second the share of Google searches each receives; third, the relative article mentions in the New York Times; and finally article mentions in The Guardian.
The coverage in both newspapers here is strikingly similar. And the discrepancy between what we die actually from and what we get informed of in the media is what stands out:
  • around one-third of the considered causes of deaths resulted from heart disease, yet this cause of death receives only 2-3 percent of Google searches and media coverage;
  • just under one-third of the deaths came from cancer; we actually google cancer a lot (37 percent of searches) and it is a popular entry here on our site; but it receives only 13-14 percent of media coverage;
  • we searched for road incidents more frequently than their share of deaths, however, they receive much less attention in the news;
  • when it comes to deaths from strokes, Google searches and media coverage are surprisingly balanced;
  • the largest discrepancies concern violent forms of death: suicide, homicide and terrorism. All three receive much more relative attention in Google searches and media coverage than their relative share of deaths. When it comes to the media coverage on causes of death, violent deaths account for more than two-thirds of coverage in the New York Times and The Guardian but account for less than 3 percent of the total deaths in the US.
What's interesting is that Americans search on Google is a much closer reflection of what kills us than what is presented in the media. One way to think about it is that media outlets may produce content that they think readers are most interested in, but this is not necessarily reflected in our preferences when we look for information ourselves.
[Clicking on the visualization below will open it in higher resolution; The chart shows the summary for the year 2016, but interactive charts for all available years is available at the end of this blog.3]
Causes of death in usa vs. media coverage

How over- or underrepresented are deaths in the media?

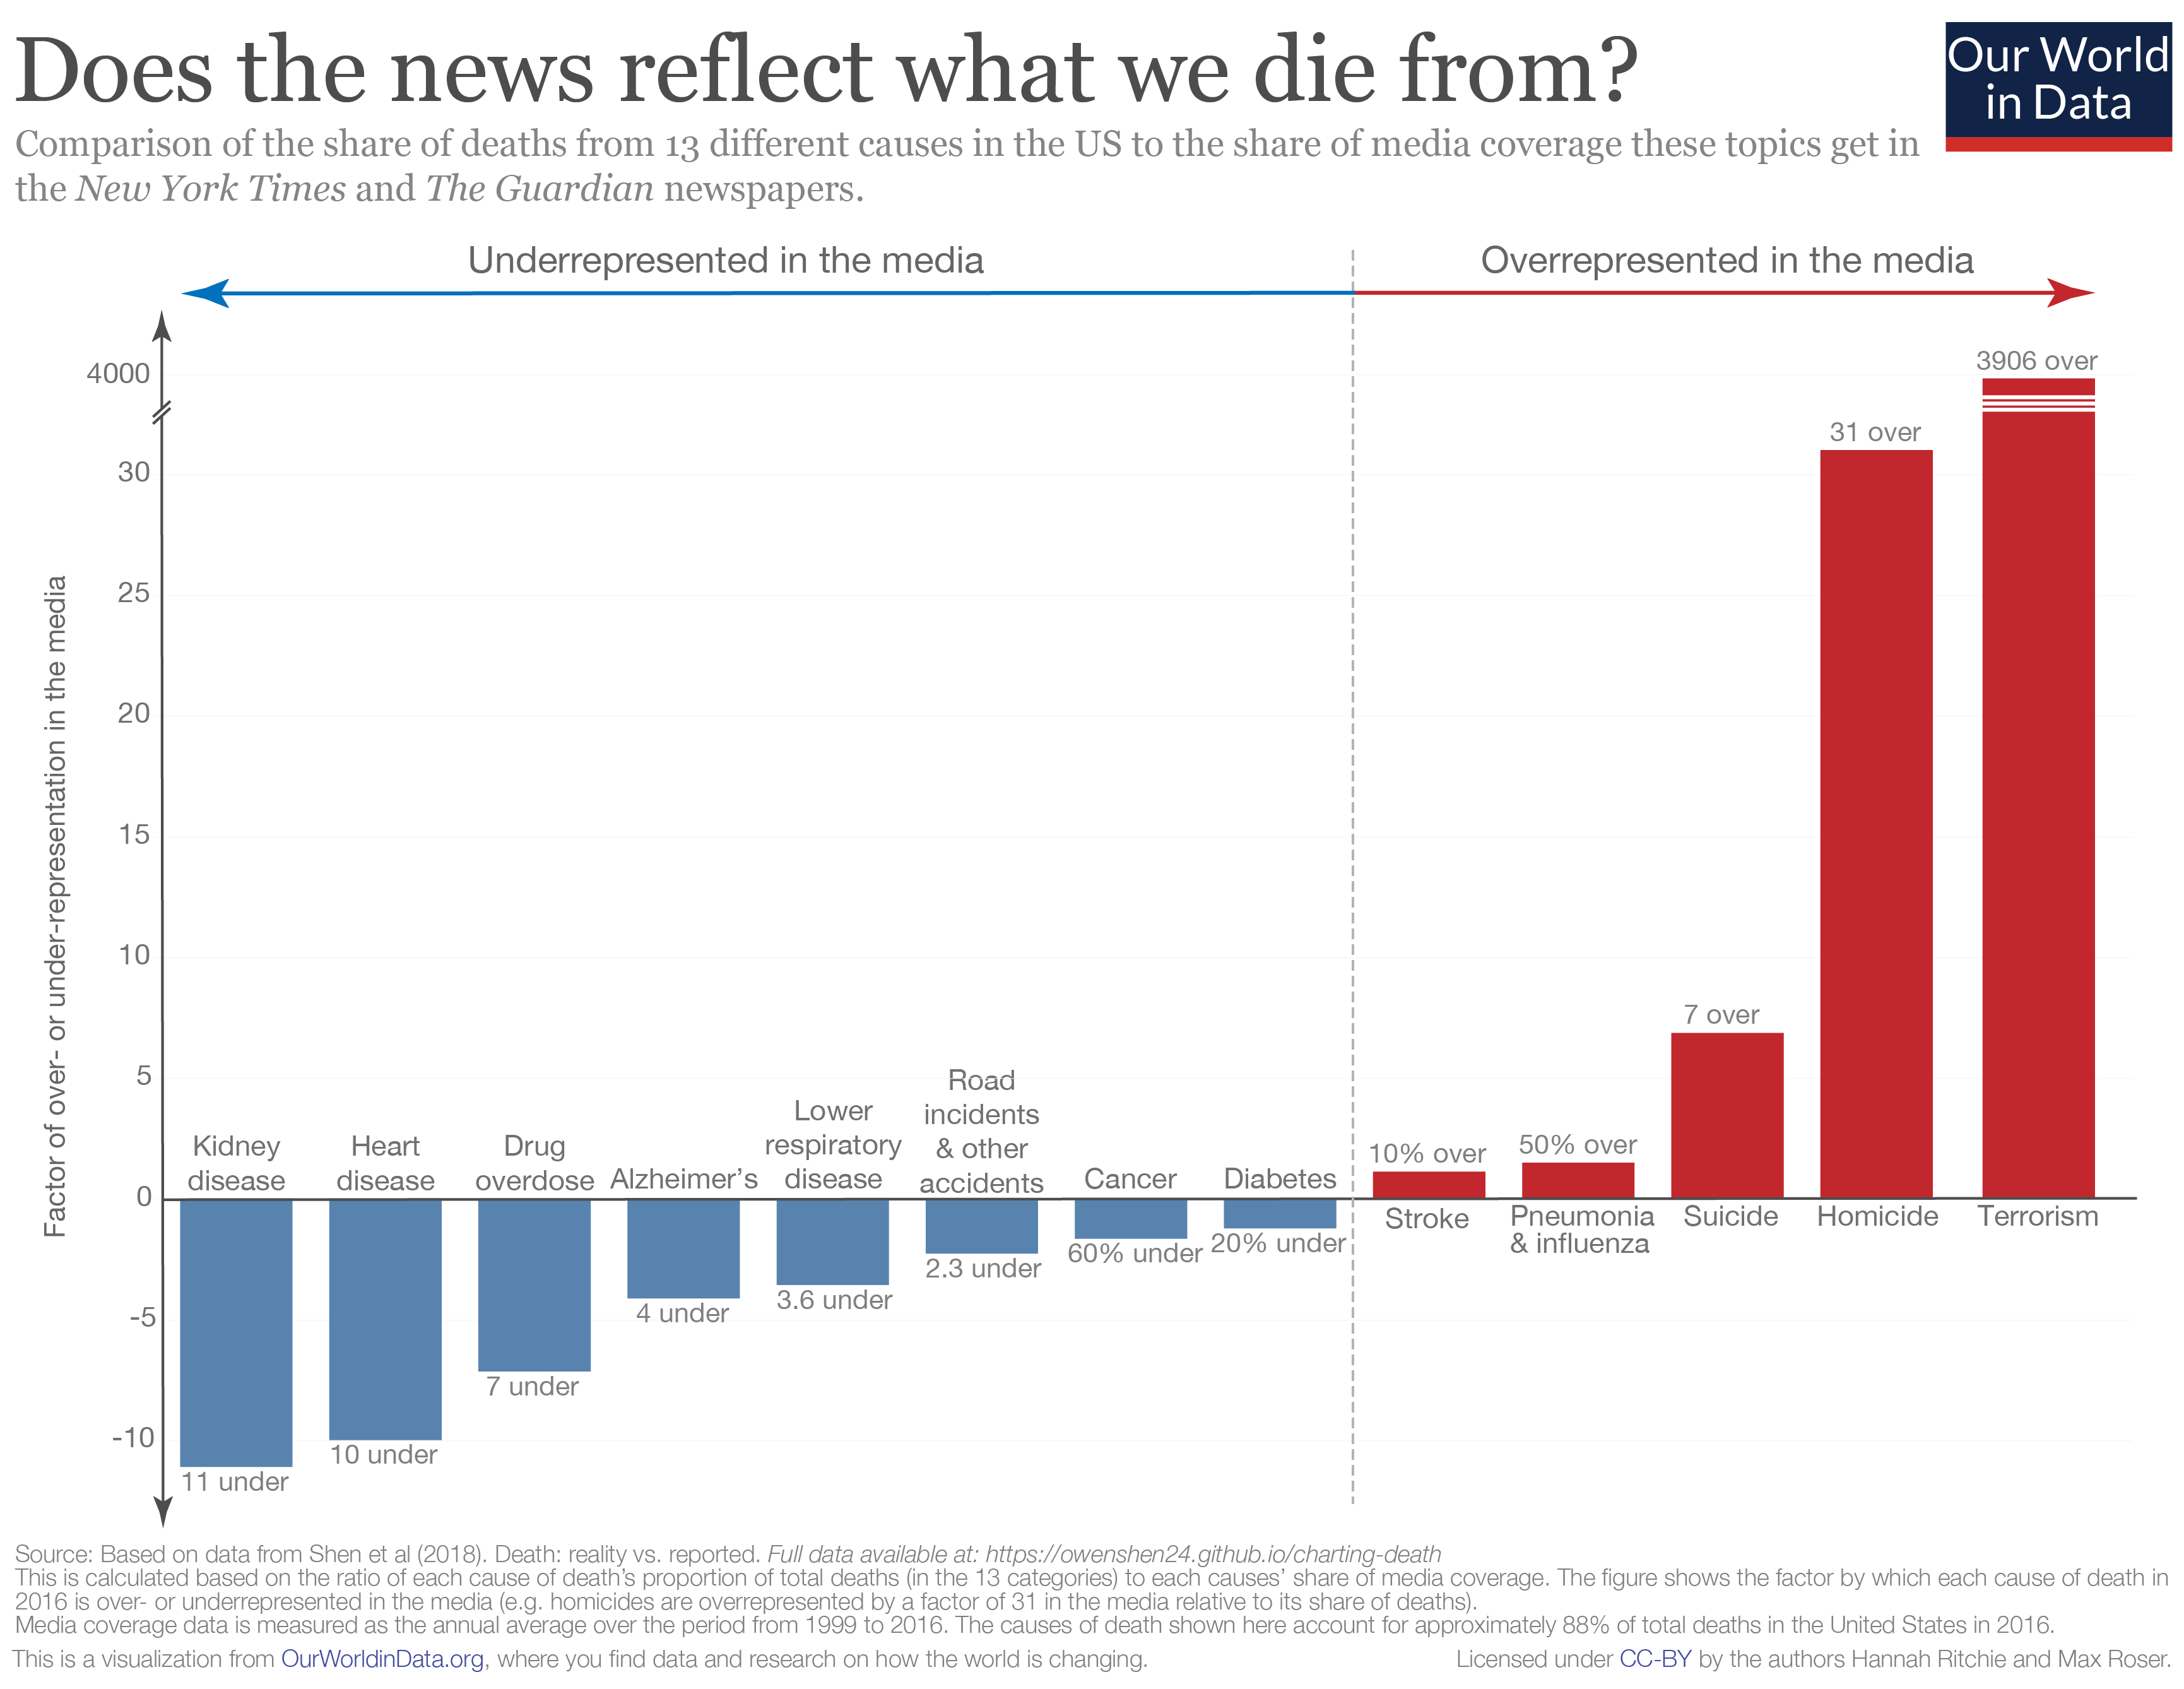
As we can see clearly from the chart above, there is a disconnect between what we die from, and how much coverage these causes get in the media. Another way to summarize this discrepancy is to calculate how over- or underrepresented each cause is in the media. To do this, we simply calculate the ratio between the share of deaths and share of media coverage for each cause.
In the chart below we see how over- or underrepresented each cause is in newspaper coverage.4 Causes shown in red are overrepresented in the media; those in blue are underrepresented. Numbers denote the factor by which they are misrepresented.
The major standout here – I had to break the scale on the y-axis since it's several orders of magnitude higher than everything else – is terrorism: it is overrepresented in the news by almost a factor of 4000.
Homicides are also very overrepresented in the news, by a factor of 31. The most underrepresented in the media are kidney disease (11-fold), heart disease (10-fold), and, perhaps surprisingly, drug overdoses (7-fold). Stroke and diabetes are the two causes most accurately represented.
[Clicking on the visualization below will open it in higher resolution].
Over and underrepresentation of deaths in media

Should media exposure reflect what we die from?

From the comparisons above, it's clear that the news doesn't reflect what we die from. But there is another important question: should these be representative?
There are several reasons we would, or should, expect that what we read online, and what is covered in the media wouldn't correspond with what we actually die from.
The first is that we would expect there to be some preventative aspect to information we access. There's a strong argument that things we search for and gain information on encourages us to take action which prevents a further death. There are several examples where I can imagine this to be true. People who are concerned about cancer may search online for guidance on symptoms and be convinced to see their doctor. Some people with suicidal thoughts may seek help and support online which later results in an averted death from suicide. We'd therefore expect that both intended or unintended exposure to information on particular topics could prevent deaths from a given cause. Some imbalance in the relative proportions therefore makes sense. But clearly there is some bias in our concerns: most people die from heart disease (hence it should be something that concerns us) yet only a small minority seek [possibly preventative] information online.
Second, this study focused on what people in the USA die from, not what people across the world die from. Is media coverage more representative of global deaths? Not really. In another blog post, 'What does the world die from?', I looked in detail at the ranking of causes of death globally and by country. The relative ranking of deaths in the USA is reflective of the global average: most people die from heart disease and cancers, and terrorism ranks last or second last (alongside natural disasters). Terrorism accounted for 0.06 percent of global deaths in 2016. Whilst we'd expect non-US events to feature in the New York Times, global news shouldn't substantially affect representative coverage of causes.
The third relates to the very nature of news: it focuses on events and stories. Whilst I am often critical of the messages and narratives portrayed in the media, I have some sympathy for what they choose to cover. Reporting has become increasingly fast-paced. As news consumers, our expectations have quickly shifted from daily, to hourly, down to minute-by-minute updates of what's happening in the world. Combine this with our attraction to stories and narratives. It's not surprising that the media focuses on reports of single (inadvertently negative) events: a murder case or a terrorist attack. The most underrepresented cause of death in the media was kidney disease. But with an audience that expects a minute-by-minute feed of coverage, how much can possibly be said about kidney disease? Without conquering our compulsion for the latest unusual story, we cannot expect this representation to be perfectly balanced.

How to combat our bias for single events

Media and its consumers are stuck in a reinforcing cycle. The news reports on breaking events, which are often based around a compelling story. Consumers want to know what's going on in the world we are quickly immersed by the latest headline. We come to expect news updates with increasing frequency, and media channels have clear incentives to deliver. This locks us into a cycle of expectation and coverage with a strong bias for outlier events. Most of us are left with a skewed perception of the world; we think the world is much worse than it is.5
The responsibility in breaking this cycle lies with both media producers and consumers. Will we ever stop reporting and reading the latest news? Unlikely. But we can all be more conscious of how we let this news shape our understanding of the world.
And journalists can do much better in providing context of the broader trends: if reporting on a homicide, for example, include context of how homicide rates are changing over time.6 As media consumers we can be much more aware of the fact that relying on the 24/7 news coverage alone is wholly insufficient for understanding the state of the world. This requires us to check our (often unconscious) bias for single narratives and seek out sources that provide a fact-based perspective on the world.
This antidote to the news is what we try to provide at Our World in Data. It should be accessible for everyone, which is why our work is completely open-access. Whether you are a media producer or consumer, feel free to take and use anything you find here.


Additional information:

Shares of deaths, media coverage and Google searches over time
The interactive charts below present the full annual data series published by Shen et al. (2018), and summarised above, on the relative share of deaths in the US, Google searches and New York Times (NYT) and The Guardian media coverage across the 13 cause of death categories. For share of deaths, NYT and The Guardian coverage, data extends from 1999 to 2016. Due to data availability Google Trends data only runs from the year 2004 to 2016.
19992000200220042006200820102012201420160%20%40%60%80%100%TerrorismHomicideSuicidePneumonia &influenzaKidney diseaseDrug overdoseDiabetesStrokeAlzheimer'sDiseaseLower respiratorydiseaseAccidentsCancerHeart disease
20042006200820102012201420160%20%40%60%80%100%Kidney diseaseDrug overdoseHeart diseaseLower respiratorydiseaseAlzheimer'sDiseaseHomicidePneumonia &influenzaStrokeTerrorismDiabetesAccidentsSuicideCancer
19992000200220042006200820102012201420160%20%40%60%80%100%Kidney diseaseDrug overdoseAlzheimer'sDiseaseLower respiratorydiseaseAccidentsHeart diseaseDiabetesPneumonia &influenzaStrokeSuicideCancerHomicideTerrorism
19992000200220042006200820102012201420160%20%40%60%80%100%Alzheimer'sDiseaseKidney diseaseDrug overdoseLower respiratorydiseaseHeart diseaseDiabetesPneumonia &influenzaAccidentsStrokeCancerSuicideHomicideTerrorism