Showing posts with label образование. Show all posts

Friday, September 20, 2024

slurp cabbage soup with a bast shoe

slurp cabbage soup with a bast shoe

Учителям школ запретят употреблять термины «семейное насилие», «толерантность» и «буллинг».


Эти понятия будут исключены из всех школьных программ с 1 сентября 2025 года. Также из школ уберут западные виды спорта вроде гольфа и чирлидинга. Новые изменения в Минпросвещения объяснили возвратом системы образования к «национальному идеалу».

Thursday, August 15, 2024

migration

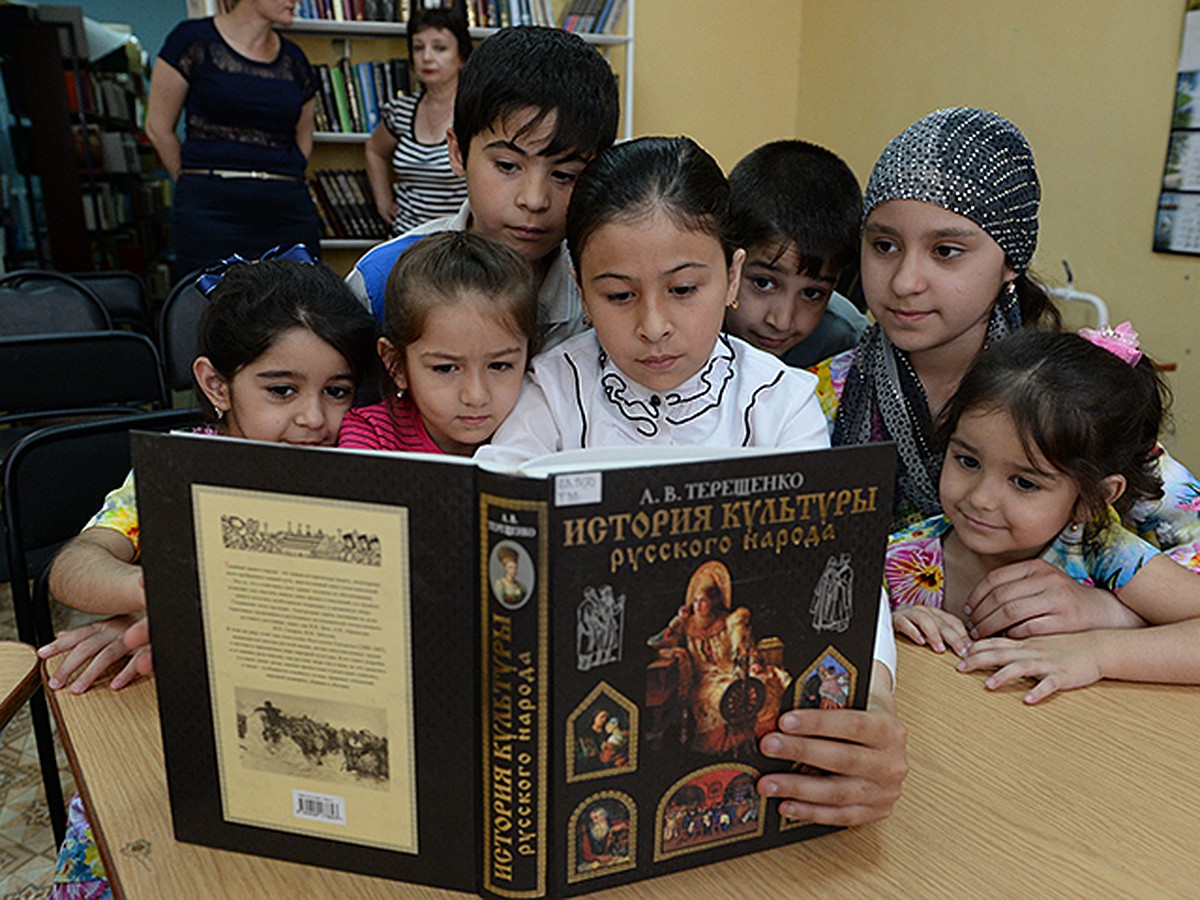
Дети мигрантов испытывают проблемы с русским языком в школе

При этом они достаточно дисциплинированны и коммуницируют с другими детьми

Анастасия Майер

Дети мигрантов значительно различаются по уровню знания русского языка и школьных предметов, что требует индивидуального подхода/ Денис Абрамов / Ведомости

Почти 53% учителей отметили, что у детей мигрантов наблюдаются проблемы с владением русским языком, а также с освоением общеобразовательных предметов. Об этом говорится в результатах социологического исследования Центра экономики непрерывного образования ИПЭИ РАНХиГС. В нем приняли участие 2064 педагога школ, расположенных в региональных столицах, городских и сельских поселениях Новгородской, Челябинской и Ярославской областей.

Еще 42% опрошенных педагогов отмечают, что проблем с русским языком у детей мигрантов скорее нет, еще 5,5% затруднились с ответом. Разделились мнения учителей и по поводу освоения детьми общеобразовательных предметов: 49,5% опрошенных считают, что проблема скорее есть, 47% – что ее нет (еще 4% затруднились ответить). Подавляющее большинство респондентов (80%) считают, что у детей мигрантов нет проблем с дисциплиной, в противовес 15% других опрошенных педагогов. 70% также отмечают, что у детей нет проблем с общением, еще 22,2% указывают, что они есть (8,2% затруднились ответить).

Эксперты также выработали ряд рекомендаций учебным заведениям: например, организовать очные и дистанционные курсы по русскому языку как иностранному на базе школ, увеличить выпуск из вузов учителей, обучающих иностранцев русскому языку. Помимо этого они предложили создать и продвигать электронные образовательные ресурсы (включая приложения для смартфонов) для обучения русскому языку, а также повысить доступность дополнительных занятий для детей в целях их культурной адаптации и мягкого погружения в языковую среду в организациях дополнительного образования.

Численность детей мигрантов (лиц, имеющих иностранное гражданство или без гражданства) в школах в 2023 г. составила около 181 500 человек. Сюда входит 178 900 человек (98,6%) с иностранным гражданством и 2600 (1,4%) – без гражданства.

Автор исследования, ведущий научный сотрудник Центра экономики непрерывного образования РАНХиГС Алексей Тищенко указывает, что дети мигрантов значительно различаются по уровню знания русского языка и школьных предметов, что требует индивидуального подхода. Как правило, школы самостоятельно определяют и реализуют меры по работе с детьми-мигрантами с учетом своих возможностей. По словам Тищенко, первоочередной задачей школы является оценка необходимости индивидуального сопровождения таких обучающихся и его формата. Для этого может быть проведен психолого-педагогический консилиум, в задачи которого входит выявление трудностей в освоении образовательных программ, особенностей в развитии, социальной адаптации и поведении обучающихся.

Работа с детьми-мигрантами – это весомая дополнительная организационная и педагогическая нагрузка на школу, которую сложно оценить в связи с различными образовательными, социокультурными и психологическими характеристиками таких обучающихся, включая их дисциплинированность, способность к обучению, скорость адаптации», – указал он. При этом школьных ресурсов может быть недостаточно для полноценной работы с детьми-мигрантами: в некоторых учебных заведениях наблюдается дефицит кадров, заключил эксперт.

Дети мигрантов не должны быть ограничены в правах по сравнению с российскими детьми, говорил ранее «Ведомостям» председатель комитета Госдумы по делам СНГ Леонид Калашников (КПРФ). «Учитывая то, что они в силу объективных причин хуже знают русский язык, вполне допускаю, что лучше было бы их обучать бесплатно, но надо провести экономические подсчеты, учитывая общее число детей и то, что многие мигранты находятся в тени», – сказал он. Этот вопрос может быть отражен в разрабатываемом законе о миграции, который сейчас находится в правительстве, предположил Калашников, уточнив, что комитет пока не работал с этим документом.

В ноябре 2023 г. министр просвещения РФ Сергей Кравцов на парламентских слушаниях в Совете Федерации заявил, что в российских школах появится диагностика на уровень владения русским языком для детей мигрантов, по ее результатам для школьников могут ввести курсы русского. Кравцов добавил, что по ее результатам школьникам могут добавить дополнительные часы для изучения русского языка или назначить им курсы в рамках внеурочной деятельности или дополнительного образования. «Ведомости» направили запрос в Минпросвещения.

Если дети начинают учиться в школах с 1–2-го класса в России, то, даже если они плохо владеют русским языком, они достаточно быстро приспособятся, отмечает председатель совета Таджикского культурного центра Хуршеда Хамракулова. Дети сначала неактивно пользуются языком, но к 3–4-му классу начинают отлично им владеть и хорошо учиться. По ее словам, главное в этом процессе – хорошее отношение к ним в классе, а также внимательное отношение со стороны учителей и родителей. «Трудности могут возникнуть, когда ребенок совсем не знает языка и начинает сразу учиться в 8–9-м классе. Это сложнее: чем старше ребенок, тем сложнее ему освоить язык», – добавила она.

Где больше всего детей мигрантов


Топ-10 регионов, где обучаются в школах дети-мигранты

Московская область (3,2%)
Калужская область (2,8%)
Москва (2,7%)
Санкт-Петербург (2,7%)
Ленинградская область (2,1%)
Сахалинская область (1,7%)
Ханты-Мансийский автономный округ (1,5%)
Владимирская область (1,4%)
Свердловская область (1,4%)
Красноярский край (1,4%)

Среди регионов с минимальными показателями оказались следующие: Хакасия (0,11%), Архангельская область (0,11%), Калмыкия (0,10%), Дагестан (0,10%), Марий Эл (0,07%), Чувашия (0,06%), Ингушетия (0,06%), Чечня (0,06%), Республика Алтай (0,06%), Тува (0,00%).
Sunday, July 28, 2024

us education

Иностранные студенты в США


Сейчас в США учится больше миллиона студентов из других стран - чаще всего из Китая, Индии (в сумме эти две страны дают больше половины от общего числа иностранных студентов в США!) и других стран Азии (ещё четверть)

Когда-то давно, в 1960-ых, картина была другой: лидировали те самые другие страны Азии (надо думать, Япония?), Китая практически не было, а вот жители других стран Америки учились в США очень активно: их было порядка трети от общего числа (а не 10%, как сейчас)

Россияне, кстати, продолжают довольно активно учиться в США: сейчас там находится 4.9 тысячи студентов из нашей страны! Это, конечно, вдвое меньше, чем из Германии, но вполне себе на уровне Греции, Норвегии, Швеции или Австралии!Иностранные студенты в США

Сейчас в США учится больше миллиона студентов из других стран - чаще всего из Китая, Индии (в сумме эти две страны дают больше половины от общего числа иностранных студентов в США!) и других стран Азии (ещё четверть)

Когда-то давно, в 1960-ых, картина была другой: лидировали те самые другие страны Азии (надо думать, Япония?), Китая практически не было, а вот жители других стран Америки учились в США очень активно: их было порядка трети от общего числа (а не 10%, как сейчас)

Россияне, кстати, продолжают довольно активно учиться в США: сейчас там находится 4.9 тысячи студентов из нашей страны! Это, конечно, вдвое меньше, чем из Германии, но вполне себе на уровне Греции, Норвегии, Швеции или Австралии!

Monday, July 22, 2024

educational gradient of period fertility

A new method for measuring the educational gradient of period fertility in Europe


Angela Greulich and Laurent Toulemon present a new method for measuring the educational gradient of fertility for women who are at childbearing age rather than for women who have already completed their reproductive years, enabling a timely analysis of within-country differentials of period fertility behavior.


Introduction


After a period of increase during the decades 1990-2010, fertility is currently stagnating or decreasing in many European countries. As its levels and trends have multiple social and economic impacts, understanding their drivers at the micro level is of paramount importance. However, while European cross-country differences in total fertility rates (TFR) are well-documented, a comprehensive overview of within-country differentials is currently lacking. Measures of fertility differentiated by education have so far been mostly based on a completed cohort approach, and they show a negative educational gradient in most European countries (Sobotka 2020, Nisén et al. 2021). This implies that it was mainly higher educated women who were deciding to limit their fertility 10 to 20 years ago in Europe, mostly due to incompatibilities between work and family. The focus, in other words, is on cohorts whose fertility decisions were affected by past, not current, circumstances and policies.

Furthermore, as studies on socioeconomic differentials of period fertility behavior are often parity-specific (see for example Klesment et al. 2014, d’Albis et al. 2017, Trimarchi and van Bavel 2019), we do not know exactly which subgroups currently have the lowest fertility levels within European countries, and to what extent these subgroups contribute to the dampening of totalfertility rates in each country.
 

Fertility by age, parity and education using UE-SILC Data


In a recent publication (Greulich and Toulemon 2023), we proposed a new method of exploiting annual European survey data to accurately measure period fertility levels by education for 24 EU and four non-EU countries in Europe. Our data are those of the European Union Survey of Income and Living Conditions, EU-SILC (available on the Eurostat website; Eurostat 2020), based on large national individual samples, collected on a yearly basis, with a four-year follow-up. Respondents are not asked directly about their fertility in the questionnaire, but it can be estimated by combining the own-children method (children ever born at age 25) with a semi-retrospective approach to derive the parity-specific fertility behavior of women of higher childbearing ages (De Santis et al. 2014), while at the same time recording their educational level. Bayesian statistics allow us to obtain credible intervals for the age-, education- and parity-specific birth probabilities for each country. These birth probabilities are then combined into a multi-state life table to obtain parity-specific and total birth intensities by education. We use post-stratification of birth probabilities to calibrate our estimates with national total fertility rates, enabling international comparisons for specific groups (e.g. highly educated women) or for particular dimensions of fertility behavior (e.g. childlessness).
 
Our estimates refer to the year 2010, which makes our educational gradients of period fertility levels comparable with those based on census data, allowing for additional data quality checks.
 

Main results for 2010


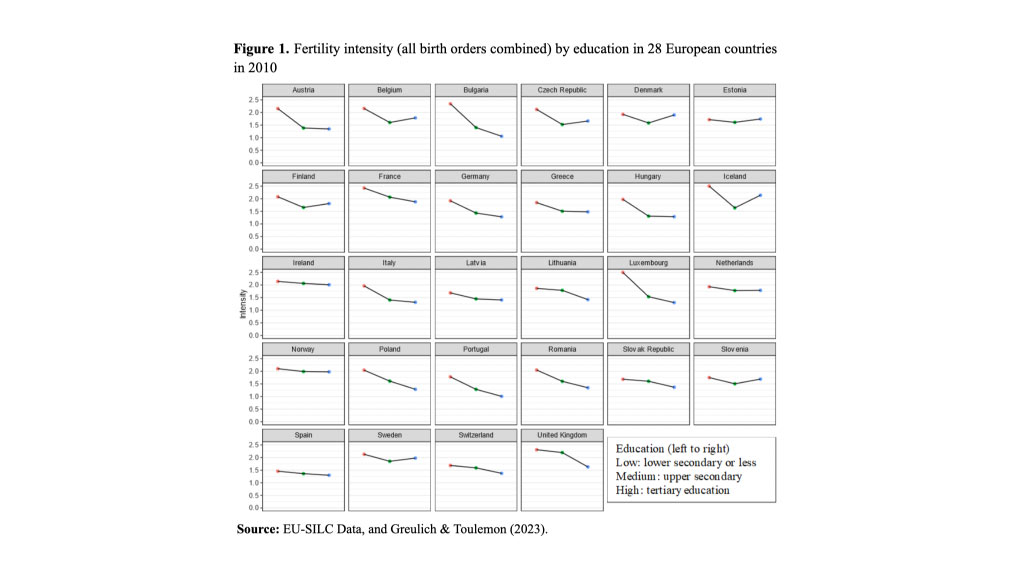
Even though low educated women have the highest period fertility levels in almost all European countries, the educational gradient is not universally negative. In 2010, period fertility levels exhibited a U-shaped pattern in a third of European countries, with medium-educated women having the lowest fertility.
Highly educated women have considerably higher fertility levels than medium-educated women in the Nordic countries (Iceland and Denmark, followed by Sweden and Finland) but also in Belgium, the Czech Republic and Slovenia. Conversely, the educational gradient is strongly negative in Portugal, Bulgaria, Luxembourg, Poland and Romania.
The remarkable diversity in period fertility levels among highly educated women in Europe is due to higher transitions to first and second childbirth among this group in some countries than in others; higher order births, on the other hand, exhibit a universally negative educational gradient (Fig. 1).

Focusing on six countries


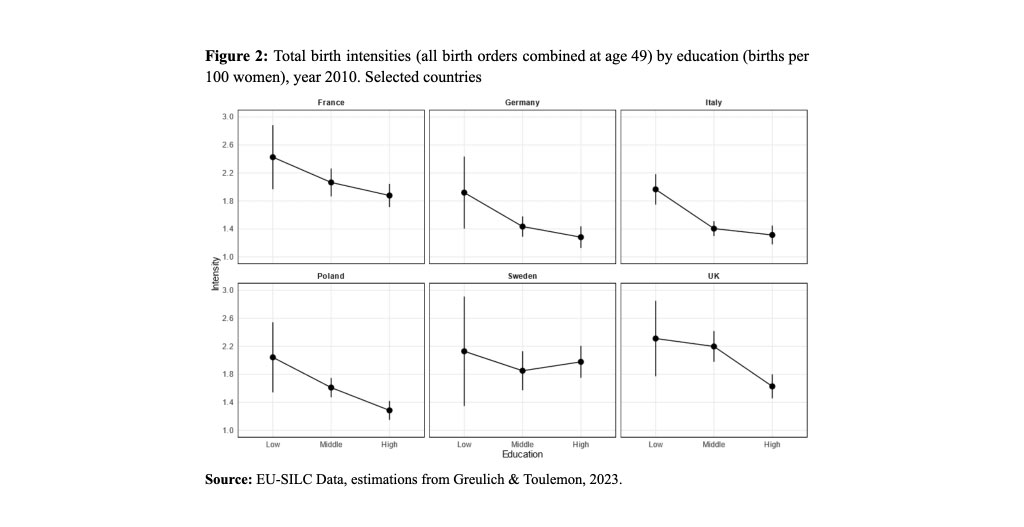
Figure 2 illustrates the diversity of European period fertility levels for six selected countries that can be considered representative of a specific European region:

• France, for the Continental countries including Belgium, the Netherlands and Luxembourg,
• Germany, for the German-speaking countries including Austria and Switzerland,
• Italy, for the Mediterranean countries,
• Poland, for the Central and Eastern European countries,
• Sweden, for the Nordic countries and
• the UK, for the English-speaking countries including Ireland.
In all six countries, birth intensities are highest for the low educated. Germany, Italy and Poland, all with TFR <1.5, show a strong negative educational gradient: medium and highly educated women have a much lower fertility level than low educated women. Conversely, France, the UK and Sweden have comparatively high fertility levels for medium and highly educated women, although France and the UK still show a negative educational gradient. In Sweden, there is no clear educational gradient, and the fertility differences between educational groups are not significant.

Relatively high period fertility levels for medium and highly educated women combine with a higher proportion of highly educated women in Sweden, France and the UK (about 50% in our sample) than in Germany, Poland and Italy (less than 40%), which results in comparatively higher fertility (above 1.5 children per woman) in the former group of countries.
Checking, documenting and disseminating data and results

The cross-sectional database of the EU-SILC, on which our measures are built, includes datasets since 2004 for most countries.

 
We are currently producing the full set of data by year (2004-22), age, parity, education and country, using R software, and checking our data with external data sources, such as population censuses and civil registers (more information is available in the appendix of our 2023 paper, e.g. fertility by age, parity, level of education, summary data for 2005 and 2015, as well as STATA and Excel documents presenting our method). In addition to research papers, we will document our data and methods on a website, and disseminate them on other web platforms, including theHuman Fertility Database and the Human Fertility Collection. A growing number of datasets are becoming available, but their accuracy and relevance needs to be assessed. It is important to share methods and documentation to take advantage of these new possibilities.

References

  • d’Albis H., Gobbi P., Greulich A. (2017). Having a Second Child and Access to Childcare: Evidence from European Countries. Journal of Demographic Economics 83(02): 177–210.
  • De Santis G., Drefahl S., Vignoli D. (2014). A Period Total Fertility Rate with Covariates for Short-Panel Data. Population 69 (3): 419–432.
  • Eurostat (2020). EU statistics on income and living conditions microdata.
  • Greulich A., Toulemon L. (2023). Measuring the educational gradient of period fertility in 28 European countries: A new approach based on parity-specific fertility estimates. Demographic Research 49(34): 905–968.
  • Klesment M., Puur A., Rahnu L., Sakkeus L. (2014). Varying association between education and second births in Europe: Comparative analysis based on the EU-SILC data. Demographic Research31(1): 813–860.
  • Nisén J., Klüsener S., Dahlberg J, Dommermuth L, Jasilioniene A., Kreyenfeld M., Lappegård T., Li P., Martikainen P., Neels K., Riederer B., Riele S., Szabó L., Trimarchi A., Viciana F., Wilson B., Myrskylä M. (2021). Educational Differences in Cohort Fertility Across Sub-national Regions in Europe. European Journal of Population 37: 263–295.
  • Sobotka, T. (2020). Fertility Across Time and Space. Data and Research Advances. Vienna Yearbook of Population Research 18: 1–24.
  • Trimarchi A., Van Bavel J. (2019). Partners’ Educational Characteristics and Fertility: Disentangling the Effects of Earning Potential and Unemployment Risk on Second Births. European Journal of Population 36(3): 439–464.

Saturday, July 13, 2024

Female education and fertility stalls in sub-Saharan Africa

July 1, 2024 Bruno Schoumaker and David A. Sánchez-Páez

Progress in education has been uneven in sub-Saharan Africa, which may have contributed to slowing or halting fertility decline. Bruno Schoumaker and David A. Sánchez-Páez note that fertility has stalled even in the context of educational progress which depends largely on fertility stagnation within educational groups.


The fertility transition in sub-Saharan Africa (SSA) has been different than in other low- and middle-income countries: it began later, started from higher fertility levels, and has occurred at a slower pace (Bongaarts 2017). Moreover, fertility stalls, i.e. periods of very slow or no decline in fertility rates above replacement levels, have been identified in several countries since the early 2000s, contributing to the overall slow decline in fertility in SSA (Schoumaker 2019).

Educational progress and fertility changes


Women’s education affects fertility through three main channels: better-educated women typically desire fewer children, utilize contraceptives more frequently, and often delay childbearing by postponing marriage and the onset of sexual activity (Bongaarts et al. 2017; Liu and Raftery 2020; Shapiro and Tenikue 2017). In SSA, women with at least some secondary education tend to have between two and three fewer children than those without formal education (Tabutin and Schoumaker 2020). Given the prominent role of education in shaping demographic behavior, its impact on fertility stagnation in SSA is expected to be important. However, previous studies have led to mixed evidence. Some of them showed that the slow progress of education partly accounts for recent fertility stalls in some SSA countries (Goujon, Lutz, and KC 2015; Kebede, Goujon, and Lutz 2019). However, cases of fertility stalls have been found also in countries with robust progress in education (Sánchez-Páez and Schoumaker 2022). In addition, previous studies have often relied on aggregate data and have not distinguished the effect of changes in the population’s education level (the composition effect) from the fertility changes within educational groups (the rate effect).

Unraveling the links between education and fertility in the context of stalls


In a recent study (Schoumaker and Sánchez-Páez 2024), we used Demographic and Health Surveys and Multiple Indicator Cluster Surveys to identify the effects of changes in the educational composition of the population and fertility changes within educational groups on fertility stalls in 33 SSA countries since the 1970s. We first reconstructed fertility trends by educational level in each country, and assessed the relative role of the composition and the rate effect in explaining fertility stalls.

Out of the 33 countries, we identified 14 fertility stalls at the national level. Figure 1, for instance, illustrates fertility trends by educational level in Kenya between the 1970s and late 2010s. We find that the fertility stall in the early 2000s (orange line) coincides with periods of stalled fertility in all (three) educational groups. This pattern is observed in most of the 14 countries, indicating that fertility stalls are a collective experience across educational groups.
During the same period, levels of education continued to increase in Kenya (Figure 2). The share of better-educated women in the total population went from 25% in the 1970s to more than 80% around 2020. While the improvement in educational levels slightly leveled off in the early 2000s, this slowdown cannot account for the country-level stall.Figure 3 further confirms the major role of fertility stalls within educational groups (rate effects) in the country-level stall, while educational progress (composition effects – grey area in Figure 3) has consistently pushed in the “right” direction, although with somewhat decreasing strength. The y-axis represents the average annual fertility change during the period: during periods of fertility decline (negative values), all educational groups contributed (rate effects, in blue and green), and so did the increase in education (composition effect, in grey). Instead, during the stall period of the early 2000s, fertility increases among women with no or low education were the major driver of the stall. Similar results were found in most of the 14 countries where stalls in fertility decline were noted in the past 40 years or so.

Conclusions


In none of the 14 countries characterized by fertility stalls has the change in educational composition been the driving factor: stalls were instead caused by stagnating or even increasing fertility within educational groups. As these trends occurred more or less simultaneously within all educational groups, some common cause has probably determined them, such as stagnating fertility preferences, or lack of access to contraception.

In countries where a large proportion of the population has no education, future fertility trends will depend mostly on the fertility of less-educated women, given their large weight in the population. In countries where education is already widespread, stalls are likely to persist and fuel further population growth, unless fertility declines further among more educated women.

References

  • Bongaarts, J. (2006). The causes of stalling fertility transitions. Studies in Family Planning 37(1): 1–16. doi: 10.1111/j.1728-4465.2006.00079.x.
  • Bongaarts, J. (2017). Africa’s unique fertility transition. Population and Development Review 43(S1): 39–58. doi:10.1111/j.1728-4457.2016.00164.x.
  • Bongaarts, J., Mensch, B.S. and Blanc, A.K. (2017). Trends in the age at reproductive transitions in the developing world: The role of Education. Population Studies 71(2): 139–154. doi: 10.1080/00324728.2017.1291986.
  • Goujon, A., Lutz, W. and KC, S. (2015). Education stalls and subsequent stalls in African fertility: A descriptive overview. Demographic Research 33(47): 1281–1296. doi: 10.4054/DemRes.2015.33.47
  • Kebede, E., Goujon, A. and Lutz, W. (2019). Stalls in Africa’s fertility decline partly result from disruptions in female education. Proceedings of the National Academy of Sciences 116(8): 2891–2896. doi: 10.1073/pnas.1717288116
  • Liu, D.H. and Raftery, A.E. (2020). How do education and family planning accelerate fertility decline? Population and Development Review 46(3): 409–441. doi: 10.1111/padr.12347
  • Sánchez-Páez, D.A. and Schoumaker, B. (2022). Fertility Transition in Africa: What do we know and what have we learned about Fertility Stalls? In C. Odimewgu and Y. Adewoyin (Eds.), The Routledge Handbook of African Demography (pp. 216–251). London: Routledge. doi: 10.4324/9780429287213-15.
  • Schoumaker, B. (2019). Stalls in fertility transitions in sub-Saharan Africa: Revisiting the evidence. Studies in Family Planning 50(3): 257–278. doi: 10.1111/sifp.12098.
  • Schoumaker, B. and Sánchez-Páez, D.A. (2024). Disruptions in educational progress and fertility dynamics by educational level: Unraveling the link between education and fertility stalls in sub-Saharan Africa. Population and Development Review 50(1): 59–85. doi: 10.1111/padr.12610.
  • Shapiro, D. and Tenikue, M. (2017). Women’s education, infant and child mortality, and fertility decline in rural and urban sub-Saharan Africa. Demographic Research 37(21): 669–708. doi: 10.4054/DemRes.2017.37.21
  • Tabutin, D. and Schoumaker, B. (2020). The demography of sub-Saharan Africa in the 21st century. Population 75(2): 165–286. doi: 10.3917/popu.2002.0169.

Thursday, June 27, 2024

another place

37% студентов в будущем видят себя бизнесменами, 33% хотят строить карьеру в найме


4 из 10 студентов в будущем мечтают стать бизнесменами. В опросе сервиса по поиску высокооплачиваемой работы SuperJob Старт карьеры приняли участие 1000 студентов вузов из всех округов страны.

37% студентов видят себя на пике карьеры бизнесменами, причем в равной степени, как парни, так и девушки. 33% студентов намереваются строить карьеру в найме, в большей степени на это ориентированы юноши (36% против 30% среди девушек).

Каждый десятый студент утверждает, что уже имеет опыт ведения собственного бизнеса. Причем чаще это парни, чем девушки (14 и 7% соответственно). Судя по комментариям, в большинстве случаев речь идет об опыте заработка своими силами без правового оформления статуса предпринимателя — студенты пробуют себя в различных сферах: продажах, интернет-услугах, hand made и проч. Каждый второй планирует открыть свое дело: среди девушек — 55%, среди юношей — 49%.

Место проведения опроса: Россия, все округа
Населенных пунктов: 304
Время проведения: 3—24 июня 2024 года
Исследуемая совокупность: студенты вузов
Размер выборки: 1000 респондентов

Подробнее

Monday, February 5, 2024

Demographic and occupational change in Europe:

gender, education, and age disparities

February 5, 2024 Álvaro Mariscal‐de‐Gante, Amaia Palencia‐Esteban, Sara Grubanov‐Boskovic and Enrique Fernández‐Macías

Over the last decades, the working population in Europe has become older, more feminized, and more educated. However, Álvaro Mariscal‐de‐Gante, Amaia Palencia‐Esteban, Sara Grubanov‐Boskovic and Enrique Fernández‐Macías argue that female occupational improvements have been insufficient to close the gender gap, and find declining occupational returns to education for highly educated women in two countries. Conversely, European labour markets have been able to accommodate the growing number of older workers, despite some occupational downgrading.


European societies are undergoing significant demographic changes, most notably the trend towards feminization and ageing of their workforce. Intertwined with a process of educational upgrading, these shifts are reshaping the landscape of the continent’s labour market (Lutz and Skirbekk 2014).

To respond to these challenges, the European Union (EU) and its member states have implemented a series of policy initiatives aiming to promote longer working lives and reform social protection and pension systems. In 2020, the EU’s Green Paper on ageing outlined strategies for addressing these challenges, propelling the twin transitions towards a greener and more digital Europe while nurturing the ageing population’s potential (European Commission 2022).

In a recent paper on this topic (Mariscal‐de‐Gante et al 2023), we used recent occupational and demographic data for six European countries to briefly illustrate and discuss three of these major demographic challenges, namely gender disparities in the labour market, the effects of educational improvements on employment, and the ageing of the working population.

Has increased female participation widened the gender occupational gap?


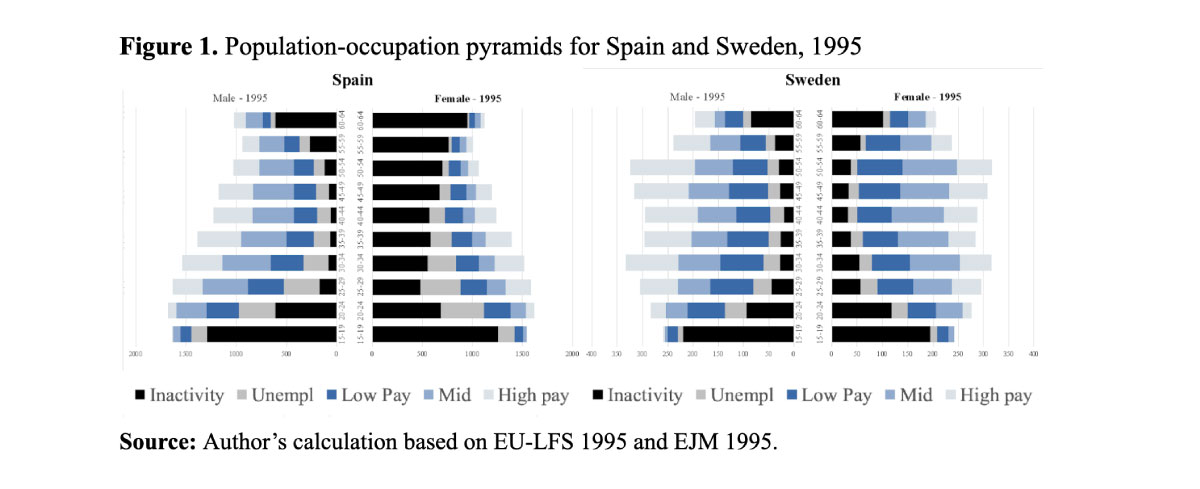
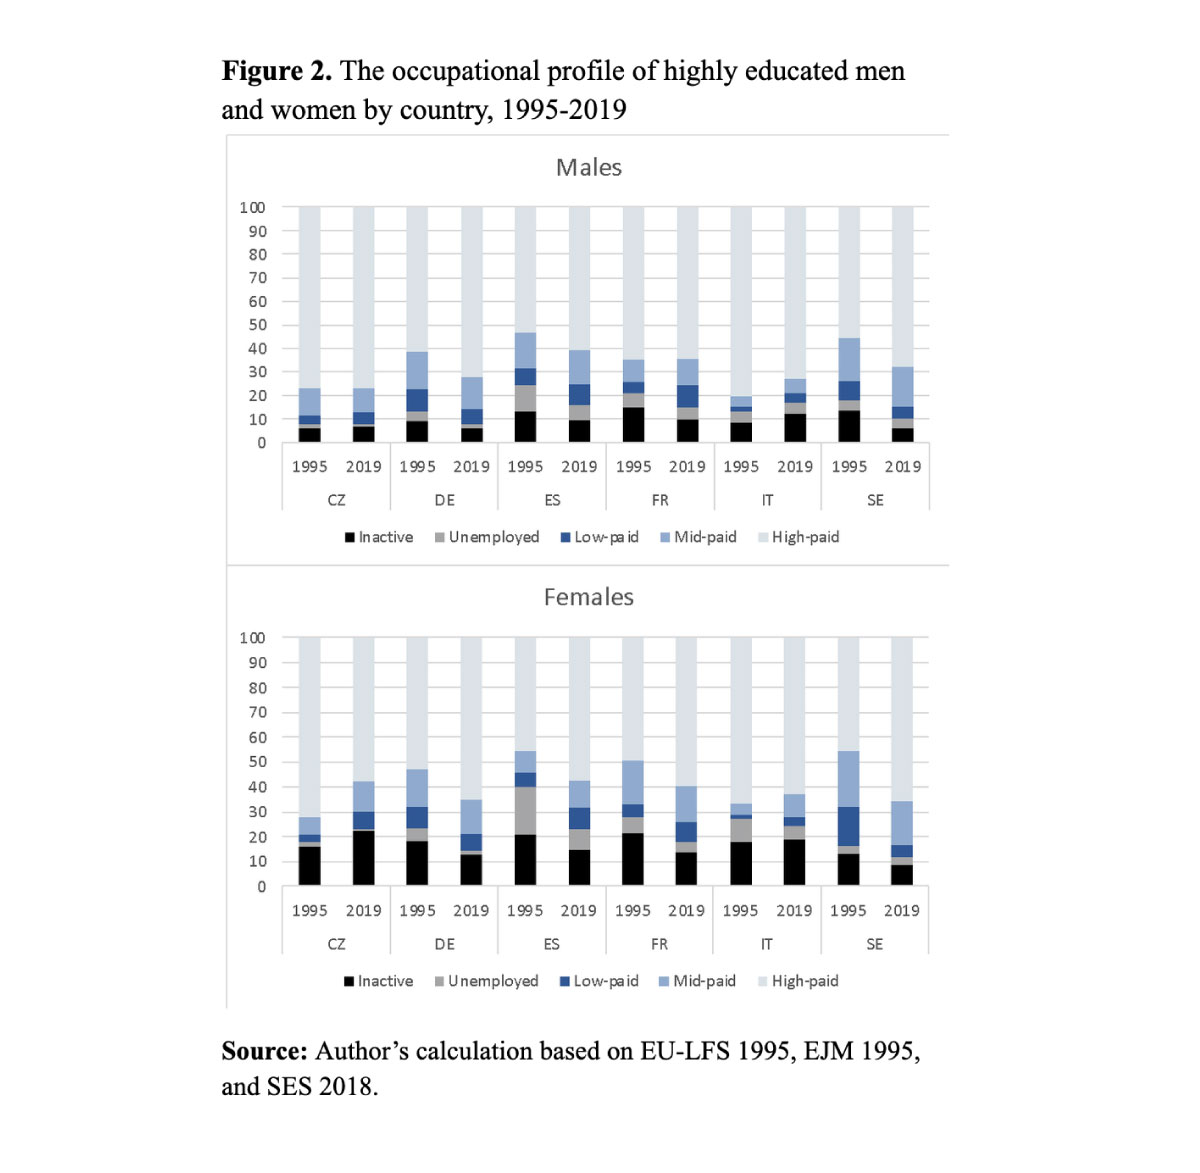
Population pyramids intuitively show the major demographic changes faced by European countries over the last 25 years. In 1995, countries like Spain, Italy, or the Czech Republic still exhibited the classical pyramidal shape, reflecting a great number of young workers and smaller cohorts of old individuals. In contrast, Germany, Sweden, and France already showed a narrowing base, indicating earlier declines in fertility rates and incipient population ageing (Spain and Sweden are shown in Figure 1). Despite these differences in structural demographic shifts, a common thread ran through all these countries: inactivity, unemployment, and low-paid jobs were relatively more prevalent among women.
Between 1995 and 2019, while inactivity and unemployment tended to decline significantly, there was a widespread process of occupational upgrading, with growing employment shares in relatively high-paid jobs. Although this upgrading process was particularly important for women (Spain is noteworthy example), such improvement was certainly not enough to achieve gender parity. In fact, the female-to-male ratio in low-paid jobs increased from 1995 to 2019, and the female occupational structure is still clearly more polarized than that of men, reflecting the difficulties that women face during their professional career (Card et al. 2016). Thus, we can answer our first question by saying that, despite significant progress, occupational gender gaps remain large in European labour markets.

Has educational upgrading benefitted the labour market position of women?


Over the last quarter of century, Europe has experienced a significant expansion of tertiary education coupled with a decline in primary education. This expansion has been stronger among women: for instance, in Spain the proportion of prime-aged female workers has increased by 31 percentage points as opposed to only 20 percentage points for men. But has their occupational position improved likewise?

First, it must be noted that this educational upgrading has not been equally absorbed by all European labour markets, as illustrated in Figure 2. In the case of highly educated workers, their occupational profile has clearly improved in Germany, Sweden and, to a lesser extent, in Spain and France, while deteriorating in Italy and the Czech Republic. These patterns seem to run more or less in parallel with gender occupational dynamics. While women’s profile improved more than men’s in Sweden, Germany, Spain and, to a lesser degree, in France, the occupational position of highly educated female workers worsened in Italy and the Czech Republic. In fact, in the latter two countries, the occupational outcomes of highly qualified female workers declined in relative terms, despite an educational profile that increased over the period more than that of men.

How has the occupational profile of old and young workers changed?


In the last 25 years, the European population has been ageing, with a growing share of older workers and a declining share of younger ones. Faced with this reality, some scholars have hypothesized that given the disparities in numbers of competitors, different generations will experience different labour market outcomes,. Accordingly, these so-called cohort-crowding effects might harm the occupational prospects of (abundant) older workers and enhance those of (scarce) young workers.
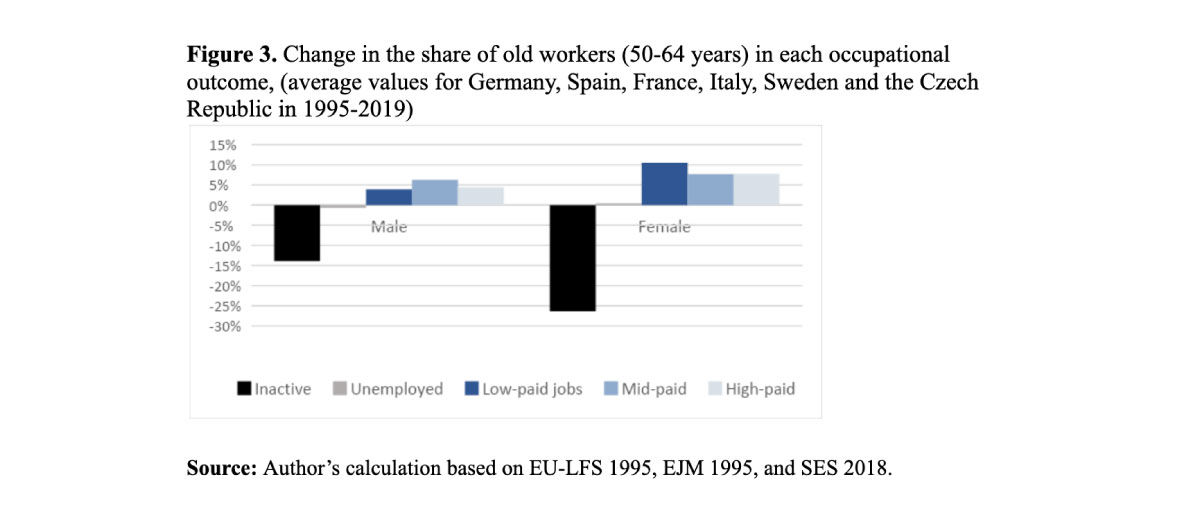
In terms of overall employment, European labour markets have been able to accommodate large expansions in the cohorts of old workers: inactivity rates have fallen quite drastically without an equivalent growth in unemployment. If we look at the occupational profiles, however, our analysis also reveals some deterioration, which again appears to be gender-biased as it affects older women more acutely. The shrinking of the younger cohorts, on the other hand, does not seem to be associated with any significant change in their occupational outcomes.

In conclusion…


Understanding the interplay of demographic shifts and occupational changes is vital for policymakers and researchers interested in addressing persistent disparities in the labour market. As the labour market continues to evolve, in many cases towards an ageing and feminized workforce, European experiences provide valuable insights into this multifaceted interaction. Impressive strides in women’s labour participation and education have (so far) failed to bridge occupational disparities, often leading to lower-paid positions. Together with cross-country differences, the old continent’s evolution over the last 25 years may underscore the importance of public institutions. The path towards true gender equality in the labour market calls for reinforced policies addressing the diverse factors that explain the persistence of gender occupational gaps, from early education choices and uneven household workload to outright discrimination.

References

  • Card D., Cardoso A., Kline P. 2016. Bargaining, Sorting, and the Gender Wage Gap. Quantifying the Impact of Firms on the Relative Pay of Women. The Quarterly Journal of Economics 131(2): 633–686. https://doi.org/10.1093/qje/qjv038
  • EJM. 1995. European Jobs Monitor.
  • EU-LFS. 1995. European Union Labor Force Survey.
  • European Commission, Directorate-General for Communication, Green paper on ageing, Publications Office of the European Union. 2022. https://data.europa.eu/doi/10.2775/785789
  • Lutz W., Skirbekk V. 2014. “How Education Drives Demography and Knowledge Informs Projections.” In W. Lutz, W.P. Butz, S. KC (Eds.) World Population and Human Capital in the 21st Century, Oxford: Oxford University Press: 14–38.
  • Mariscal‐de‐Gante Á., Palencia‐Esteban A., Grubanov‐Boskovic S., Fernández‐Macías E. 2023. Feminization, Ageing, and Occupational Change in Europe in the Last 25 Years. Population and Development Review. https://doi.org/10.1111/padr.12586
  • SES. 2018. Structure of Earnings Survey.

Sunday, November 26, 2023

Career Compromises and Dropout from Vocational Education and Training in Germany

By Janina Beckmann, Alexandra Wicht, Matthias Siembab

This study investigates the relevance of career compromises (i.e., the discrepancy between the expected and the actually attained training position) to the decision to drop out of vocational education and training (VET), focusing on compromises in terms of social status and gender type. We pay particular attention to upward and downward compromises. Using longitudinal data on 7205 apprentices from the German National Educational Panel Study (Starting Cohort 4), the results of discrete event history models show that both dimensions of compromise are crucial to the decision to drop out of a first VET position. In particular, downward gender-type discrepancies increase the probability that female apprentices will drop out. These findings draw attention to the role of pre-entry VET policies, such as career counseling, in minimizing the incidence of career compromises.

Saturday, November 18, 2023

Official development assistance (ODA) is increasing, but not at the rate it needs

Official development assistance (ODA) and partnerships are crucial for the world to succeed in delivering opportunities for lower-to-middle income countries. That is what SDG 17 stands for: a revitalization of global aid as a catalyst for progress – a condition that relies heavily on large (and continuous) movements of resources from higher-income countries to least-economically-advantaged ones.

According to the available data, 2022 saw a total of US$211.3 billion being delivered in support for the world’s poorest countries – a significant increase from 2021, year in which the amount of aid stood at US$186 billion. Nowadays, global aid is at an all-time high. However, this is due to contributions for three specific events: the COVID-19 pandemic, the Russian invasion of Ukraine, and the refugees arriving in donor countries.

If we take a closer look, data shows that resources allocated to other areas would have decreased by 1.2 percent if the contributions made for these unique events – pandemic assistance, in-donor-country refugee support, and direct aid to Ukraine – had not existed.
What is the world’s threshold in terms of how many resources are given in official development assistance? SDG 17.2 has set the target for developed economies to allocate 0.7 percent of their GNIs to fund aid for less-wealthy nations across several sectors such as health, education, infrastructure, agriculture, and others.

As shown by the chart below, the world is far from meeting this goal. Altogether, developed countries would have had to increase their contributions by US$200 billion in order to fulfil this commitment in 2022.

Support for the world’s poorest countries in most need of aid – also known as LDCs, or Least Developed Countries – has also fallen short of the goal.

SDG 17.2 states that development aid for LDCs should account for somewhere between 0.15 and 0.20 percent of donor countries’ GNIs. Unfortunately, the gap is widening, as shown in the chart below.
Learn more about ODAs, donor countries, resource flows and sectors aided in the seventeenth story of our 2023 SDG Atlas.

Wednesday, November 15, 2023

our future

Главные характеристики при выборе ВУЗа молодёжью


Интересная таблица из свежего исследования (выборка: студенты 1 курса Волгоградского государственного технического университета) о критериях выбора ВУЗа студентами. Важнее всего для молодёжи при выборе места для получения высшего образования оказалось наличие интересующей специальности, перспективы профессии, гарантия трудоустройства, надёжность и отзывы о ВУЗе.

Меньше всего внимания обращают на мнению родственников, рекламу и статус НИУ! Последнее, конечно, может быть вызвано особенностями выборки, но всё равно очень забавный результат с учётом того, сколько ресурсов у нас вкладывается в национальные исследовательские университеты (ну, на фоне других ВУЗов...)

Thursday, November 9, 2023

Attitudes toward work and parenthood following family-building transitions in Sweden: Identifying differences by gender and education

BY Eva Bernhardt, Frances Goldscheider, Malgorzata Switek

Objective: This paper examines how family-building transitions (union formation and first birth) affect the attitudes of Swedes toward work and parenthood. The literature finds that these life course transitions have a traditionalizing effect on gender roles. Is this also the case in Sweden, one of the most gender-equal countries in the world?

Methods: Our study uses the longitudinal Young Adult Panel Study database. We run first-difference OLS regressions on the relationship between family-building transitions and work and parenthood attitudes, distinguishing men from women, and those with more education from those with less.

Results: We find that family transitions do slightly traditionalize attitudes toward work and parenthood, but differences by gender and education are very small.

Contribution: The overall pattern is one of striking similarity between men and women, suggesting that the gender revolution is well advanced in Sweden; traditional gender differences remain primarily among those with less education.

Saturday, November 4, 2023

data feedback

Feminism confronts Russian patriarchy

In this article we discuss the uneasy development of gender studies in Russia as one example of public sociology. For empirical evidence we concentrate mainly on our own experience in the Gender Studies Program at the European University in St. Petersburg, but we also refer to the other cases. We observe how the political and academic context of the 1990s created opportunities for academic innovations that ideologically challenged Soviet patriarchy and invoked gendered criticisms of post-Soviet changes. We discuss the effects of the rapid but partial institutionalization of gender studies in the Russian academic context and how gender became the umbrella term for both feminist and anti-feminist standpoints. We claim that since international support for the gender studies diminished in the 2000s, the fashion and economic benefit of doing gender studies has declined, with only a small group of researchers maintaining their commitment to the feminist approach to gender. We focus on the politicization of gender in the last decade of Putin’s Russia and the role of feminist researchers in the analysis of the new conservatism, expressed in gender ideology. We examine the problems of combining public expertise and academic work in the particular realm of gender politics.

Tuesday, October 31, 2023

cadres

Число научных сотрудников в России за последние два десятилетия сократилось примерно на 25%, заявил секретарь Совета безопасности РФ Николай Патрушев на выездном совещании в Томске.

"Серьезным препятствием к достижению технологической независимости является дефицит квалифицированных научных, инженерных и рабочих кадров. Общая численность персонала, занятого исследованиями и разработками в России, за последние 20 лет сократилась на четверть", - указал он.

При этом, продолжил Патрушев, "на фоне роста числа студентов, обучающихся по приоритетным специальностям и направлениям подготовки, отмечается снижение уровня трудоустройства выпускников по полученной специальности". "Это свидетельствует о сформировавшихся в системе подготовки кадров существенных диспропорциях между спросом на квалифицированные кадры и предложением со стороны системы образования", - считает он.

Monday, October 30, 2023

almost in Russian

Early disengagement from education and work: “ninihood” in Latin America

October 30, 2023 Chia Liu, Andrés F. Castro Torres and Ewa Batyra

Latin America faces a unique societal challenge: high numbers of young adults, especially women, who neither work nor pursue education, known colloquially as “nini.” Using census microdata for 12 countries, Chia Liu, Andrés Castro Torres, and Ewa Batyra examine the dynamics of young adults’ disengagement from public spheres (e.g., formal work and formal education) and shed light on the roles of family, gender, and social class as significant determinants of “ninihood”.


The term “nini” encapsulates the plight of young adults who find themselves disconnected from both work and education (De Hoyos, Popova, & Rogers, 2016). It’s estimated that almost 20% of youths between 15 to 25 years old in Latin America are part of this group. At the same time, early parenthood and union formation are widespread in Latin America, where many young adults, particularly women, are occupied with household and care work. To cast light on this complex socio-economic landscape, in a recently published paper, we explored the dynamics between parenthood, gender roles on one side, and labour force and formal educational participation on the other (Liu, Castro Torres & Batyra, 2023).

The “nini” phenomenon: gender and social class dynamics


In the 12 Latin American countries under study, a significant proportion of women aged 20 to 25, at least one out of every four, can be categorized as “ninis”. In Guatemala, Honduras, and Nicaragua, this proportion is even higher, above 50%. On the other hand, among men in the same age group, the percentage is notably lower, below 20% (Figure 1).
The discussion pertaining to “ninihood” is delicate. Latin America is a region with large informal labour markets, with many people working in the shadow economy, and therefore rarely captured in official data. Thus, the term is controversial because informal and uncompensated work is often left out of the picture. Despite the importance of these under-acknowledged work activities, those not engaged in formal education or the formal labour market have been found to experience high levels of insecurity. The “nini” phenomenon, essentially an early disengagement from education and work, has wide-ranging consequences, such as limited lifetime earnings, economic vulnerability and social marginalization. At the societal level, untapped human potential hampers economic growth, while unmet needs may fuel social unrest.

Given the stark differences in “ninihood” between men and women observed in Latin America (Figure 1), our study delves into the intricate relationship between early family formation, especially for women, and the accumulation of human capital. The gender and social class gradients that emerge underscore the challenges women face in remaining visible in the formal public sphere: disengagement primarily affects socially disadvantaged women, especially in Central America. Women from lower social origins who leave the parental home to enter conjugal union and parenthood at younger ages are particularly at risk. Being in a partnership increases the risk of being a “nini” for women, but reduces it for men, confirming the pervasiveness of the male breadwinner model in conjugal households.

Implications for policy and gender equality


Early family formation heightens the risk of exclusion from formal institutions and social safety nets. For those who fall into the “nini” category, transitioning into adulthood is fraught with challenges, leading to disparities in access to vital resources like unemployment insurance, healthcare, and pension schemes. Our findings emphasize the critical role of women’s engagement in the formal labour market, particularly in a context of limited social protection and single motherhood, and prompts us to reconsider how we view women’s engagement with public life, especially in the Global South.

This work on early parenthood, gender roles, and labour force participation in Latin America shines a light on the complexities behind the “nini” phenomenon. The results underscore the urgent need for governments to address the issue of disengagement from the public sphere, by improving access to employment and education, for example, especially among women and lower socio-economic classes. As Latin America strives for inclusive growth and development, acknowledging the role of early family formation and gender dynamics is essential for fostering economic security, social equality, and individual well-being.

References

Wednesday, October 25, 2023

How long do older Germans work?

October 23, 2023 Christian Dudel, Elke Loichinger, Sebastian Klüsener, Harun Sulak and Mikko Myrskylä

Rapid population aging may undermine the viability of the German pension system. Is working longer a remedy? Christian Dudel, Elke Loichinger, Sebastian Klüsener, Harun Sulak, Mikko Myrskylä analyse what is known about employment in later adult life in Germany. Employment trends are on the increase, but with considerable socioeconomic differences.


Germany is aging


The German population is among the oldest in the world and is aging rapidly. Projections of the German Federal Statistical Office (Statistisches Bundesamt, 2022) indicate that in 2050 around 26% of the population will be over age 67, which will be the statutory retirement age by 2031. As the number of retirees increases and the workforce shrinks (Fuchs et al. 2018), this rapid population aging will be a challenge for the German social security system, and for the German pension system in particular.

Extending the length of working life has been proposed as a remedy, as it increases the size of the workforce while reducing the number of retirees. Several institutions, such as the European Commission and the OECD, have been advocating for this shift (e.g., European Commission, 2010; OECD 2015). Meanwhile, many countries, including Germany, have implemented reforms with the major goal of prolonging working life. For instance, the statutory retirement age in Germany is currently being increased from 65 to 67.

Inequalities in the length of working life


Policies aimed at extending working life often follow a one-size-fits-all approach. As these policies are frequently applied with few or no exceptions, or are aimed at workers in stable employment (e.g., Phillipson 2019), they might have negative effects on more economically insecure and vulnerable groups. For instance, increasing the retirement age for almost everyone, as is currently the case in Germany, may increase the duration of working life for highly educated men with high employment rates, while low educated individuals face a high risk of unemployment during the additional years they are forced to stay in the labor market.

A series of studies in several countries have revealed substantial socioeconomic inequalities in the length of working life (e.g., Dudel & Myrskylä 2017). In a recent paper (Dudel et al. 2023), we provide new evidence of such inequalities for older workers in Germany, and focus on several dimensions of inequality: gender, occupation, education, and region (distinguishing between the former socialist eastern Germany and western Germany). Below we provide an overview of some of the key findings, focusing on general trends and inequalities by education.

General trends in Germany


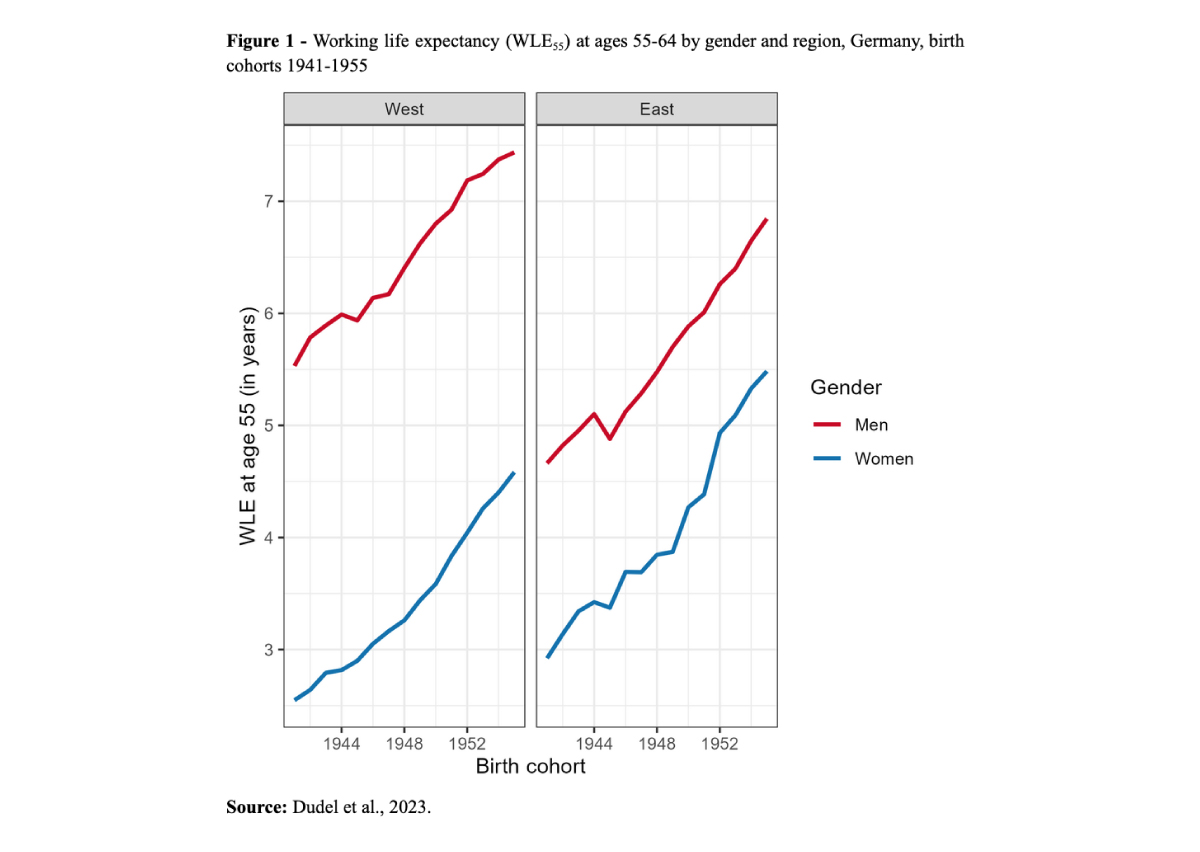
Our key indicator is working life expectancy (WLE55), defined as the average remaining lifetime spent in work. It is measured in years and, for our study, we computed it between ages 55 and 64, adjusting it for working hours. This means that our results are based not only on whether individuals are or are not gainfully employed, but also on whether they are working full- or part-time. We used data from the German Microcensus for the years 1996 to 2019, and calculated WLE55 for the cohorts born between 1941 and 1955 (Fig. 1).
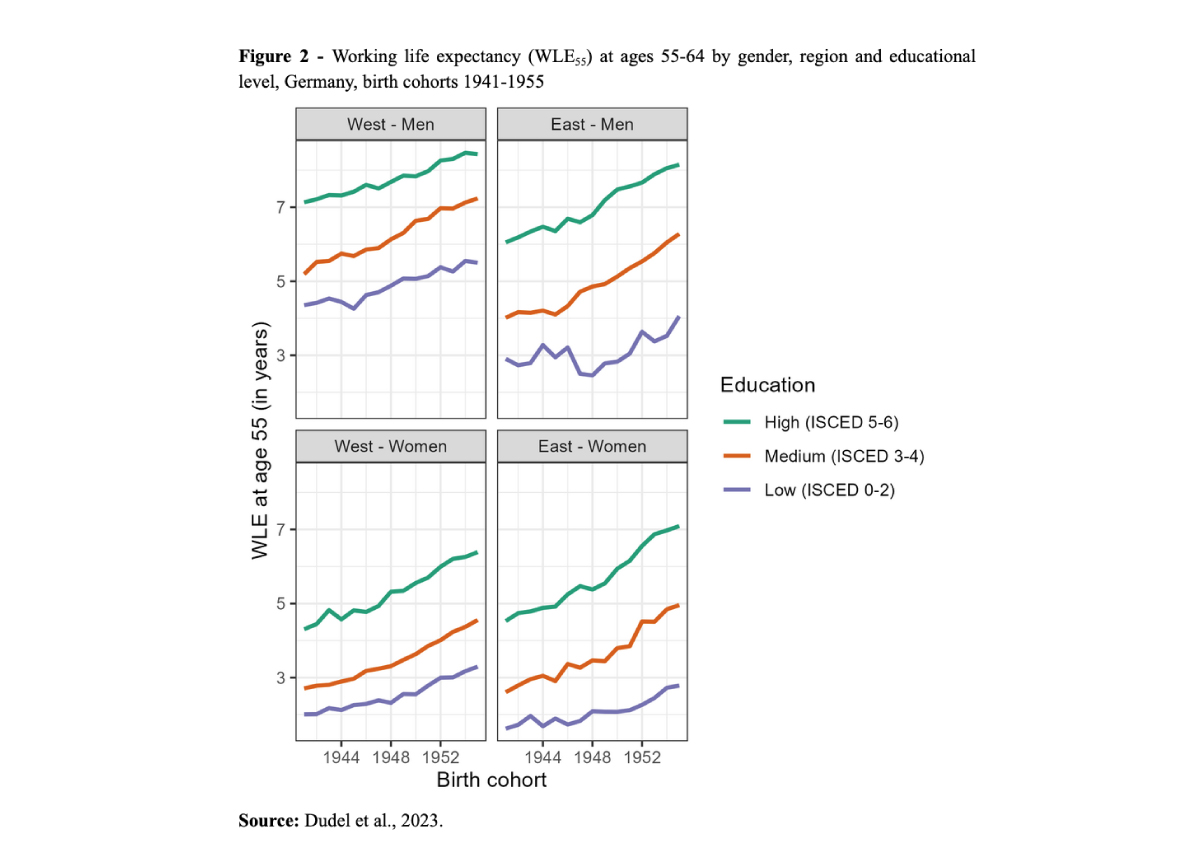
For instance, the number of additional years western German men could expect to remain employed at age 55 rose from 5.5 years for those born in 1941 to 7.4 years for those born in 1955. For all groups, WLE55 increased by around 2.0 to 2.5 years over the observed birth cohorts. This shift is likely attributable to several factors, including pension reforms aimed at extending working life and better health among younger cohorts.

In both western and eastern Germany, men worked for longer than women. However, the gender gap was always smaller in the east than in the west, and it decreased somewhat in eastern Germany, while remaining roughly constant in western Germany. Similarly, eastern German women worked longer than their western German counterparts. Among men, by contrast, the opposite pattern is observed, with western German men working longer. These regional and gender differences are legacies of eastern Germany’s socialist past and the unification process. When the east was socialist, policies aimed at integrating women into the labor market led to higher female employment rates in eastern Germany than in the west. This pattern continued after German unification, even during periods when unemployment rates in eastern Germany were high.

Educational inequalities in Germany


Employment in late adult life depends also on education, for which, in our paper, we considered three levels:
• low (equivalent to ISCED levels 0 to 2),
• medium (ISCED levels 3 to 4), and
• high (ISCED levels 5 to 6).

Results are displayed in Figure 2. When interpreting them, it is important to keep in mind that the lowest educational group is smaller and more selective in eastern than in western Germany, as less than 10% of the population aged 55 to 64 in eastern Germany have low educational attainment.
On average, WLE55 increased for all educational groups, but with considerable heterogeneity in both level and pace. For instance, beyond age 55, low-educated eastern German women worked, on average, only three additional years, while highly educated western German men worked almost nine. Moreover, in eastern Germany, the increase in WLE55 was notably smaller for low-educated individuals than for the other educational groups. For example, the gap between highly educated and low-educated eastern German men increased from roughly three to four years.

Conclusions


In summary, the length of late working life has been steadily increasing in Germany for all the socioeconomic groups we considered. This trend is in line with the aim of many recent policy reforms to increase retirement age. However, our findings show that there are substantial and increasing socioeconomic inequalities in the length of working life after age 55 among older workers. Researchers and policymakers should focus more on these inequalities, as they might be outcomes of systematic social disadvantages among specific groups of older workers. To help us better understand inequalities in WLE55, we are currently extending our calculations of WLE to cover all working ages. If, for instance, low-educated workers start working at earlier ages than highly educated workers, inequalities in total WLE might be smaller than inequalities in just WLE55, i.e. among older workers only.

References

  • Dudel, C., Myrskylä, M. (2017): Working Life Expectancy at Age 50 in the US and the Impact of the Great Recession. Demography 54: 2101-2123.
  • Dudel, C., Loichinger, E., Klüsener, S., Sulak, H., Myrskylä, M. (2023): The extension of late working life in Germany: trends, inequalities, and the East-West divide. Demography. https://doi.org/10.1215/00703370-10850040
  • European Commission (2010): Annual growth survey: Advancing the EU’s comprehensive response to the crisis.
  • Fuchs J., Söhnlein D., Weber B., Weber E. (2018). Stochastic forecasting of labor supply and population: an integrated model. Population Research and Policy Review, 37, 33-58.
  • OECD. (2015): Pensions at a glance 2015. Available at OCED.
  • Phillipson C. (2019). “Fuller” or “extended” working lives? Critical perspectives on changing transitions from work to retirement. Ageing & Society, 39, 629-650.
  • Statistisches Bundesamt, 2022: 15. koordinierte Bevölkerungsvorausberechnung – Deutschland. Available online.

Monday, September 25, 2023

Yevgeny Yasin

Умер бывший министр экономики России Евгений Ясин


Умер почётный научный руководитель Высшей школы экономики, бывший министр экономики России Евгений Ясин.

Ему было 89 лет.

Об этом сообщили бывший профессор ВШЭ Александр Архангельский, журналист Алексей Венедиктов (в реестре «иноагентов») и политолог Александр Кынев.

СМИ сообщали, что в конце августа Ясин был госпитализирован с отёком головного мозга и проблемами с работой сердца.

Если ссылка не открывается, нажмите здесь.

из Медузы:

В возрасте 89 лет умер экономист, бывший министр экономики России, член ученого совета Высшей школы экономики Евгений Ясин. Об этом сообщили журналист Алексей Венедиктов и политолог Александр Кынев. Информацию о смерти экономиста подтвердила его дочь Ирина.

По данным Кынева, Ясин умер утром 25 сентября. Прощание с Ясиным пройдет 28 сентября в здании Высшей школы экономики на Покровском бульваре, рассказала его дочь.

В конце августа телеграм-канал Mash сообщил, что Ясин попал в реанимацию с отеком головного мозга. В семье экономиста тогда призывали не верить «в глупости». 7 сентября Ирина Ясина сообщила, что ее отец находится дома, он «в порядке».

Евгений Ясин родился 7 мая 1934 года. В 1994-1997 годах он возглавлял министерство экономики России, а затем еще год оставался членом правительства страны.

Ясин — доктор экономических наук — был одним из авторов программы 1990-х годов по переходу от плановой к рыночной экономике, а также основателем Высшей школы экономики, где затем он занял пост почетного научного руководителя. Ясина также называют первым наставником главы Центробанка РФ Эльвиры Набиуллиной.

Monday, September 18, 2023

Fertility differentials in the USA: the interplay of ethnicity and education

September 18, 2023 Emma Zang and Aparajita Kaphle

Black women in the US have higher fertility than White women, but this difference does not emerge consistently at all educational levels. Emma Zang and Aparajita Kaphle document these education-specific differences and discuss some of their possible causes.


Black women in the United States have always had higher fertility, on average, than White women. In 1990, for instance, total fertility rates (TFRs) were about 2.5 and 1.8 children per woman, respectively, for Blacks and Whites, and although levels have declined for the former (down to about 1.9 in 2012), the ranking has consistently remained the same over the years (Sweeney and Raley 2014).

The role of education


This, however, depends also on the differential educational attainment of the two ethnic groups (Zang, Sariego and Krishnan 2022). Let us consider the birth cohorts of 1961–80: based on data from the National Survey of Family Growth (2006–17 waves), among women with educational levels below high-school, Hispanic women have the highest fertility (2.66), followed by Black women (2.49) and then White women (2.22) (Figure 1), with disparities that may be partially explained by some known cultural and socio-economic influences. The latter, for instance, pose challenges for minority groups in accessing adequate healthcare and contraception, especially less-educated Blacks and Hispanics. Hispanics’ higher fertility has long been attributed to their “familism” (Marin and Vanoss Marin 1991), whose importance, however, has been subsequently downplayed (Hartnett and Parrado 2012). Other explanations include a mix of wanted and unwanted pregnancy stemming from both systemic barriers to healthcare as well as cultural norms that encourage having more children (Hartnett 2014).
By contrast, among women with college degrees, while Hispanic women still have the highest fertility (1.97), White women have more children than Black women (TFR = 1.75 and 1.58, respectively), because the latter transition less frequently to a second child (Figure 2).

Explaining the differences


What causes this difference? An exploration into Black motherhood would require a comprehensive examination of the several elements that affect families and family planning, including healthcare, employment, and limited access to resources.

Take childcare support, for instance. Educated White women may have greater opportunities to pay for, and outsource, childcare labor, a luxury that may not be as accessible to Black women.

But the single most important element is probably the pervasive discrimination experienced by highly educated Black women, which increases the challenges they face, and may affect various facets of their life, including health and fertility (Tipre and Carson 2022). Racism, colorism and sexism in the workplace are still strong in the United States (Showunmi 2023), and, among other things, they can be a deterrent against having more children.

Conclusions


In short, it is important to delve deeper and explore the impact of structural barriers that Black women face, both low and highly educated. These barriers, we discussed in this article, also affect their fertility.

In all cases, these findings highlight that fertility differences across racial/ethnic groups cannot be solely attributed to race/ethnicity. Fertility rates are influenced by a complex interplay of factors such as socioeconomic status, educational attainment, access to healthcare, cultural norms, and individual choices. Generalizations about fertility rates based solely on race can perpetuate stereotypes and overlook the significant diversity within racial and ethnic groups.

References

  • Hartnett C.S. (2014) White-Hispanic differences in meeting lifetime fertility intentions in the U.S. Demographic Research, 30(43):1245-1276. DOI: 10.4054/DemRes.2014.30.43.
  • Hartnett C.S., Parrado E.A. (2012) Hispanic Familism Reconsidered: Ethnic Differences in the Perceived Value of Children and Fertility Intentions. The Sociological Quarterly, 53(4): 636-653, DOI: 10.1111/j.1533-8525.2012.01252.x
  • Marin, G., Vanoss Marin B. (1991) Research with Hispanic populations. Sage Publications, Inc.
  • Showunmi V. (2023). Visible, invisible: Black women in higher education. Frontiers in Sociology, 8, 974617. https://doi.org/10.3389/fsoc.2023.974617
  • Sweeney M.M., Raley R.K. (2014). Race, Ethnicity, and the Changing Context of Childbearing in the United States. Annual Review of Sociology, 40, 539–558. https://doi.org/10.1146/annurev-soc-071913-043342
  • Tipre M., Carson T.L. (2022). A Qualitative Assessment of Gender- and Race-Related Stress Among Black Women. Women’s Health Reports (New Rochelle, N.Y.), 3(1), 222–227. https://doi.org/10.1089/whr.2021.0041
  • Zang E., Sariego C., Krishnan A. (2022) The interplay of race/ethnicity and education in fertility patterns. Population Studies, 76(3): 363-385, DOI: 10.1080/00324728.2022.2130965

Thursday, July 6, 2023

mow labor market

Рынок труда: итоги полугодия


Динамика в сфере оплаты труда


56% работодателей индексировали зарплаты в течение последних 6 месяцев.

Динамика зарплатных предложений работодателей в Москве за I полугодие

Высокий темп прироста зарплатных предложений работодателей SuperJob фиксирует в IT: +8,2% по отношению к июню 2022 года, +3,3% к январю 2023 года. Рост зарплат замедляется. Напомним, что рекордным для IT по этому показателю стал 2021 год (+26,3%): зарплаты во время пандемии росли быстрыми темпами на фоне инфляции и перестройки экономики.

SuperJob наблюдает в IT-сфере тренд на отказ от требования о наличии высшего образования. Однако среди соискателей в IT пока по-прежнему преобладают выпускники вузов. Мало того, есть четкая зависимость уровня зарплат программистов от «престижности» университета, который они закончили: самые высокие средние заработки в IT — у выпускников МФТИ, ИТМО, МГУ, Бауманки и МИФИ.

Динамика числа вакансий в различных сегментах рынка труда за I полугодие


Наиболее высокие темпы роста спроса на персонал по итогам первого полугодия SuperJob фиксирует в промышленности: вакансий стало больше в 1,5 раза. Наиболее востребованы квалифицированные рабочие (слесари, операторы станков, монтажники), ИТР (технологи, конструкторы, наладчики) и мастера цехов.

Сезонное увеличение числа вакансий наблюдается в сфере туризма, гостиничного и ресторанного бизнеса (+46%). Наиболее высоким спросом пользуются повара различных специализаций, кухонные работники и официанты.

Количество вакансий в строительстве выросло на 39%. Особенно востребованы среди рабочих машинисты спецтехники, электромонтажники, отделочники, среди ИТР — инженеры ПТО, проектировщики, сметчики.

Как изменились настроения работодателей и поведение соискателей


Удаленки все меньше, дистанционные сотрудники, работающие из-за рубежа, есть в каждой одиннадцатой компании. Однако персонал продолжает мечтать о работе из дома: на снижение зарплаты ради удаленки согласны 4 из 10 россиян.

И работодатели, и соискатели стали тщательнее относиться к проверкам друг друга. Компании проверяют по отзывам в интернете. Соискателей — по кредитному рейтингу.

Меньше всего сложностей с трудоустройством сегодня — у молодежи 27—29 лет.

Привлекая персонал, работодатели стали чаще использовать родственные связи: чаще всего задействуют «сарафанное радио» промышленные предприятия и банки. 2 из 3 работодателей принимают на стажировки, а затем берут на работу молодых специалистов.

Работодатели чаще стараются прийти к компромиссу и не допустить увольнения ценных сотрудников.

Число россиян, согласных на «черную» или «серую» зарплату, за год практически не изменилось, что косвенно свидетельствует о стабильной ситуации на рынке труда.

Работодатели стали лояльнее относиться к подработкам. Сегодня найти дополнительную занятость можно практически в любой сфере деятельности и с любым уровнем образования.

Уровень дохода на подработке очень разный: есть варианты с проектной занятостью, со сдельной и повременной зарплатой в зависимости от специфики деятельности работодателя и предлагаемой работы. Доступны вакансии на неполную занятость для кандидатов с профильным опытом работы и без него.

Топ-5 сфер деятельности с наиболее высоким числом вакансий на подработку в июне 

(в порядке убывания количества вакансий):
• Службы доставки,
• Ритейл,
• Транспорт, логистика, склад,
• Общественное питание,
• Строительство, проектирование, недвижимость.