Showing posts with label безработица. Show all posts

Tuesday, February 18, 2025

golik ova

Голикова: к 2030 году нужно найти 11 млн новых работников


Работа по нацпроектам ведется исходя из необходимости заместить вышедших на пенсию 10,1 млн человек и привлечь еще 800 тыс., сообщила вице-премьер Голикова. Стоимость нацпроекта «Кадры» она оценила в 116 млрд руб.


К 2030 году в экономику необходимо привлечь в общей сложности 10,9 млн новых работников. Из них 10,1 млн должны заместить тех, кто выйдет на пенсию, а 800 тыс. необходимо привлечь дополнительно. Это следует из национального проекта «Кадры», который представили заместитель председателя правительства Татьяна Голикова и министр труда и социальной защиты Антон Котяков на заседании профильного комитета Государственной думы, передает корреспондент РБК.

Всего на проект планируется потратить 116 млрд руб., включая 113 млрд руб. из федерального бюджета, его основная цель — новая модель управления кадровым обеспечением страны, которая должна снизить дефицит кадров на 3,4% к 2030 году, сообщила вице-премьер Голикова.

Tuesday, February 4, 2025

in

Самые востребованные профессии в странах Европы


Европе очень нужны "айтишники": 9% всех открытых вакансий (это 871 тысяча штук, первое место по популярности) - это как раз специалисты по информационным и коммуникационным технологиям. На втором месте идут другие "айтишники" - разработчики (515 тысяч вакансий) и только на 3 месте - инженеры.

Из не-интеллектуальных специальностей очень востребованы рабочие на заводы (4 место по популярности, 385 тысяч вакансий), продавцы в магазины (6 место) и работники транспорта (7 место).

Friday, January 31, 2025

federal republic

Безработица в Германии достигла рекордного уровня за последние 10 лет


Число безработных в Германии в январе 2025 года достигло почти трех миллионов человек, что является самым высоким показателем с 2015 года. По данным Федерального агентства по труду, в стране зарегистрировано 2,993 миллиона безработных — на 186 тысяч больше, чем в декабре. Уровень безработицы вырос на 0,4 процентных пункта и составил 6,4%.

Рост безработицы в начале года — явление сезонное, однако слабость экономики все сильнее сказывается на рынке труда.

«Рост занятости хоть и продолжается, но теряет темпы», — заявила глава Федерального агентства по труду Андреа Налес.

В последний раз число безработных превышало три миллиона в феврале 2015 года. Эксперты ожидают, что рынок труда останется под давлением в ближайшие месяцы. В то же время замедление экономического роста, а также глобальная нестабильность могут продолжить негативное влияние на уровень занятости в Германии.


@BILD_Russia

Sunday, December 8, 2024

inspira

Dear Colleagues,

Please see attached JO 245877 in Inspira

Please found this job and thought you might find it interesting.

INTER-REGIONAL ADVISER, P5


United Nations

NEW YORK

You can view and apply for this job at:

https://inspira.un.org/psc/UNCAREERS/EMPLOYEE/HRMS/c/UN_CUSTOMIZATIONS.UN_JOB_DETAIL.GBL?Page=UN_JOB_DETAIL&Action=A&SiteId=1&JobOpeningId=245877&PostingSeq=1

Thank you.

Monday, February 19, 2024

the gender wage gap

Occupational characteristics and the gender wage gap among parents in Europe

February 19, 2024 Alícia Adserà and Federica Querin

The gender wage gap persists, especially among mothers. Alícia Adserà and Federica Querin show that despite low wages in predominantly male occupations that depend on heavy machinery, women (and chiefly mothers) are penalized by holding fewer jobs with leadership roles and more jobs that require frequent contact with others.


Despite important advances in closing the gender wage gap in most advanced countries over the last decades, progress has slowed or stalled during recent years. As women’s educational attainment now often surpasses that of men, explanations for the persistence of this gap point to gender-based differential sorting into sectors, and sorting on occupational characteristics within each sector (Goldin 2014; Blau and Khan 2017). Gendered occupational sorting increases in saliency for parents, who must juggle work and family demands.

In a recently published paper, we used data across 14 countries from the Program for the International Assessment of Adult Competencies (PIAAC), collected by the OECD in 2012, to examine the degree of sorting on occupational characteristics and its implications for the gender wage gap, with a focus on parents (Adserà and Querin 2023). For each individual, we matched occupational characteristics at 4-digit ISCO-08 codes with information from the O*NET databaseon the requirements and work content of occupations. We examined five occupational characteristics relating to the importance of interpersonal relationships in the job, the worker’s autonomy, and a time component. Each index is normalized to have mean of zero and a standard deviation of one.

Prevalence of occupational characteristics is gendered


• The first occupational characteristic is contact with others, which is defined by frequent interactions with peers such as colleagues, clients, and the public. It is closely linked with flexibility and ability to work from home, occupational characteristics that increased in relevance during the COVID-19 pandemic.
• The second, leadership, captures vertical hierarchical work relationships and involves guiding, directing, and coordinating other workers. Unlike contact with peers, leadership is associated with higher wages and, in general, tends to be male-dominated.
• Third, autonomy is defined as having a job characterized by control on the decision-making process. It is juxtaposed with machine-dependency, which involves the direct operation of machinery and vehicles that require the worker’s physical presence at the workplace. These latter occupations are frequently performed by men but, unlike most predominantly male occupations, often do not reap high wage returns.
• Lastly, time pressure and high frequency of deadlines captures the time squeeze that may be especially binding for parents.

Figure 1 shows that the gender differences (in standard deviations) in prevalence for the five occupational characteristics align with expectations. Only contact with others is, on average, more prevalent in jobs held by women, while machine use and leadership are much more prevalent in men’s jobs. In general, when we restrict the sample to parents, gender differences amplify. This is particularly evident in the increased gap between mothers and fathers in occupations with more autonomy and leadership. For example, mothers’ occupations are associated with 0.30 standard deviations fewer leadership requirements than fathers, while this difference increases to 0.36 standard deviations fewer among childless individuals.
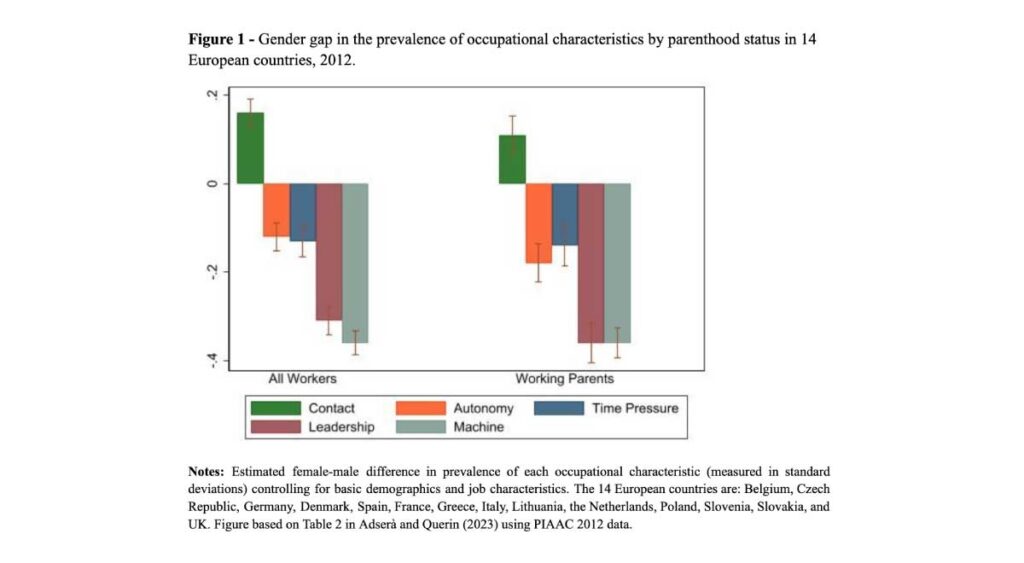
While there is no difference in machine use between fathers and childless men, it is fathers who most frequently hold leadership roles, in line with previous research on the existence of both a glass ceiling for women and a fatherhood premium. The sizable autonomy of fathers might be consistent with their jobs being more associated with managerial positions than those of younger (childless) workers. Interestingly, mothers less frequently work in high contact occupations than childless women (even though they do so more than fathers), indicating a shift towards occupations that allow for greater flexibility.

Geographical differences


To account for substantial labor markets differences within Europe, we group countries in our sample according to the Eurofound classification that captures industrial relations in the EU and that nicely aligns with differences in welfare systems and gender norms across Europe. These groups are Continental Europe (Belgium, Germany, France, The Netherlands), Southern Europe (Spain, Greece, Italy), Eastern Europe (Czech Republic, Lithuania, Poland, Slovenia, Slovakia), with the UK representing Anglo-Saxon countries, and Denmark Nordic countries.

While prevalence results hold in all countries, the gender gap in leadership is particularly large in Southern Europe and between mothers and fathers in Eastern and Continental Europe. Southern and Eastern Europe also display gender gaps in autonomy. Taken together, the prevalence findings are indicative of more gender-based occupational sorting in Eastern and Southern Europe.

High wages for leadership and autonomy contribute to the gender wage gap


Two main factors pulling in opposite directions emerge when estimating the contributions of occupational characteristics to the gender wage gap. On the one hand, occupations involving more contact with others are generally less well paid. This increases the gender wage gap as we show that contact is more prevalent in women’s occupations (Figure 1). On the other hand, the fact that male-dominated machine-dependent occupations are poorly paid partially closes the gender wage gap. However, women who work in machine-dependent occupations are paid even less than their male counterparts, while men who work in contact with others are not penalized. This, in combination with a wage premium for (male) leadership and autonomy, tips the balance for a persisting gender wage gap.

Gender wage gaps persist after adjusting for occupational characteristics


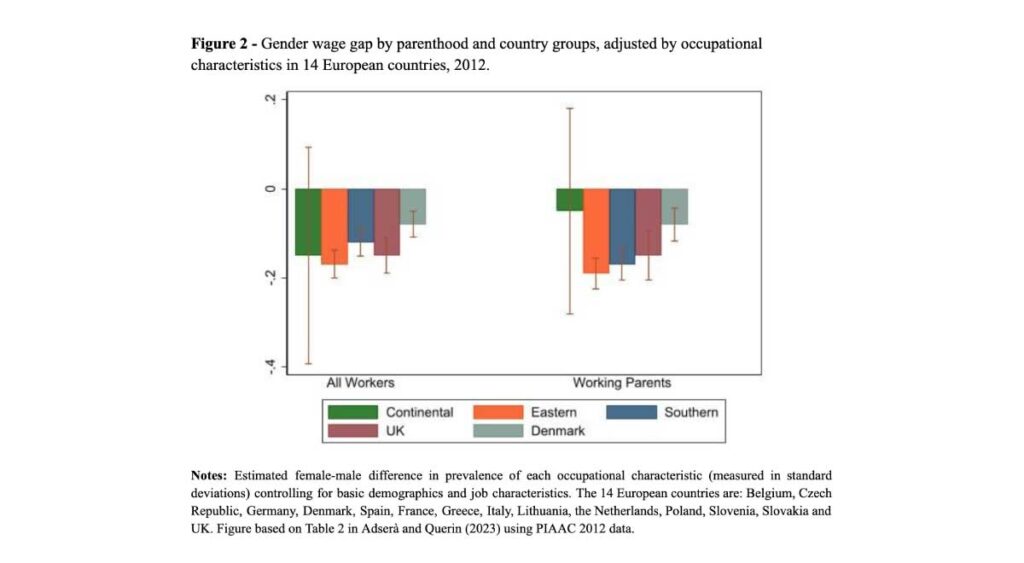
Figure 2 shows that in all countries, except those in Continental Europe, adjusted gender wage differences (measured in log gross hourly earnings) are still significant even after controlling for demographic and employment characteristics such as education and whether respondents work in the public sector or on temporary contracts, as well as for the five above-mentioned occupational characteristics and their interactions with gender.

Eastern Europe shows the largest gender wage gap (and Denmark the lowest) both for all workers and for parents. Restricting the sample to parents leads to a widening of the adjusted gap, especially in Southern Europe, where reconciling work and family is especially complicated for women.

Thus, even accounting for a sizable occupational sorting and for differential wage returns to occupational characteristics, Figure 2 clearly shows a persistent gender wage gap that calls for further research.
References

  • Adserà, A., & Querin, F. (2023). The Gender Wage Gap and Parenthood: Occupational Characteristics Across European Countries. European Journal of Population, 39(1), 34.
  • Blau, F.D., and Kahn, L.M. (2017). The Gender Wage Gap: Extent, Trends, and Explanations. Journal of Economic Literature 55(3):789–865.
  • Goldin, C. (2014). A Grand Gender Convergence: Its Last Chapter. American Economic Review104(4):1091–1119

Monday, February 5, 2024

Demographic and occupational change in Europe:

gender, education, and age disparities

February 5, 2024 Álvaro Mariscal‐de‐Gante, Amaia Palencia‐Esteban, Sara Grubanov‐Boskovic and Enrique Fernández‐Macías

Over the last decades, the working population in Europe has become older, more feminized, and more educated. However, Álvaro Mariscal‐de‐Gante, Amaia Palencia‐Esteban, Sara Grubanov‐Boskovic and Enrique Fernández‐Macías argue that female occupational improvements have been insufficient to close the gender gap, and find declining occupational returns to education for highly educated women in two countries. Conversely, European labour markets have been able to accommodate the growing number of older workers, despite some occupational downgrading.


European societies are undergoing significant demographic changes, most notably the trend towards feminization and ageing of their workforce. Intertwined with a process of educational upgrading, these shifts are reshaping the landscape of the continent’s labour market (Lutz and Skirbekk 2014).

To respond to these challenges, the European Union (EU) and its member states have implemented a series of policy initiatives aiming to promote longer working lives and reform social protection and pension systems. In 2020, the EU’s Green Paper on ageing outlined strategies for addressing these challenges, propelling the twin transitions towards a greener and more digital Europe while nurturing the ageing population’s potential (European Commission 2022).

In a recent paper on this topic (Mariscal‐de‐Gante et al 2023), we used recent occupational and demographic data for six European countries to briefly illustrate and discuss three of these major demographic challenges, namely gender disparities in the labour market, the effects of educational improvements on employment, and the ageing of the working population.

Has increased female participation widened the gender occupational gap?


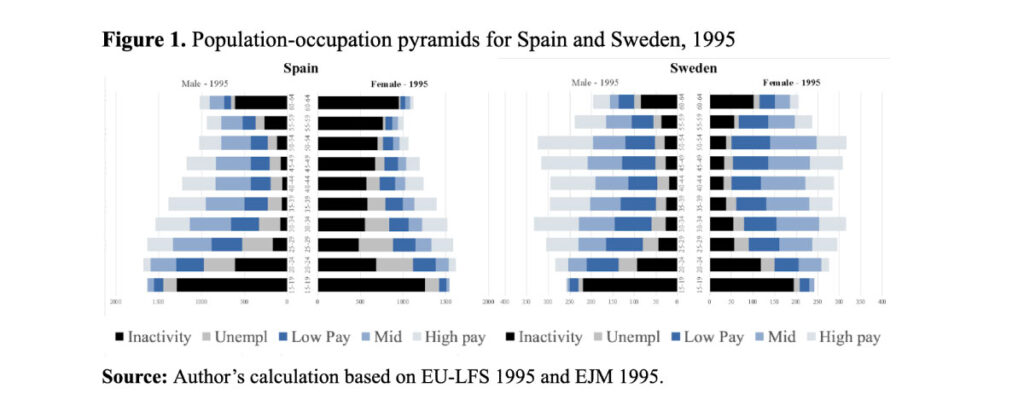
Population pyramids intuitively show the major demographic changes faced by European countries over the last 25 years. In 1995, countries like Spain, Italy, or the Czech Republic still exhibited the classical pyramidal shape, reflecting a great number of young workers and smaller cohorts of old individuals. In contrast, Germany, Sweden, and France already showed a narrowing base, indicating earlier declines in fertility rates and incipient population ageing (Spain and Sweden are shown in Figure 1). Despite these differences in structural demographic shifts, a common thread ran through all these countries: inactivity, unemployment, and low-paid jobs were relatively more prevalent among women.
Between 1995 and 2019, while inactivity and unemployment tended to decline significantly, there was a widespread process of occupational upgrading, with growing employment shares in relatively high-paid jobs. Although this upgrading process was particularly important for women (Spain is noteworthy example), such improvement was certainly not enough to achieve gender parity. In fact, the female-to-male ratio in low-paid jobs increased from 1995 to 2019, and the female occupational structure is still clearly more polarized than that of men, reflecting the difficulties that women face during their professional career (Card et al. 2016). Thus, we can answer our first question by saying that, despite significant progress, occupational gender gaps remain large in European labour markets.

Has educational upgrading benefitted the labour market position of women?


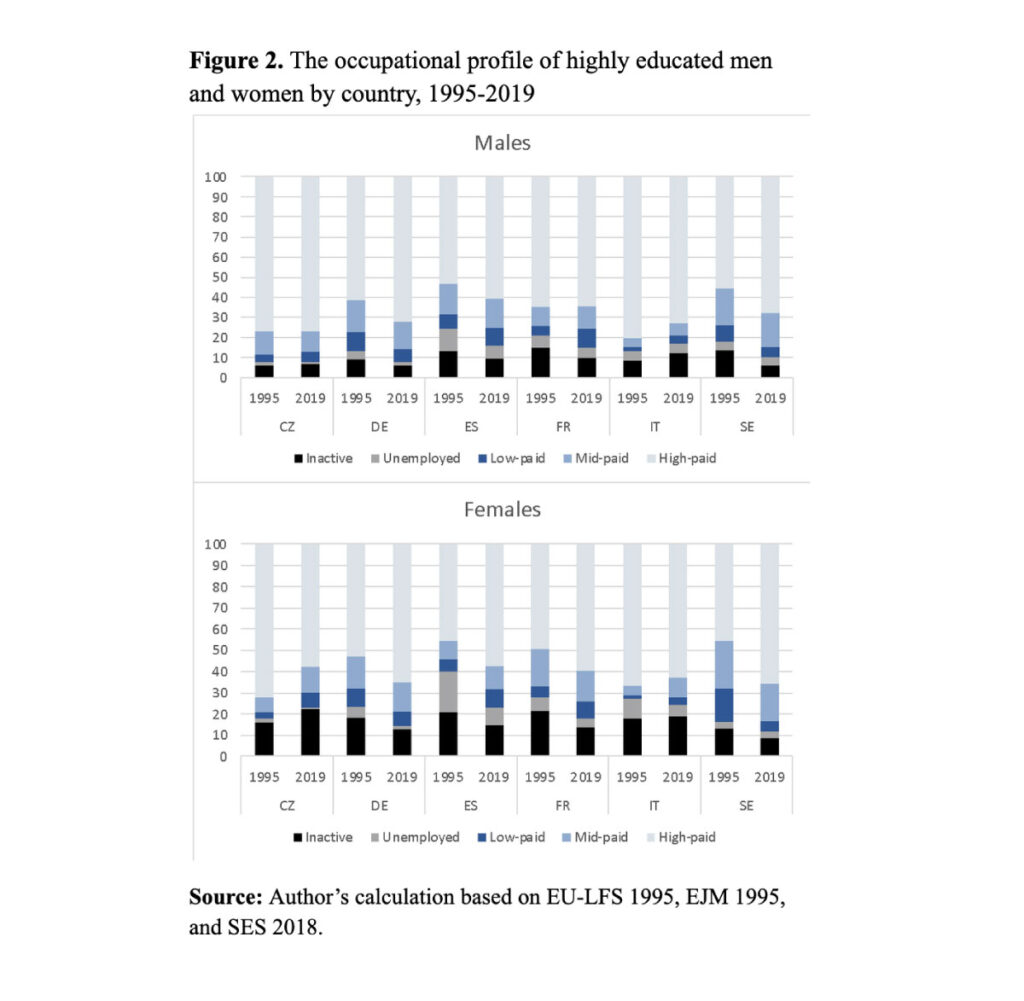
Over the last quarter of century, Europe has experienced a significant expansion of tertiary education coupled with a decline in primary education. This expansion has been stronger among women: for instance, in Spain the proportion of prime-aged female workers has increased by 31 percentage points as opposed to only 20 percentage points for men. But has their occupational position improved likewise?

First, it must be noted that this educational upgrading has not been equally absorbed by all European labour markets, as illustrated in Figure 2. In the case of highly educated workers, their occupational profile has clearly improved in Germany, Sweden and, to a lesser extent, in Spain and France, while deteriorating in Italy and the Czech Republic. These patterns seem to run more or less in parallel with gender occupational dynamics. While women’s profile improved more than men’s in Sweden, Germany, Spain and, to a lesser degree, in France, the occupational position of highly educated female workers worsened in Italy and the Czech Republic. In fact, in the latter two countries, the occupational outcomes of highly qualified female workers declined in relative terms, despite an educational profile that increased over the period more than that of men.

How has the occupational profile of old and young workers changed?


In the last 25 years, the European population has been ageing, with a growing share of older workers and a declining share of younger ones. Faced with this reality, some scholars have hypothesized that given the disparities in numbers of competitors, different generations will experience different labour market outcomes,. Accordingly, these so-called cohort-crowding effects might harm the occupational prospects of (abundant) older workers and enhance those of (scarce) young workers.
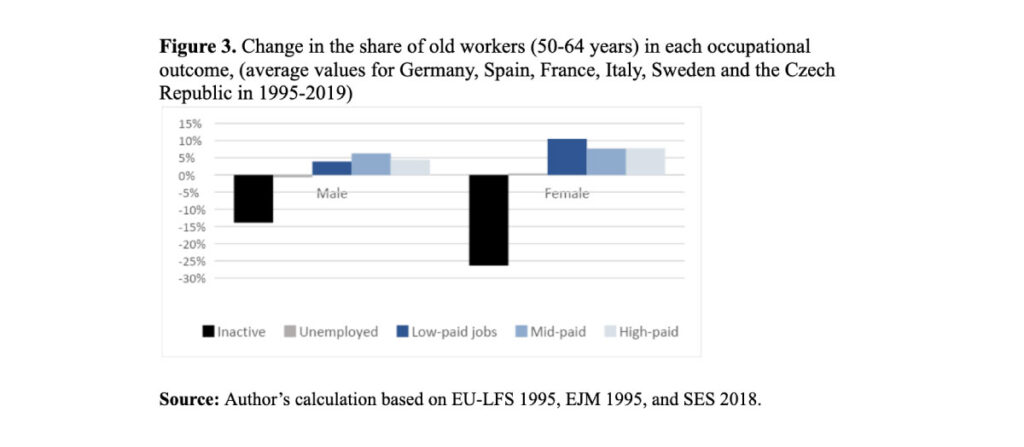
In terms of overall employment, European labour markets have been able to accommodate large expansions in the cohorts of old workers: inactivity rates have fallen quite drastically without an equivalent growth in unemployment. If we look at the occupational profiles, however, our analysis also reveals some deterioration, which again appears to be gender-biased as it affects older women more acutely. The shrinking of the younger cohorts, on the other hand, does not seem to be associated with any significant change in their occupational outcomes.

In conclusion…


Understanding the interplay of demographic shifts and occupational changes is vital for policymakers and researchers interested in addressing persistent disparities in the labour market. As the labour market continues to evolve, in many cases towards an ageing and feminized workforce, European experiences provide valuable insights into this multifaceted interaction. Impressive strides in women’s labour participation and education have (so far) failed to bridge occupational disparities, often leading to lower-paid positions. Together with cross-country differences, the old continent’s evolution over the last 25 years may underscore the importance of public institutions. The path towards true gender equality in the labour market calls for reinforced policies addressing the diverse factors that explain the persistence of gender occupational gaps, from early education choices and uneven household workload to outright discrimination.

References

  • Card D., Cardoso A., Kline P. 2016. Bargaining, Sorting, and the Gender Wage Gap. Quantifying the Impact of Firms on the Relative Pay of Women. The Quarterly Journal of Economics 131(2): 633–686. https://doi.org/10.1093/qje/qjv038
  • EJM. 1995. European Jobs Monitor.
  • EU-LFS. 1995. European Union Labor Force Survey.
  • European Commission, Directorate-General for Communication, Green paper on ageing, Publications Office of the European Union. 2022. https://data.europa.eu/doi/10.2775/785789
  • Lutz W., Skirbekk V. 2014. “How Education Drives Demography and Knowledge Informs Projections.” In W. Lutz, W.P. Butz, S. KC (Eds.) World Population and Human Capital in the 21st Century, Oxford: Oxford University Press: 14–38.
  • Mariscal‐de‐Gante Á., Palencia‐Esteban A., Grubanov‐Boskovic S., Fernández‐Macías E. 2023. Feminization, Ageing, and Occupational Change in Europe in the Last 25 Years. Population and Development Review. https://doi.org/10.1111/padr.12586
  • SES. 2018. Structure of Earnings Survey.

Monday, October 30, 2023

almost in Russian

Early disengagement from education and work: “ninihood” in Latin America

October 30, 2023 Chia Liu, Andrés F. Castro Torres and Ewa Batyra

Latin America faces a unique societal challenge: high numbers of young adults, especially women, who neither work nor pursue education, known colloquially as “nini.” Using census microdata for 12 countries, Chia Liu, Andrés Castro Torres, and Ewa Batyra examine the dynamics of young adults’ disengagement from public spheres (e.g., formal work and formal education) and shed light on the roles of family, gender, and social class as significant determinants of “ninihood”.


The term “nini” encapsulates the plight of young adults who find themselves disconnected from both work and education (De Hoyos, Popova, & Rogers, 2016). It’s estimated that almost 20% of youths between 15 to 25 years old in Latin America are part of this group. At the same time, early parenthood and union formation are widespread in Latin America, where many young adults, particularly women, are occupied with household and care work. To cast light on this complex socio-economic landscape, in a recently published paper, we explored the dynamics between parenthood, gender roles on one side, and labour force and formal educational participation on the other (Liu, Castro Torres & Batyra, 2023).

The “nini” phenomenon: gender and social class dynamics


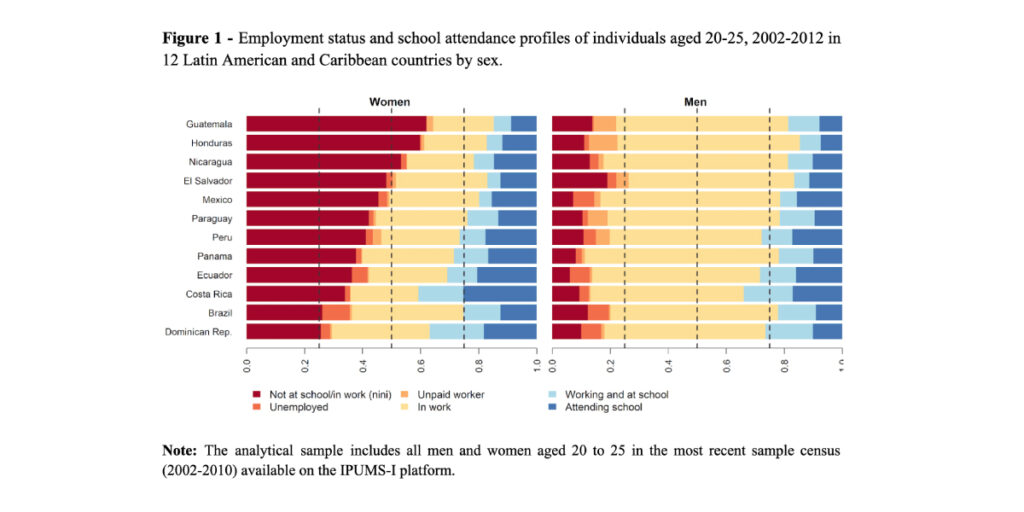
In the 12 Latin American countries under study, a significant proportion of women aged 20 to 25, at least one out of every four, can be categorized as “ninis”. In Guatemala, Honduras, and Nicaragua, this proportion is even higher, above 50%. On the other hand, among men in the same age group, the percentage is notably lower, below 20% (Figure 1).
The discussion pertaining to “ninihood” is delicate. Latin America is a region with large informal labour markets, with many people working in the shadow economy, and therefore rarely captured in official data. Thus, the term is controversial because informal and uncompensated work is often left out of the picture. Despite the importance of these under-acknowledged work activities, those not engaged in formal education or the formal labour market have been found to experience high levels of insecurity. The “nini” phenomenon, essentially an early disengagement from education and work, has wide-ranging consequences, such as limited lifetime earnings, economic vulnerability and social marginalization. At the societal level, untapped human potential hampers economic growth, while unmet needs may fuel social unrest.

Given the stark differences in “ninihood” between men and women observed in Latin America (Figure 1), our study delves into the intricate relationship between early family formation, especially for women, and the accumulation of human capital. The gender and social class gradients that emerge underscore the challenges women face in remaining visible in the formal public sphere: disengagement primarily affects socially disadvantaged women, especially in Central America. Women from lower social origins who leave the parental home to enter conjugal union and parenthood at younger ages are particularly at risk. Being in a partnership increases the risk of being a “nini” for women, but reduces it for men, confirming the pervasiveness of the male breadwinner model in conjugal households.

Implications for policy and gender equality


Early family formation heightens the risk of exclusion from formal institutions and social safety nets. For those who fall into the “nini” category, transitioning into adulthood is fraught with challenges, leading to disparities in access to vital resources like unemployment insurance, healthcare, and pension schemes. Our findings emphasize the critical role of women’s engagement in the formal labour market, particularly in a context of limited social protection and single motherhood, and prompts us to reconsider how we view women’s engagement with public life, especially in the Global South.

This work on early parenthood, gender roles, and labour force participation in Latin America shines a light on the complexities behind the “nini” phenomenon. The results underscore the urgent need for governments to address the issue of disengagement from the public sphere, by improving access to employment and education, for example, especially among women and lower socio-economic classes. As Latin America strives for inclusive growth and development, acknowledging the role of early family formation and gender dynamics is essential for fostering economic security, social equality, and individual well-being.

References

Wednesday, October 25, 2023

How long do older Germans work?

October 23, 2023 Christian Dudel, Elke Loichinger, Sebastian Klüsener, Harun Sulak and Mikko Myrskylä

Rapid population aging may undermine the viability of the German pension system. Is working longer a remedy? Christian Dudel, Elke Loichinger, Sebastian Klüsener, Harun Sulak, Mikko Myrskylä analyse what is known about employment in later adult life in Germany. Employment trends are on the increase, but with considerable socioeconomic differences.


Germany is aging


The German population is among the oldest in the world and is aging rapidly. Projections of the German Federal Statistical Office (Statistisches Bundesamt, 2022) indicate that in 2050 around 26% of the population will be over age 67, which will be the statutory retirement age by 2031. As the number of retirees increases and the workforce shrinks (Fuchs et al. 2018), this rapid population aging will be a challenge for the German social security system, and for the German pension system in particular.

Extending the length of working life has been proposed as a remedy, as it increases the size of the workforce while reducing the number of retirees. Several institutions, such as the European Commission and the OECD, have been advocating for this shift (e.g., European Commission, 2010; OECD 2015). Meanwhile, many countries, including Germany, have implemented reforms with the major goal of prolonging working life. For instance, the statutory retirement age in Germany is currently being increased from 65 to 67.

Inequalities in the length of working life


Policies aimed at extending working life often follow a one-size-fits-all approach. As these policies are frequently applied with few or no exceptions, or are aimed at workers in stable employment (e.g., Phillipson 2019), they might have negative effects on more economically insecure and vulnerable groups. For instance, increasing the retirement age for almost everyone, as is currently the case in Germany, may increase the duration of working life for highly educated men with high employment rates, while low educated individuals face a high risk of unemployment during the additional years they are forced to stay in the labor market.

A series of studies in several countries have revealed substantial socioeconomic inequalities in the length of working life (e.g., Dudel & Myrskylä 2017). In a recent paper (Dudel et al. 2023), we provide new evidence of such inequalities for older workers in Germany, and focus on several dimensions of inequality: gender, occupation, education, and region (distinguishing between the former socialist eastern Germany and western Germany). Below we provide an overview of some of the key findings, focusing on general trends and inequalities by education.

General trends in Germany


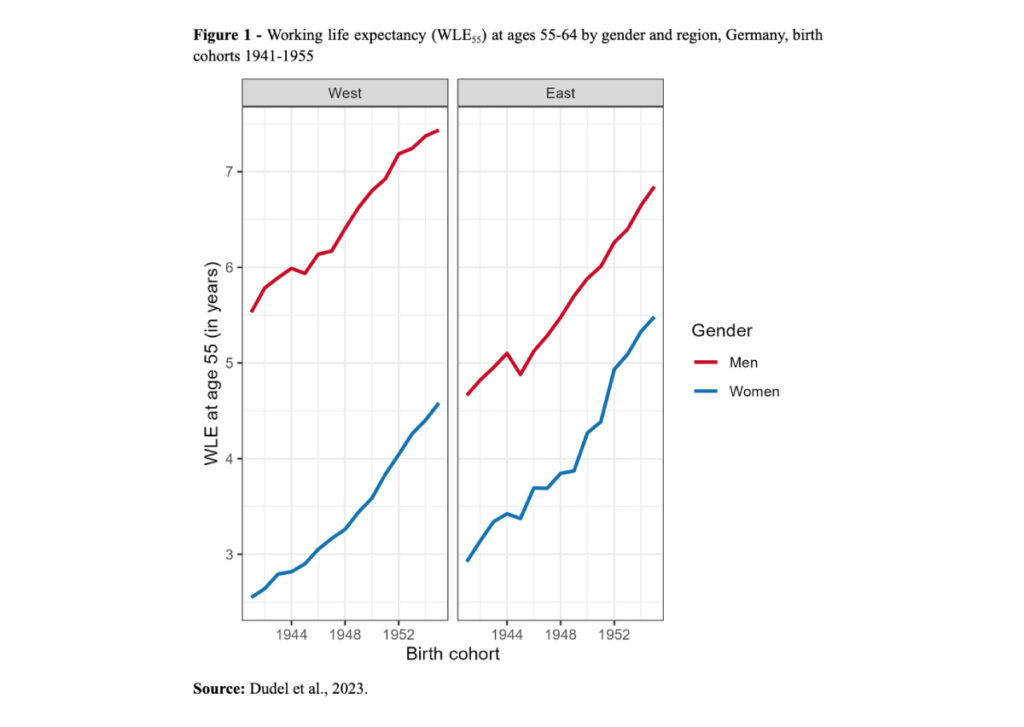
Our key indicator is working life expectancy (WLE55), defined as the average remaining lifetime spent in work. It is measured in years and, for our study, we computed it between ages 55 and 64, adjusting it for working hours. This means that our results are based not only on whether individuals are or are not gainfully employed, but also on whether they are working full- or part-time. We used data from the German Microcensus for the years 1996 to 2019, and calculated WLE55 for the cohorts born between 1941 and 1955 (Fig. 1).
For instance, the number of additional years western German men could expect to remain employed at age 55 rose from 5.5 years for those born in 1941 to 7.4 years for those born in 1955. For all groups, WLE55 increased by around 2.0 to 2.5 years over the observed birth cohorts. This shift is likely attributable to several factors, including pension reforms aimed at extending working life and better health among younger cohorts.

In both western and eastern Germany, men worked for longer than women. However, the gender gap was always smaller in the east than in the west, and it decreased somewhat in eastern Germany, while remaining roughly constant in western Germany. Similarly, eastern German women worked longer than their western German counterparts. Among men, by contrast, the opposite pattern is observed, with western German men working longer. These regional and gender differences are legacies of eastern Germany’s socialist past and the unification process. When the east was socialist, policies aimed at integrating women into the labor market led to higher female employment rates in eastern Germany than in the west. This pattern continued after German unification, even during periods when unemployment rates in eastern Germany were high.

Educational inequalities in Germany


Employment in late adult life depends also on education, for which, in our paper, we considered three levels:
• low (equivalent to ISCED levels 0 to 2),
• medium (ISCED levels 3 to 4), and
• high (ISCED levels 5 to 6).

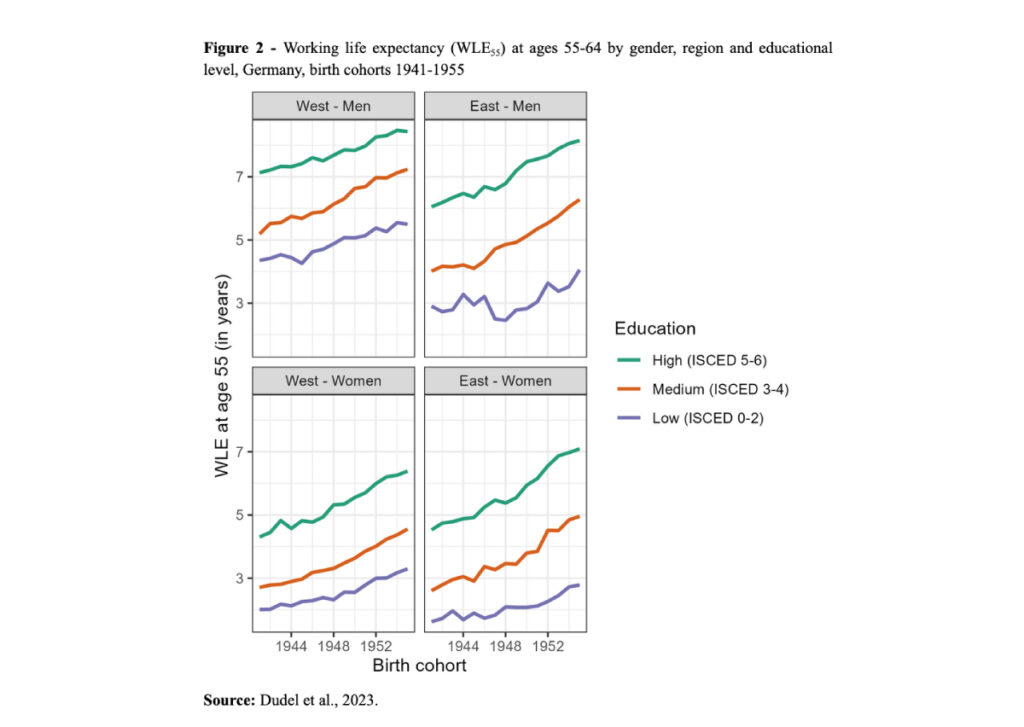
Results are displayed in Figure 2. When interpreting them, it is important to keep in mind that the lowest educational group is smaller and more selective in eastern than in western Germany, as less than 10% of the population aged 55 to 64 in eastern Germany have low educational attainment.
On average, WLE55 increased for all educational groups, but with considerable heterogeneity in both level and pace. For instance, beyond age 55, low-educated eastern German women worked, on average, only three additional years, while highly educated western German men worked almost nine. Moreover, in eastern Germany, the increase in WLE55 was notably smaller for low-educated individuals than for the other educational groups. For example, the gap between highly educated and low-educated eastern German men increased from roughly three to four years.

Conclusions


In summary, the length of late working life has been steadily increasing in Germany for all the socioeconomic groups we considered. This trend is in line with the aim of many recent policy reforms to increase retirement age. However, our findings show that there are substantial and increasing socioeconomic inequalities in the length of working life after age 55 among older workers. Researchers and policymakers should focus more on these inequalities, as they might be outcomes of systematic social disadvantages among specific groups of older workers. To help us better understand inequalities in WLE55, we are currently extending our calculations of WLE to cover all working ages. If, for instance, low-educated workers start working at earlier ages than highly educated workers, inequalities in total WLE might be smaller than inequalities in just WLE55, i.e. among older workers only.

References

  • Dudel, C., Myrskylä, M. (2017): Working Life Expectancy at Age 50 in the US and the Impact of the Great Recession. Demography 54: 2101-2123.
  • Dudel, C., Loichinger, E., Klüsener, S., Sulak, H., Myrskylä, M. (2023): The extension of late working life in Germany: trends, inequalities, and the East-West divide. Demography. https://doi.org/10.1215/00703370-10850040
  • European Commission (2010): Annual growth survey: Advancing the EU’s comprehensive response to the crisis.
  • Fuchs J., Söhnlein D., Weber B., Weber E. (2018). Stochastic forecasting of labor supply and population: an integrated model. Population Research and Policy Review, 37, 33-58.
  • OECD. (2015): Pensions at a glance 2015. Available at OCED.
  • Phillipson C. (2019). “Fuller” or “extended” working lives? Critical perspectives on changing transitions from work to retirement. Ageing & Society, 39, 629-650.
  • Statistisches Bundesamt, 2022: 15. koordinierte Bevölkerungsvorausberechnung – Deutschland. Available online.

Wednesday, September 27, 2023

Gender Studies for Men

Gender Studies for Men @JohnDavisJDLLM

Gee. Men have to work for the same money as women but men incur 95% of work casualties, pay 82% of taxes, can be wiped out in a divorce court in seconds, are discriminated against in education ... I wonder why men are leaving the workforce?


12:27 AM · Sep 27, 2023

Thursday, August 17, 2023

Job Openings Trend Down, Still Outnumber Jobless By Far

The number of job openings in the United States continued its downward trend in June 2023, as the labor market appears to be coming off the boil. According to the latest Job Openings and Labor Turnover Survey (JOLTS), 9.58 million positions remained unfilled on the last business day of June, the lowest reading since April 2021 and only the fourth time in the past two years that job openings dropped below the 10-million mark.

With 9.58 million job openings and just 5.96 million people officially unemployed, there's still more than 1.6 unfilled positions for every job seeker, indicating that the imbalance between labor demand and supply, identified by the Fed as one of the factors driving inflation, persists, although it is no longer as extreme as it was throughout 2022. Before the pandemic hit in March 2020, there had been 1.2 job openings per unemployed person in an already tight labor market. That indicator then crashed to 0.2 by April 2020 amid mass layoffs in sectors affected by Covid restrictions before climbing as high as 2.0 job openings per unemployed person by March 2022, at the height of the "Great Resignation".

Fed Chair Jerome Powell has repeatedly stressed that the labor market needs to balance out to relieve upward pressure on wages and thus cool inflation. The fact that inflation has come down notably despite the labor market remaining strong has fueled hopes of a soft landing, although the FOMC meeting minutes released on Wednesday revealed that Fed officials still see significant upside risk to inflation.Job Openings Trend Down, Still Outnumber Jobless By Far

Wednesday, August 16, 2023

gender roles ?

ВВП на 1 жителя и на 1 работника в некоторых странах мира и Европы в 2021 г. ( тыс. долларов США по ППС в постоянных ценах 2017 г.).


О том как демография (этап демографического перехода и его скорость) и занятость (в т.ч. из-за устаревших гендерных ролей [это врятли]) влияют на богатство нации.

Итальянцы производительностью труда обошли немцев (причем давно), турки догнали британцев, румыны японцев, а россияне киприотов.

Данные: World Bank

income coming

257000 рублей — средний желаемый доход москвичей на семью из трех человек


По итогам 2022 года среднемесячная начисленная заработная плата в столице составила 122,8 тыс. руб. На семью из 3 человек среднестатистический москвич хотел бы иметь доход в 257 тыс. руб. в месяц. Запросы отцов семейств в среднем выше, чем женщин. В опросе сервиса по поиску высокооплачиваемой работы SuperJob приняли участие 1000 представителей экономически активного Москвы, состоящих в браке и имеющих одного несовершеннолетнего ребенка.

Только 2 из 100 москвичей на семью из трех человек было бы достаточно дохода до 100 тыс. руб. в месяц. От 100 до 150 тыс. руб. хотел бы иметь каждый шестой (17%), каждый пятый считает достаточной сумму от 150 до 200 тыс. руб. (19%). На жизнь семьи из 3 человек 15% хотели бы тратить от 200 до 250 тыс. руб., 16% — от 250 до 300 тыс. руб. Более крупные суммы называли реже: от 300 до 350 тыс. руб. удовлетворили бы каждлого десятого, от 350 до 400 тыс. руб. — 7%, от 400 до 450 и от 450 до 500 тыс. руб. — по 2%. Более полумиллиона рублей в месяц хотели бы тратить на семью из трех человек 7%.

По расчетам SuperJob, средний желаемый доход составил 257 [тыс, водка же не 2.12, но в оригинале так – именно руб.] руб. в месяц. У мужчин запросы чуть выше: в среднем они хотели бы иметь 266 тыс. руб. на трех человек, тогда как женщины — 246 тыс. руб. Напомним, что для счастья москвичу нужно 260 тыс. руб. в месяц на одного! Эта сумма сравнима с желаемым бюджетом на семью из трех человек.

Место проведения опроса: Москва
Время проведения: 3 июля — 11 августа 2022 года
Исследуемая совокупность: экономически активное население Москвы старше 18 лет, состоящее в браке и имеющее 1 несовершеннолетнего ребенка
Заказчик: Москва24
Размер выборки: 1000 респондентов

Подробнее

Monday, July 10, 2023

a woman in need is a woman indeed

Дети для счастья женщинам нужны так же, как карьера


Залогом женского счастья мужчины чаще всего считают любовь, а сами женщины — достаток. При этом карьера в глазах современных женщин почти так же важна, как и материнство. В опросе сервиса по поиску высокооплачиваемой работы SuperJob приняли участие 3000 представителей экономически активного населения из всех округов страны.

По мнению мужчин, счастливой женщину делает в первую очередь любовь — в этом убеждены 57% опрошенных. Каждый второй (52%) считает главной составляющей женского счастья семью, 41% — материнство, 40% — достаток. Без секса не считают возможным женское счастье 23% мужчин, без привлекательной внешности —16%, замужества — 15%. Каждый восьмой представитель сильного пола (12%) уверен в значимости для женщин свободы, каждый девятый (11%) — карьеры, каждый десятый (10%) — творчества, а 6% — дружбы.

Представления женщин о том, что им нужно для счастья, заметно отличаются от мужских. На первое место представительницы прекрасного пола ставят достаток (59%), на второе — любовь (57%), на третье — семью (53%). Материнство и карьера имеют почти одинаковое значение: их назвали главной составляющей счастья 35% и 33% женщин соответственно. Свобода важна для 30%, творчество — для каждой четвертой (25%), привлекательная внешность — для 18%, дружба — для 14%. Секс и замужество как главные составляющие счастья называли только 10% и 7% женщин соответственно.

Карьеру, свободу, дружбу и творчество чаще называют важными составляющими женского счастья опрошенные в возрасте до 34 лет, а материнство и замужество — старшее поколение. Чем выше доход респондентов, тем более значима для них любовь.

По сравнению с 2010 годом, и мужчины, и женщины стали реже считать залогом женского счастья замужество, материнство, семью, внешность, любовь и сексуальную реализацию. Значимость дружбы, свободы и творчества, напротив, возросла в глазах представителей обоих полов.Женщины стали чаще называть важным аспектом счастья достаток.

Место проведения опроса: Россия, все округа
Населенных пунктов: 569
Время проведения: 24 июня — 7 июля 2023 года
Исследуемая совокупность: экономически активное население России старше 18 лет
Размер выборки: 3000 респондентов

Подробнее

Thursday, July 6, 2023

mow labor market

Рынок труда: итоги полугодия


Динамика в сфере оплаты труда


56% работодателей индексировали зарплаты в течение последних 6 месяцев.

Динамика зарплатных предложений работодателей в Москве за I полугодие

Высокий темп прироста зарплатных предложений работодателей SuperJob фиксирует в IT: +8,2% по отношению к июню 2022 года, +3,3% к январю 2023 года. Рост зарплат замедляется. Напомним, что рекордным для IT по этому показателю стал 2021 год (+26,3%): зарплаты во время пандемии росли быстрыми темпами на фоне инфляции и перестройки экономики.

SuperJob наблюдает в IT-сфере тренд на отказ от требования о наличии высшего образования. Однако среди соискателей в IT пока по-прежнему преобладают выпускники вузов. Мало того, есть четкая зависимость уровня зарплат программистов от «престижности» университета, который они закончили: самые высокие средние заработки в IT — у выпускников МФТИ, ИТМО, МГУ, Бауманки и МИФИ.

Динамика числа вакансий в различных сегментах рынка труда за I полугодие


Наиболее высокие темпы роста спроса на персонал по итогам первого полугодия SuperJob фиксирует в промышленности: вакансий стало больше в 1,5 раза. Наиболее востребованы квалифицированные рабочие (слесари, операторы станков, монтажники), ИТР (технологи, конструкторы, наладчики) и мастера цехов.

Сезонное увеличение числа вакансий наблюдается в сфере туризма, гостиничного и ресторанного бизнеса (+46%). Наиболее высоким спросом пользуются повара различных специализаций, кухонные работники и официанты.

Количество вакансий в строительстве выросло на 39%. Особенно востребованы среди рабочих машинисты спецтехники, электромонтажники, отделочники, среди ИТР — инженеры ПТО, проектировщики, сметчики.

Как изменились настроения работодателей и поведение соискателей


Удаленки все меньше, дистанционные сотрудники, работающие из-за рубежа, есть в каждой одиннадцатой компании. Однако персонал продолжает мечтать о работе из дома: на снижение зарплаты ради удаленки согласны 4 из 10 россиян.

И работодатели, и соискатели стали тщательнее относиться к проверкам друг друга. Компании проверяют по отзывам в интернете. Соискателей — по кредитному рейтингу.

Меньше всего сложностей с трудоустройством сегодня — у молодежи 27—29 лет.

Привлекая персонал, работодатели стали чаще использовать родственные связи: чаще всего задействуют «сарафанное радио» промышленные предприятия и банки. 2 из 3 работодателей принимают на стажировки, а затем берут на работу молодых специалистов.

Работодатели чаще стараются прийти к компромиссу и не допустить увольнения ценных сотрудников.

Число россиян, согласных на «черную» или «серую» зарплату, за год практически не изменилось, что косвенно свидетельствует о стабильной ситуации на рынке труда.

Работодатели стали лояльнее относиться к подработкам. Сегодня найти дополнительную занятость можно практически в любой сфере деятельности и с любым уровнем образования.

Уровень дохода на подработке очень разный: есть варианты с проектной занятостью, со сдельной и повременной зарплатой в зависимости от специфики деятельности работодателя и предлагаемой работы. Доступны вакансии на неполную занятость для кандидатов с профильным опытом работы и без него.

Топ-5 сфер деятельности с наиболее высоким числом вакансий на подработку в июне 

(в порядке убывания количества вакансий):
• Службы доставки,
• Ритейл,
• Транспорт, логистика, склад,
• Общественное питание,
• Строительство, проектирование, недвижимость.

Wednesday, June 21, 2023

about trust

Россияне стали вдвое реже хранить личные файлы на рабочих компьютерах


За последние 9 лет работодатели стали реже запрещать сотрудникам хранить на рабочих компьютерах личную информацию. В свою очередь, персонал стал почти вдвое реже сохранять на служебных устройствах свои фото, видео, музыку и другие файлы. В опросах сервиса по поиску высокооплачиваемой работы SuperJob приняли участие представители 1000 компаний и 1600 сотрудников, имеющих рабочие компьютеры, из всех округов страны.

Запрет на хранение личных файлов на рабочих компьютерах сегодня есть в 18% российских компаний. Чаще всего работодатели объясняют это требованиями безопасности, а также соображениями дисциплины. По сравнению с 2014 годом запрещать держать на рабочих компьютерах фотографии, музыку, фильмы и другие личные документы стали чуть реже.

В том, что они хранят на рабочем компьютере личные файлы, признаются 23% работающих, причем 2% делают это вопреки запрету работодателя, а каждый пятый (21%) сообщает, что такого рода ограничений в их компании нет. Не захламляют рабочий компьютер персональной информацией 77% опрошенных, причем из-за прямого запрета этого не делают только 22%, а 55% — по иным причинам: «Давно храню все в облаке»; «Не хочу, чтоб это куда-то утекло».

Чем старше респонденты, тем чаще они с согласия работодателя держат личные файлы на рабочем компьютере: если среди опрошенных до 34 лет так поступают 17%, то среди старшего поколения — почти каждый четвертый (24%). Тех, кто спокойно сохраняет на рабочий компьютер фотографии, музыку, видео и т.д., больше среди россиян с высокой зарплатой (24%). Женщины более щепетильно относятся к границам между работой и частной жизнью: они чаще мужчин сообщают, что не хранят на рабочем компьютере личные файлы, хотя это не запрещено (57% против 53%).

За последние 9 лет россияне стали почти вдвое реже хранить личные файлы на ресурсах работодателя. Сказывается развитие интернет-сервисов (таких как, к примеру, онлайн-кинотеатры и облачные хранилища данных), а также более осторожное отношение к вопросам безопасного хранения персональной информации.

О том, что кибербезопасность остается актуальнейшим для бизнеса вопросом, свидетельствует и динамика зарплат соответствующих специалистов. Так, доходы директоров по безопасности на последние 12 месяцев выросли в среднем на 5,3%, их средняя зарплата составляет 400 тыс. руб., а максимальная — 800 тыс. руб. У руководителей отделов информационной безопасности годовой прирост зарплат составил 3,3%, у специалистов по информационной безопасности — 2,9%.

Место проведения опроса: Россия, все округа
Населенных пунктов: 286
Время проведения: 5—20 июня 2023 года
Исследуемая совокупность: менеджеры по персоналу и другие представители кадровых служб предприятий и организаций, ответственные за подбор персонала
Размер выборки: 1000 респондентов

Подробнее

Tuesday, June 20, 2023

intergenerational mobility

Межпоколенческая мобильность по заработной плате в разных странах мира


Очень интересный, но немного сложный для понимания график: насколько сильно доходы родителей влияют на доходы детей. Рассчитанное число - это эластичность, то есть, на сколько процентов изменятся доходы детей при изменении доходов родителей на 1%. Соответственно, высокий уровень подразумевает, что у богатых родителей будут богатые дети, а у бедных - бедные, низкий - что доходы детей и родителей никак не связаны

У нас, к примеру, эта эластичность оказалась равна 0.29, а по большинству стран Европы и США - около 0.4. То есть, зависимость доходов детей от доходов родителей у нас меньше - в каком-то смысле это может говорить о большей социальной справедливости. И в целом, низкий уровень связи доходов детей и родителей наиболее характерен именно для стран пост-СССР, и, неожиданно, Канады, Австралии и Новой Зеландии

Межпоколенческая мобильность врятли возможна, как и машина времени

Saturday, June 10, 2023

Young rich patriots

Ветераны войны как источник инвестиций и растущая “кубышка”.


Молодые, богатые и патриотичные


В результате войны в Украине в России появится новая социальная группа - “молодые богатые”. Это те, кто пошел воевать в Украину, выжил и получил “значительные” выплаты от российского государства.

Об этом говорится в записке Центра макроэкономического анализа и краткосрочного прогнозирования. На него первым обратил внимание РБК, а издание The Bell (которое российские власти считают “иноагентом”) напоминает, что автор - это экономист Дмитрий Белоусов, брат первого вице-премьера Андрея Белоусова, ответственного за российскую экономику.

Экономист Белоусов считает, что эти “молодые богатые” - это важный ресурс для инвестиций. Он предлагает создать “линейку финансовых инструментов для инвестиций в перспективные/развивающиеся отрасли”.

Такие отрасли должны быть для “молодых богатых” еще и понятны - это, например, компьютерные технологии, производство беспилотников или “частный космос”. Экономист ожидает, что “молодые патриотически настроенные мужчины” будут готовы к большему финансовому риску, чем пенсионеры. Речь идет о пенсионных накоплениях, которые обычно в странах считаются источником долгосрочных инвестиций. Правда, у России с этим есть некоторые проблемы - доверие к накопительной пенсионной системе подорвано.

В беседе с РБК Белоусов развил эту идею: у них есть «мужская, где-то патриотическая история», убеждение, что «ИКТ - это хорошо, беспилотники — еще лучше».

Некоторые аналитики, опрошенные РБК, считают, правда, что “молодые патриоты”, получившие разовые выплаты от государства, не будут заниматься инвестициями, а просто “потратят на улучшение жилищных и бытовых условий”.

Но и это может быть оптимистичной оценкой. Прошедшие войну “молодые патриоты”, если они, конечно, остались живы, скорее всего, будут страдать от последствий различных травм, ПТСР и часто сопутствующего ему алкоголизма, да и других болезней - и лечение последствий войны может обойтись дорого.

Но как правильно отмечает The Bell, просто так вряд ли возможно отмести идею “патриотичных инвестиций” для людей, прошедших войну и получивших деньги, - это говорит о том, в каком направлении думают экономисты, близкие к властям.

Wednesday, May 24, 2023

bank change

Правом смены банка-эмитента зарплатной карты чаще пользуются те, кто зарабатывает больше


Правом на смену банка, в который перечисляется зарплата, уже воспользовались 22% россиян. Еще 9% опрошенных сообщили, что планируют сменить эмитента зарплатной карты в ближайшее время. В опросе сервиса по поиску высокооплачиваемой работы SuperJob приняли участие 1600 трудоустроенных представителей экономически активного населения из всех округов страны.

Закон об отмене «зарплатного рабства» был принят в 2014 году. За это время возможностью смены банка-эмитента зарплатной карты воспользовались 22% работающих. Каждый одиннадцатый планирует сделать это.

За 2 года россиян, сменивших банк, стало чуть больше (+3 процентных пункта).

Мужчин, которые перевели заработок в другой банк, немного больше, чем женщин (23 и 20% соответственно). Чаще всего же своим правом смены эмитента зарплатной карты пользуются россияне с доходом от 80 тыс. руб. в месяц (27%).

Место проведения опроса: Россия, все округа
Населенных пунктов: 347
Время проведения: 5—22 мая 2023 года
Исследуемая совокупность: экономически активное население России старше 18 лет, имеющее работу
Размер выборки: 1600 респондентов

Подробнее

Saturday, May 13, 2023

The Motherhood Penalty in Labor Force Participation

While it may seem that women's participation in the labor force has increased significantly in recent decades, that is not the case – at least not at the global level. While the labor force participation rate for women aged 25-54 did in fact climb from 67 percent in 1990 to 77 percent in 2021 in high-income countries, things are looking differently in all other income groups. According to estimates from the International Labour Organization (ILO), only 61.4 percent of women in prime working age were either employed or actively seeking employment globally in 2022, which is actually a small decline from 62.8 percent in 1990.

Moreover, there is still a significant gender gap in labor force participation rates, with women often facing challenges that their male counterparts do not. According to the ILO, the gender gap stood at 29.2 percentage points in 2022, with child-rearing seen as a major factor in lowering women’s labor force participation. As our chart shows, the labor force participation gap widens to 42.6 percentage points for couple households with at least one child under six due to the so-called "motherhood penalty." The motherhood penalty refers to the negative impact that having children can have on a woman's career.

Not only do women still shoulder the larger part of caregiving responsibilities in many families and cultures, but they also face discrimination and bias when it comes to hiring, promotions, and pay. While having to balance caregiving and professional responsibilities is hard enough, it is made even harder by such hurdles, which is why flexible work arrangements and other policies such as paid parental leave are crucial to encourage mothers to stay in or re-join the workforce after giving birth.

While the ILO notes that the motherhood penalty can be observed across all regions and income groups, there are differences in its extent. While mothers are almost 20 percent less likely to be part of the labor force than women of the same age group are overall, the penalty is significantly smaller in lower-middle-income and low-income countries at 4.3 and 5.4 percent, respectively. Interestingly, the opposite can be observed for men, who are more likely to be in the labor force when they have a child under six. This “paternity premium” contributes to an even wider labor force participation gap among parents.The Motherhood Penalty in Labor Force Participation

Thursday, May 11, 2023

kids on dacha

Самый большой отпускной бюджет — у жителей Москвы, Красноярска и Екатеринбурга


Среднестатистический отпускной бюджет за год вырос до 46 тыс. руб. на человека за неделю. Самые большие расходы на отпуск — у жителей Москвы, Красноярска и Екатеринбурга. В опросе сервиса по поиску высокооплачиваемой работы SuperJob приняли участие 13 тыс. представителей экономически активного населения из всех округов страны.

Планируя недельный отпуск, среднестатистический россиянин может позволить себе потратить 46 тыс. руб. на одного члена семьи. На идеальный отпуск такой же продолжительности респондентам требуется в среднем 157 тыс. руб. на человека. Почти каждый третий (30%) сообщил, что не может позволить себе отдых из-за отсутствия средств.

Женские запросы скромнее мужских: и для реального, и для идеального отпуска представителям сильного пола нужно больше, чем женщинам. Чем старше респонденты, тем меньше их отпускной бюджет и тем меньше им нужно для отпуска мечты. При этом отпускные запросы ожидаемо растут вместе с уровнем дохода.

По сравнению с прошлым годом, среднестатистический отпускной бюджет вырос на 9 тыс. руб., тогда как запросы к отпуску мечты, напротив, чуть снизились. Число россиян, которые не могут позволить себе отпуск, уменьшилось на 5 п.п. и вернулось к уровню 2021 года.

Больше всего могут позволить себе потратить на отпуск жители Москвы — в среднем 55 тыс. руб. на одного человека на неделю. На втором месте — Красноярск (50 тыс. руб.), на третьем — Екатеринбург (48 тыс. руб.). За год среднестатистический отпускной бюджет вырос во всех мегаполисах, кроме Нижнего Новгорода и Омска. При этом самый заметный рост предполагаемых расходов на отдых зафиксирован в Краснодаре (в среднем на 7 тыс. руб. по сравнению с прошлым годом и на 12 тыс. руб. по сравнению с 2021-м) и Казани (на 7 тыс. руб. за год и на 8 тыс. руб. за 2 года).

Что касается отпуска мечты, то самые большие запросы — у жителей Москвы и Красноярска (по 170 тыс. руб. на человека за неделю), а также Ростова-на-Дону (167 тыс. руб.). Стоимость идеального отдыха больше всего выросла в Уфе (на 10 тыс. руб. по сравнению с прошлым годом).

Место проведения опроса: Россия, все округа
Населенных пунктов: 620
Время проведения: 12 апреля — 10 мая 2023 года
Исследуемая совокупность: экономически активное население России старше 18 лет
Размер выборки: 3000 респондентов в общем опросе, 10000 респондентов в опросе населения городов-миллионников — по 1500 респондентов из Москвы и Санкт-Петербурга, по 500 респондентов из других городов-миллионников

Подробнее