Showing posts with label здоровье. Show all posts

Thursday, January 30, 2025

WHO

Кто финансирует ВОЗ


США являются (надо полагать, теперь стоит говорить "являлись") крупнейшим спонсором Всемирной Организации Здравоохранения: за период 2022-2023 гг. они внесли 15.6% от общего объёма финансирования организации - это порядка миллиарда долларов!

Второй по величине спонсор тоже очень интересный - это не страна, а всего-навсего один фонд - правда, фонд Билла и Мелинды Гейтс: 826 миллионов долларов за два года, 12.7%. Замыкает тройку лидеров Германия: 723 млн, 11.1% от общего финансирования

А ещё забавно, что небогатый и забитый санкциями Иран вносит в ВОЗ больше, чем огромные Индия и Китай или богатые Япония, Саудовская Аравия или Нидерланды

Tuesday, October 1, 2024

healthy nations

Самые здоровые (и нездоровые) страны мира


Из крупных (с точки зрения экономики и общего веса в мире) стран самое здоровье население оказалось Сингапуре! Следом (с небольшим отставанием) идёт Япония, за ней (уже с отставанием побольше) - Швейцария, Испания и Южная Корея.

Самыми нездоровыми оказались ЮАР, Индия и Индонезия.

Мы (вместе с Мексикой: у нас идеально одинаковые баллы!) оказались ровно на нуле этого рейтинга - здоровье нашего населения находится на среднемировом уровне

Tuesday, August 20, 2024

Monkeypox virus

Вирус оспы обезьян: что важно знать


По миру продолжает распространяться вирус обезьяньей оспы, унесший в этом году жизни более 500 человек в Демократической Республике Конго. На прошлой неделе штамм вируса был обнаружен в Швеции, а Всемирная организация здравоохранения объявила эпидемию оспы обезьян чрезвычайной ситуацией.

Глобальная вспышка оспы обезьян была в 2022–2023 гг., но нынешняя эпидемия вызвана гораздо более опасным штаммом.

Оспа обезьян — крайне заразное вирусное заболевание.


Изначально вирус передавался от животных к человеку, но теперь он передается и от человека к человеку через непосредственный телесный контакт, например, во время секса, а также воздушно-капельным путем — если больной дышит в лицо другого человека или разговаривает близко к нему.

Общая длительность заболевания — от 14 до 21 дня, оно может пройти само по себе.

Но в некоторых случаях заражение приводит к летальному исходу, особенно среди уязвимых групп населения, включая маленьких детей.

Monday, August 19, 2024

Measuring populaton health in Moldova

Measuring populaton health in Moldova: health expectancies


 Cristna Avram,  Olga Gagauz Charles University, Faculty of Science, Department of Demography and Geodemography, Center for Demographic Research, Natonal Insttute for Economic Research, Academy of Sciences of Moldova

Health measures are decisive for the development and implementaton of populaton health policies. Monitoring health indicators can lead to improvements in health and decrease in the inequalites among subpopulatons. The life expectancy at birth for the Moldovan populaton did not increase considerably during the last decades, due to the social and economic crisis which led to high mortality and poor health. In Moldova, no aggregated health indicators are utlized for health monitoring. Therefore, the authors calculated health indicators to assess the populaton health and argue their importance. Mortality and subjectve data on self-per- ceived health and self-rated morbidity from the Household Budget Survey was used for constructng period morbidity-mortality tables. Thus, the authors applied Sullivan’s method to calculate the life expectancy in very good/good/fair health and the life expec- tancy without chronic morbidity for the period 2006–2015. The life expectancies in very good/good/fair health showed a compres- sion of morbidity in the older ages for both sexes, and for rural and urban types of residence. The life expectancies without chronic morbidity for males and for urban dwellers demonstrated an expansion of morbidity. Although the life expectancy is slowly increas- ing, the trends in populaton health are contradictory, depending on the applied measures. The health expectancy indicators, based on self-perceived health, depict the actual situaton in the populaton health. These indicators are becoming more essental with the ageing process and can be used for the tailoring of social and health policies and services to the real needs of the populaton.

Tuesday, March 26, 2024

mutilation

Парламент Гамбии проголосовал за отмену запрета на проведение калечащих операций на женских половых органах — «женского обрезания». 


Пока законопроект прошел только два чтения, за отмену запрета высказались 42 из 47 членов Национальной ассамблеи Гамбии.

Как отмечает The Standard, на заседании присутствовали только законодатели-мужчины. Некоторые из них объясняли, что наказание за калечащие операции «лишает население права на свободное вероисповедание». Противники инициативы отмечали, что ислам — именно его исповедует большая часть жителей страны — не разрешает причинять вред женщинам.

В случае, если закон все же будет принят, Гамбия станет первой страной в мире, отменившей меры по защите женщин от калечащих операций на гениталиях.

Sunday, March 24, 2024

Self-rated health trends by gender and race in the USA, 1972-2018

March 11, 2024  Jason L. Cummings

Are Americans feeling better or worse since the 1970s and does this pattern vary by gender and race? Jason L. Cummings explores U.S. trends in self-rated health inequalities over the last five decades (1972-2018).


While survival, or differential survival, is a traditional topic of interest in socio-demographic studies, the issue of life quality, and differential life quality, has gained momentum in recent years. Self-rated health (SRH) refers to an individual’s subjective assessment, experience, or perception of their own health status. An excellent proxy of overall health, morbidity (sickness) and mortality later in life, SRH represents a valuable tool in public health monitoring and demographic research.
 

Quantifying well-being: metrics, meaning, and the human experience


In the United States, African Americans generally report poorer health than their White American counterparts, with some reductions in the racial gap from the 1970s to the early 2000s (Cummings & Jackson, 2008; Hughes & Thomas, 1998; Yang & Lee, 2009). On the other hand, studies on the gender gap in health status reveal that women have made significant strides in well-being since the 1970s, with SRH disparities narrowing and reaching parity by the early 2000s (Cummings & Jackson, 2008; Schnittker, 2007). While these studies have advanced our knowledge regarding U.S. patterns and trends in SRH over time, they are in part limited, because they:
1) only examine SRH trends prior to the 2007-2009 U.S. Great recession, or
2) pay little attention to how racial disparities in health vary by gender (Bowleg 2012)

These limitations are important because in the years since the recession, well-being patterns in the United States have worsened, with general declines across a range of social indicators of quality of life (e.g., happiness, levels of worry, stress, and pain; Cummings 2020; Deaton 2012) coupled with well-publicized increases in so called “Deaths of Despair” or preventable health conditions linked to despair and hopelessness, such as suicide, and opioid-alcohol related-mortality, affecting the U.S. White population in particular (Case and Deaton 2020).

The racial and gender dynamics of how Americans assess their own health


In a recent paper (Cummings 2023), leveraging data from the General Social Survey (GSS) between 1972 to 2018, I examined trends in SRH at the intersection of race and gender. Two key questions guided my study:
1) What is the pattern of racial and gender disparities in SRH from 1972–2018?
2) Did racial and gender disparities in SRH from 1972–2018 decrease, increase, or remain unchanged?

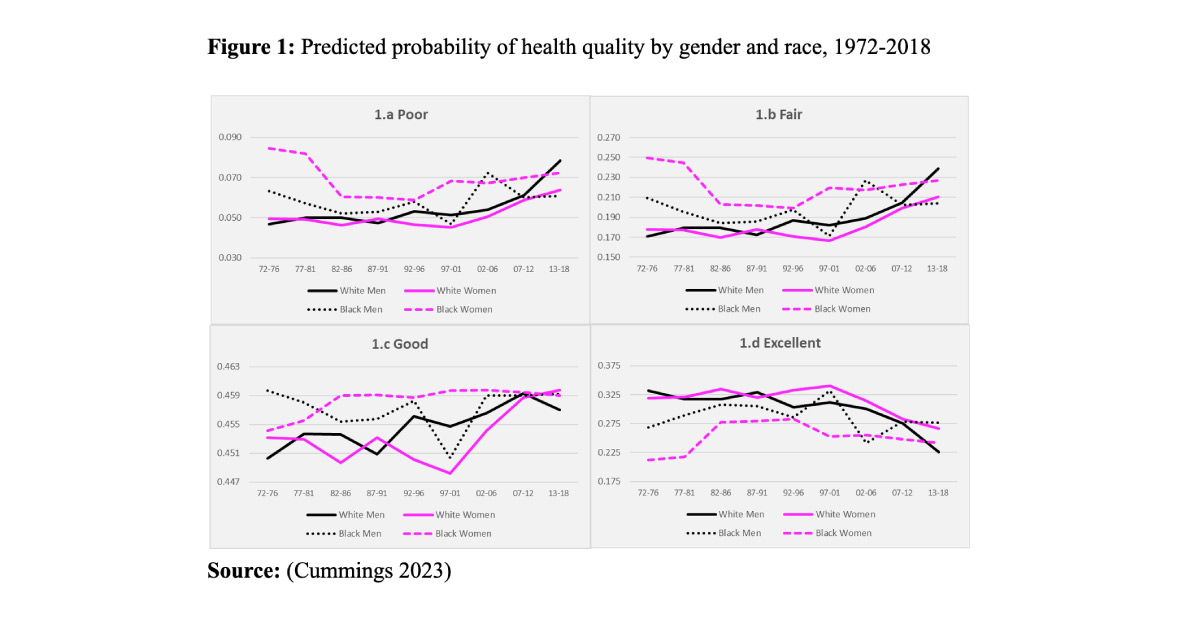
Results show that while African American women and men express feeling healthier today than they did in the 1970s, and White women report feeling about as healthy as back then, White men report feeling comparatively worse. The pattern of decline in SRH experienced by White men was most pronounced after the recession (continuing through the economic recovery).

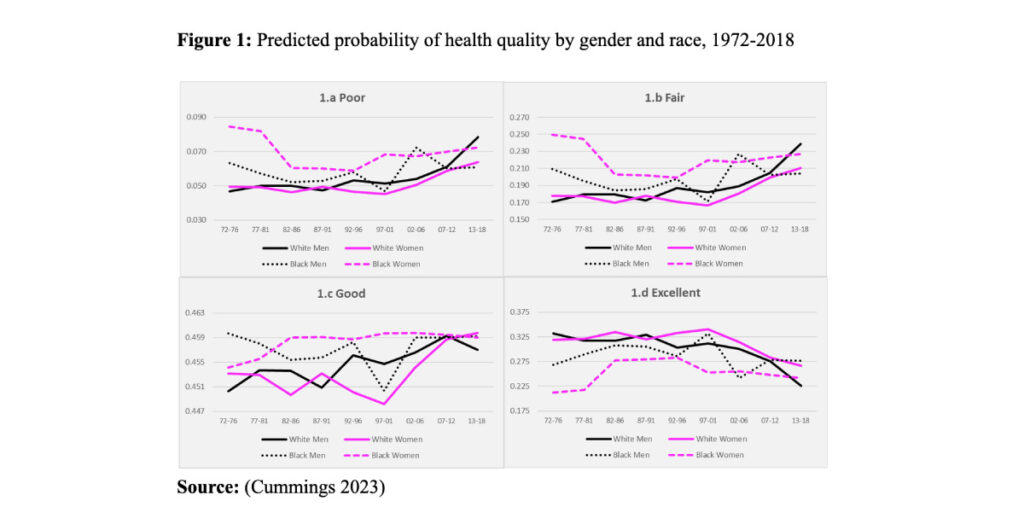
Figure 1 reports predicted probabilities across each outcome category (i.e., poor, fair, good, excellent) based on regression models adjusting for group differences across a range of sociodemographic factors (e.g., age, region, marital status, employment, education, household income, and occupational prestige). The lines illustrate a trend of virtual convergence in SRH disparities from the early 1970s to the late 2010s across demographic groups, with only one exception—“good health”—which remained largely unchanged over time and across groups. The most notable change in health status over time occurs at the upper bound of SRH (“excellent health”, panel d). For example, the likelihood of reporting “excellent health” declined significantly for White men and women from the early 2000s (–30% and –16%, respectively). In contrast, African American men and women showed a general pattern of improvement, with increases of 4% and 14%, respectively, in the likelihood of reporting “excellent” SRH.
Socioeconomic attainment (e.g., having a high income or education) and work (e.g., being employed or having a job with high occupational prestige) were primary factors that protected or improved the health status of all groups, but the strength of the positive impact of these  factors on good or excellent health differed depending on gender and race (Cummings 2023). For example, the benefit of being a high-income earner, having a college degree or being employed full-time appeared to be more protective to the health status of White women and men, while for African American women and men, having a job with a high occupational prestige wa s more protective.

Conclusions


The findings of this paper coincide with an interdisciplinary body of research demonstrating declines in the quality of life of White Americans since the recession. This finding appears to exist across objective indicators of well-being like mortality and life expectancy (Case & Deaton, 2015). Similarly, I find that SRH disparities have followed a pattern of convergence, with African American women and men witnessing gains in their SRH status since the 1970s. In contrast, White women overall have experienced little to no change in their health status and White men have experienced absolute declines. Perhaps even more surprisingly, however, the unparalleled pattern of decline in SRH experienced by White men was most pronounced after the recession (continuing through the economic recovery). This finding may suggest that the health status of White men was not simply shaped by economic forces brought on by the recession in real time, but possibly by other forces most likely preceding the 2016 U.S. presidential election, i.e., the election of the first African American U.S. President. This explanation aligns with the work of Malat, Timberlake, and Williams (2011), demonstrating immediate improvement in self-rated health among Blacks preceding the election of President Obama, but no such change or improvement in the health status of Whites.

This work also coincides with my own previous work (see Cummings, 2020) which also found an unprecedented pattern of decline in happiness among the White male population after the Great Recession, which parallels their greater relative decline in financial happiness. Although White Americans did not suffer greater financial or job loss during the Great Recession than their African American peers (the opposite is the case), White Americans (but especially White men) may have “perceived” that their financial loss was greater, and perhaps that they were primary victims of the economic downturn, in part leading to declines in their well-being.
 

References

  • Beck, A. N., Finch, B. K., Lin, S.-F., Hummer, R. A., & Masters, R. K. (2014). Racial disparities in self-rated health: Trends, explanatory factors, and the changing role of socio-demographics. Social Science & Medicine, 104, 163–177.
  • Bowleg, L. (2012). The problem with the phrase women and minorities: Intersectionality—An important theoretical framework for public health. American Journal of Public Health, 102(7), 1267–1273.
  • Case, A., & Deaton, A. (2015). Rising morbidity and mortality in midlife among white non-Hispanic Americans in the 21st century. Proceedings of the National Academy of Sciences, 112(49), 15078–15083
  • Cummings, J. L. (2020). Assessing U.S. racial and gender differences in happiness, 1972–2016: An intersectional approach. Journal of Happiness Studies, 21(2), 709–732.
  • Cummings, J. L. (2023). Entangled Inequalities: U.S. Trends in Self-Rated Health at the Intersection of Gender and Race, 1972–2018. Social Indicators Research, 169, 759–774 (2023)
  • Deaton, A. (2012). The financial crisis and the well-being of Americans 2011 OEP Hicks Lecture. Oxford Economic Papers, 64, 1–26.
  • Hughes, M., & Thomas, M. E. (1998). The continuing significance of race revisited: A study of race, class, and quality of life in America 1972–1996. American Sociological Review, 63, 785–795.
  • Malat, J., Timberlake, J., & Williams, D.R. (2011). The Effects of Obama’s Political Success on Self-Rated Health of Blacks, Hispanics, and Whites. Ethnicity & Disease. 21 (3): 349-355.
  • Schnittker, J. (2007). “Working more and feeling better: women’s health, employment, and family life, 1974-2004.” American Sociological Review 72 (2): 221-238.
  • Yang, Y., & Lee, L. C. (2009). Sex and race disparities in health: Cohort variations in life course patterns. Social Forces., 87(4), 2093–2124.

Friday, March 15, 2024

system decision


Здравствуйте!

Открыт набор в группу обучения по курсу "Организация здравоохранения и общественное здоровье".

Длительность обучения: 506 часов (3 месяца)

Форма обучения: заочная с использованием дистанционных образовательных технологий (Дистанционная)

Ближайшая группа: c 28 марта 2024 г.

Получаемый документ: Диплом о профессиональной переподготовке

Длительность обучения: 144 часа (1 месяц)

Форма обучения: заочная с использованием дистанционных образовательных технологий (Дистанционная)

Ближайшая группа: c 29 марта 2024 г.

Получаемый документ: Удостоверение о повышении квалификации

Приобретаемые знания и навыки:
  • Особенности менеджмента в здравоохранении. Основы управления здравоохранением. Принципы и виды управления. Процесс управления здравоохранением. Компоненты, функции, методы и стили управления.
  • Организация контроля в управлении здравоохранением. Система стандартизации в здравоохранении.
  • Основные теории мотивации в системе управления здравоохранением. Технология принятия управленческого решения. Стратегическое управление в здравоохранении.
  • Основы взаимосвязи экономики и здравоохранения. Введение в экономику здравоохранения. Рыночные отношения в здравоохранении. Финансирование здравоохранения РФ.
  • Современная концепция маркетинга. Организация и управление маркетингом. Маркетинговые коммуникации. Маркетинг в медицинских учреждениях. Маркетинговые технологии в сбытовой политике организации.
  • Современное состояние общественного здоровья, основные показатели. Социально-гигиенические методики сбора и анализа информации о показателях здоровья. Концепция факторов риска и ее практическое значение для здравоохранения. Основы доказательной медицины и клинической эпидемиологии.
  • Наглядные методы представления статистических данных. Организация выполнения статистического исследования.
  • Основные принципы охраны здоровья и организации здравоохранения. Система финансирования здравоохранения Российской Федерации. Система органов управления здравоохранением в Российской Федерации. Основные принципы управления в сфере охраны здоровья, медицинских организациях и их структурных подразделениях. Конфликты в медицинской организации.
  • Качество медицинской помощи и направления его оценки. Внутренний контроль качества и безопасности медицинской деятельности. Экспертиза качества медицинской помощи в системе обязательного медицинского страхования.
Вас также могут заинтересовать программы тематического усовершенствования с выдачей 36 баллов НМО:

1. Эффективное управление медицинской организацией в современных экономических условиях.
2. Экспертиза качества медицинской помощи.
3. Организация клинико-экспертной работы в медицинской организации.
4. Организация здравоохранения и общественное здоровье.
5. Внутренний контроль качества и безопасности медицинской деятельности в медицинской организации.
6. Избранные вопросы социальной гигиены и организации здравоохранения.
7. Алгоритмы решения задач по управлению персоналом медицинской клиники.
8. Порядок проведения экспертизы временной нетрудоспособности.
9. Организация оказания медицинской помощи пациентам с новой коронавирусной инфекцией COVID-19 в амбулаторных условиях.
10. Порядок оказания медицинской помощи пострадавшим с сочетанными, множественными и изолированными травмами, сопровождающимися шоком.

Наличие мест в группах ограничено. Для получения более подробной информации и зачисления оставьте заявку на нашем сайте или напишите по адресу info@sr-edu.ru.

Thursday, February 1, 2024

Frailty at death:

A four-country study

January 29, 2024
by Sergi Trias-Llimós, Magali Barbieri, Viviana Egidi, Luisa Frova, Francesco Grippo, France Meslé, Marilena Pappagallo and Aline Désesquelles

Frailty represents a major public health challenge in ageing populations. In this study, Sergi Trias-Llimós, Magali Barbieri, Viviana Egidi, Luisa Frova, Francesco Grippo, France Meslé, Marilena Pappagallo, and Aline Désesquelles focus on frailty at death in people aged 50 years and above in France, Italy, Spain and the US.


The continuous decline in mortality among the elderly, except during the COVID-19 period, has contributed to increased population heterogeneity with respect to frailty, “a state of increased vulnerability to poor resolution of homeostasis after a stressor event, which increases the risk of adverse outcomes” (Clegg et al., 2013). In ageing populations, frailty represents a major public health challenge because of both its increasing prevalence over time and its association with mortality risks.

Understanding the role of frailty, in part(s)


In a recent study, we examined the distribution of frailty-related causes mentioned on death certificates in France, Italy, Spain and the United States in 2017 (Trias-Llimós et al., 2023). Death certificates, usually completed by physicians, provide information on the morbid process, including the sequence of diseases and conditions leading to death (in Part I of the certificate) and the contribution of other causes, not directly involved (in Part II). Most studies of mortality by cause rely on the underlying cause of death, which is the disease or injury that initiated the train of events leading to death. Whereas this information is undoubtedly of value, it limits the understanding of mortality processes and the role played by the diseases (conditions, or risk factors) that are rarely designated as the initial cause.

We defined a list of frailty-related causes of death by adapting the list in Soong et al. (2015), including dementia, incontinence, functional dependence and mobility problems, decubitus ulcer and pressure area, and senility. We excluded falls and fractures, which are causes or consequences of frailty rather than frailty per se, and anxiety and depression; and we added malaise, fatigue and malnutrition, types of vulnerabilities that are rarely listed as underlying causes of death (Grippo et al. 2020). If mentioned in Part I, they likely correspond to end-of-life symptoms and do not necessarily reflect pre-existing frailty in the deceased. If mentioned in Part II, they indicate vulnerability and are more likely to reflect pre-existing conditions which could have increased the risk of dying from the underlying cause.

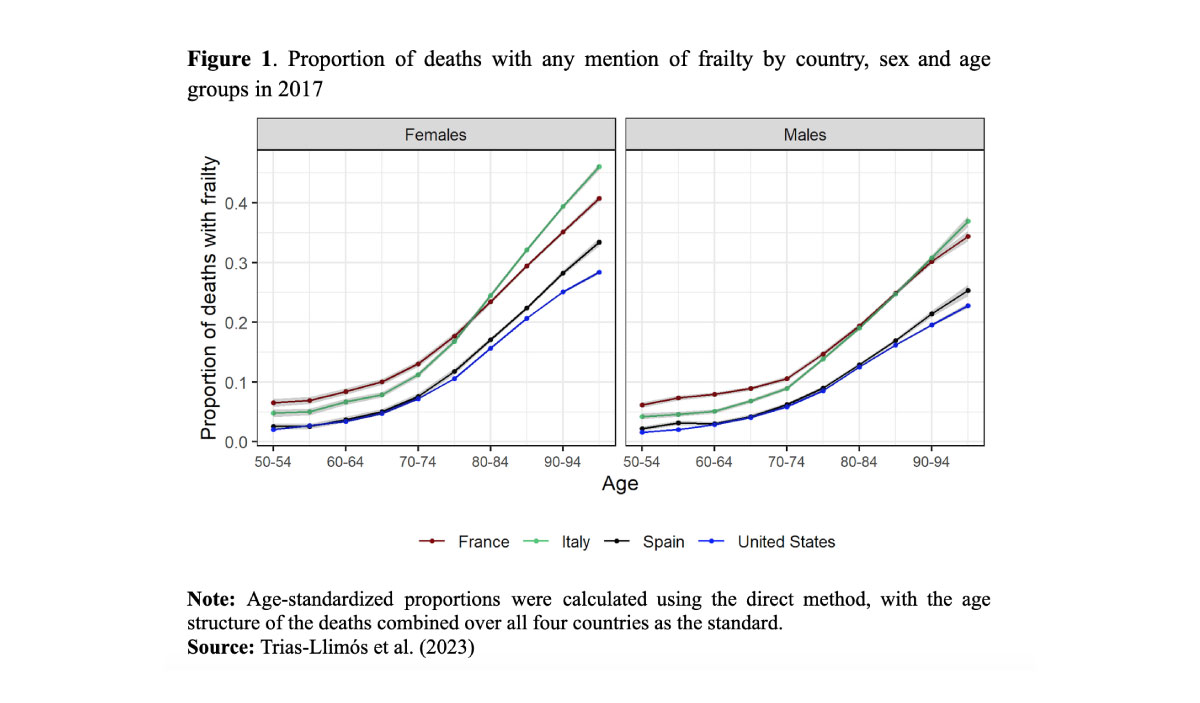
Overall, the age-standardized proportion of deaths with frailty at 50 years and over was highest in Italy (24.4%), followed by France (22.7%) and Spain (16.6%), and lowest in the US (14.9%). The proportion of death certificates with a mention of frailty increases with age for both sexes across the four countries (Figure 1). It is highest in France and lowest in Spain and the US at younger ages, and highest in Italy at older ages. The share of deaths with a mention of frailty is higher for women than for men across all countries and age groups, with a mean female to male ratio of 1.21.
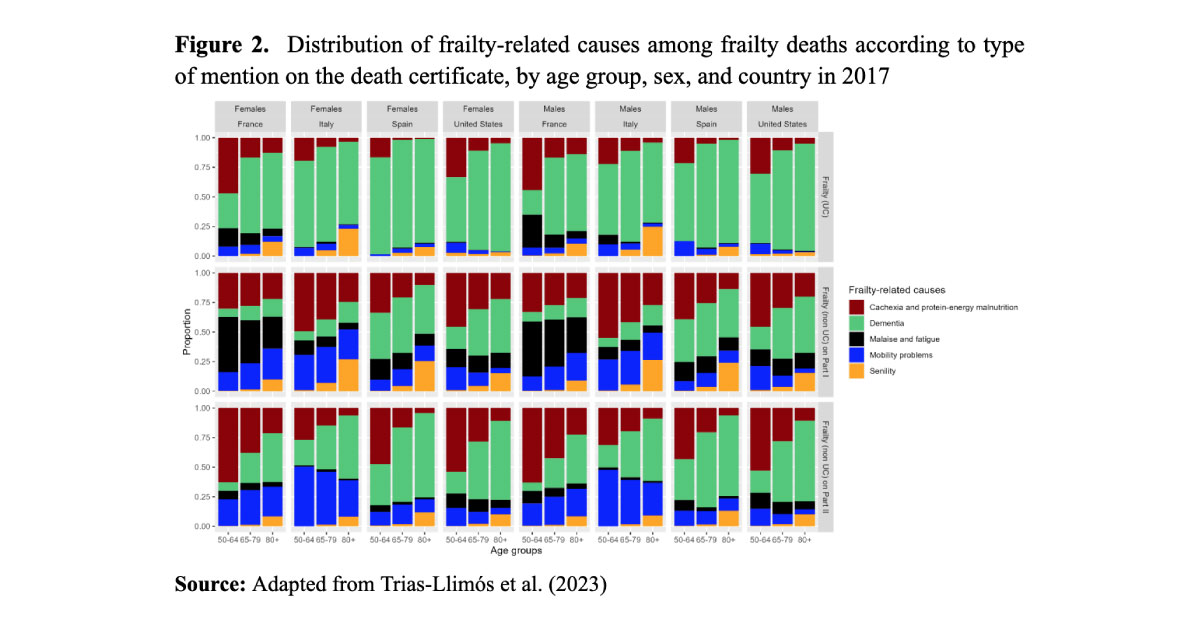
In all four countries, frailty mentions are most frequent in Part I, although not as the underlying causes of death, for which large cross-country differences are observed, with high proportions in Italy and France, and low proportions in the US and Spain. Conversely, when a frailty-related condition is mentioned as either the underlying cause of death or in Part II, cross-country differences become small.

Where frailty is mentioned


Figure 2 shows the distribution of frailty mentions according to their position on the death certificate (as the underlying cause, elsewhere in Part I, or in Part II) by country, age, and sex. Dementia is the most common frailty-related cause mentioned as the underlying cause in all countries and for both sexes, with the exception of the 50-64 year age group in France, for whom cachexia and protein-energy malnutrition are more prevalent. The cause-of-death distribution is substantially different if we look at frailty listed in Part I but not as the underlying cause. Dementia remains the most prevalent cause in Spain and the US, but cachexia and protein-energy malnutrition represent an important share (at least 25% of the deaths with frailty mentioned in Part I at ages 50-64 years). Malaise and fatigue are also reported in at least 25% of certificates in France, while the prevalence of mobility problems and senility increases with age (e.g., 50% of deaths at ages 80 years and over in Italy).
Finally, when frailty is mentioned in Part II, dementia is again the most commonly reported condition, followed by cachexia and protein-energy malnutrition and senility. Strong age patterns are found: while the share of dementia mentions increases with age, the share of mentions of cachexia and protein-energy malnutrition declines.

Conclusions


Our study provides a basis for further monitoring of frailty in low-mortality countries using a widely available and highly comparable source of information. Frailty might be underreported by certifying physicians, either because they consider almost everyone to be frail at the end of life, especially at more advanced ages, or because frailty syndromes are not considered as valid causes of death, so our estimates are likely to be conservative. However, the consistency of our results by sex and over the age curve appears to reflect plausible patterns indicating real differences in the prevalence of frailty at the end of life.
 

References

  • Clegg, A., Young, J., Iliffe, S., Rikkert, M. O., & Rockwood, K. (2013). Frailty in elderly people. The Lancet, 381(9868), 752–762.
  • Fried, L. P., Tangen, C. M., Walston, J., Newman, A. B., Hirsch, C., Gottdiener, J., Seeman, T., Tracy, R., Kop, W. J., & Burke, G. (2001). Frailty in older adults: Evidence for a phenotype. The Journals of Gerontology Series A: Biological Sciences and Medical Sciences, 56(3), M146–M157.
  • Grippo, F., Désesquelles, A., Pappagallo, M., Frova, L., Egidi, V., & Meslé, F. (2020). Multi-morbidity and frailty at death: A new classification of death records for an ageing world. Population Studies, 74(3), 437–449.
  • Soong, J., Poots, A. J., Scott, S., Donald, K., Woodcock, T., Lovett, D., & Bell, D. (2015). Quantifying the prevalence of frailty in English hospitals. BMJ Open, 5(10), e008456. https://doi.org/10.1136/bmjopen-2015-008456
  • Trias-Llimós, S., Barbieri, M., Egidi, V., Frova, L., Grippo, F., Meslé, F., Pappagallo, M., & Désesquelles, A. (2023). Frailty at death: An examination of multiple causes of death in four low mortality countries in 2017. Demographic Research, 49(2), 13–30.

Friday, December 15, 2023

Extreme morning sickness?

Scientists finally pinpoint a possible cause

A protein released by fetal cells in the placenta influences the risk of experiencing severe nausea and vomiting during pregnancy.

Sickness during pregnancy can be so severe that it disrupts eating, drinking and everyday activities.

Researchers have pinpointed a hormone released by growing fetuses that might cause a debilitating form of morning sickness. Women who are more sensitive to the hormone, which increases during early pregnancy, might be at greater risk of experiencing a severe form of nausea and vomiting, called hyperemesis gravidarum, according to their study.

“For the first time, hyperemesis gravidarum could be addressed at the root cause, rather than merely alleviating its symptoms,” says Tito Borner, a physiologist at the University of Pennsylvania. The work was published on 13 December in Nature1.

The finding could also open avenues for treatment. “We now have a clear view of what may cause this problem and a route for both treatment and prevention,” says study co-author Stephen O’Rahilly, a metabolism researcher at the University of Cambridge, UK.

The researchers found that women who had high levels of the hormone GDF15 before they got pregnant had minimal reactions to it while carrying their baby. The findings suggest that giving GDF15 to those at high risk of hyperemesis gravidarum before pregnancy could protect them from the condition. O’Rahilly says that although their study suggests that GDF15 influences the risk of severe sickness, other factors might have a role.

Roughly 70% of women experience nausea and vomiting during pregnancy — colloquially termed morning sickness, even though it can occur at any time. Around 0.3–2% experience hyperemesis gravidarum: symptoms so severe that they have difficulty eating, drinking and doing everyday activities. In the worst cases, this can lead to death from dehydration. “It is extremely disabling,” says O’Rahilly.

Protective mechanism


Research has shown2 that GDF15, which is produced at low levels by organs including the prostate, bladder and kidneys, can trigger nausea by binding to specialized receptors in the brainstem. After ingesting toxic substances and during early pregnancy, levels of this hormone increase, causing sickness. “It’s usually worst in the first trimester and then it gradually fades,” says O’Rahilly.

On the basis of such studies, O’Rahilly proposed3 that GDF15 might have evolved to protect people from poisoning themselves and to shield a developing fetus from toxic substances. It’s not necessary to eat a lot and gain much mass in early pregnancy, says O’Rahilly. “It’s far better off being cautious about what you eat, to protect your offspring from toxins.”

In 2018, researchers linked some variants of the GDF15 gene, which encodes GDF15, to an increased risk of developing hyperemesis gravidarum4.

In the latest study, O’Rahilly and his colleagues found that GDF15 levels in the blood were substantially higher in nearly 60 pregnant women who experienced nausea and vomiting than in around 60 who had little or no sickness.

The researchers compared the levels of different variants of GDF15 produced by placental cells derived from the mothers and fetuses, and found that fetal cells produced most of the hormone.

Genetic risk


The team found that people with certain genetic variants of GDF15, which have previously been linked to a higher risk of developing hyperemesis gravidarum, had lower GDF15 levels in the body. By analysing genetic data from more than 18,000 people, the researchers found that higher levels of GDF15 in non-pregnant people reduced the risk that they would develop hyperemesis gravidarum if they did become pregnant. This suggests that people react less to the hormone during pregnancy if they have higher GDF15 levels beforehand, says O’Rahilly.

To test this idea, researchers injected mice that weren’t pregnant with either a long-lasting form of GDF15 or a placebo. Three days later, the team gave all the mice a dose of GDF15, and found that animals that had received the placebo ate less and lost weight, but those exposed to GDF15 ate normally and lost less weight.

The team also asked mothers with the chronic blood condition β-thalassaemia — who have lifelong elevated levels of GDF15 — whether they experienced sickness during pregnancy. Only 5% had, whereas more than 60% of those in a sample of the general population, matched for ethnicity and age, experienced these symptoms.

Stopping the sickness


The results suggest that people who have generally low levels of GDF15 could be given increasingly high doses of the hormone while trying to conceive, to desensitize them to it and reduce their chances of experiencing hyperemesis gravidarum during pregnancy, says O’Rahilly.

Alternatively, they could be given antibodies that block GDF15 or GDF15 receptors, to reduce nausea and vomiting. At least two antibodies against GDF15 are being tested in clinical trials to treat the wasting syndrome cachexia.

Further research is needed to explore these possibilities. “We don’t know anything about the role of GDF15 in normal pregnancy,” says obstetric clinician and researcher Catherine Williamson at Imperial College London. Studies should establish whether changing the hormone’s activity might have harmful side effects, she says.

Borner agrees. Attempts to tackle pregnancy sickness have a troubled past: in the 1950s and 1960s, the drug thalidomide was used to treat the condition, but turned out to affect the development of babies’ limbs.

“If fetally derived GDF15 is a primary driver of nausea and vomiting during pregnancy, then that’s a big deal,” says nutritional researcher Bart De Jonghe at the University of Pennsylvania in Philadelphia. “It shows us a powerful way the fetal environment can use a single chemical signal to dramatically impact maternal health and behaviour.”

doi: https://doi.org/10.1038/d41586-023-03982-8
там всё: ссылки и проч.

Monday, December 11, 2023

Sociodemographic disparities in co-impairment in the older U.S. population

December 11, 2023 Shubhankar Sharma, Jo Mhairi Hale, Mikko Myrskylä and Hill Kulu

The under-investigated issue of co-impairment (cognitive impairment and limitations in basic activities of daily living) is more prevalent than commonly believed. Shubhankar Sharma, Jo Mhairi Hale, Mikko Myrskylä and Hill Kulu describe the case of the U.S. and underline the profound health inequalities across some of its population subgroups.


The U.S. is experiencing considerable population aging. While older adults constituted 17% of the total U.S. population in 2020, the share is predicted to reach 22% by 2040 (Vespa et al. 2018). Population aging poses serious challenges as health declines with increasing age, sometimes to the point where independent living becomes impossible.

Co-impairment


Extensive research has been conducted to understand co-impairment, the joint burden of cognitive impairment and limitations in basic activities of daily living such as walking, dressing, and eating. Co-impairment is considerably more detrimental to the affected individuals as well as to the caregivers’ health and well-being than either burden experienced separately (Riffin et al. 2017; Yu et al. 2017). However, no study has investigated the risk of experiencing co-impairment in one’s lifetime: at what age and for how long co-impairment is experienced (expectancy).

Over one million older adults experience co-impairment in the U.S. (Riffin et al. 2017) and, with rapid population aging, this number is likely to increase. In recent research (Sharma et al. 2023), we examined the burden of co-impairment among older individuals in the U.S. using data from the Health and Retirement Study, 1998-2016, and multistate models. In addition to estimating the widely used metric of expectancy, we also estimated the lifetime risk and mean age at onset of co-impairment by gender, race/ethnicity/nativity, and educational level, as health disparities are high in the U.S. (Hayward et al. 2014).

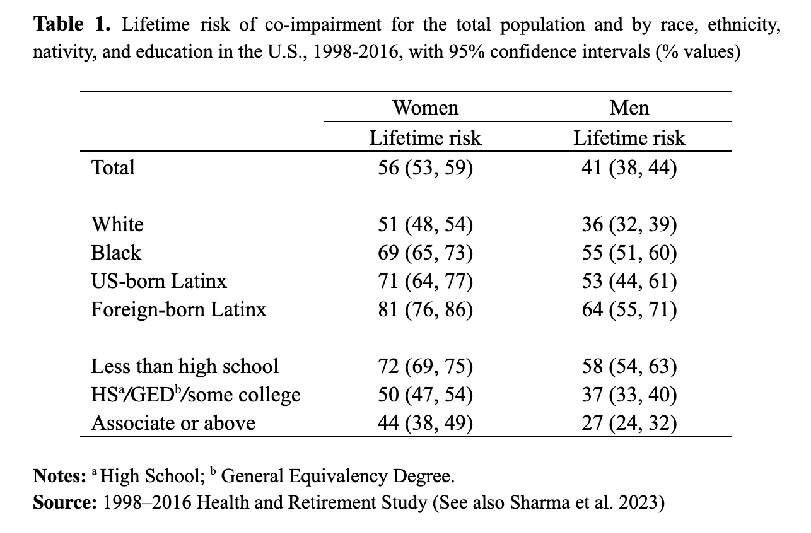
Table 1 presents the main results. Overall, 41% of men and 56% of women aged 50 are expected to experience co-impairment in their remaining life expectancy. Blacks, foreign- and U.S.-born people of Latin American origin or descent (Latinx), and the lowest educated experience substantially greater lifetime risk of co-impairment than Whites and the highest educated, regardless of gender.

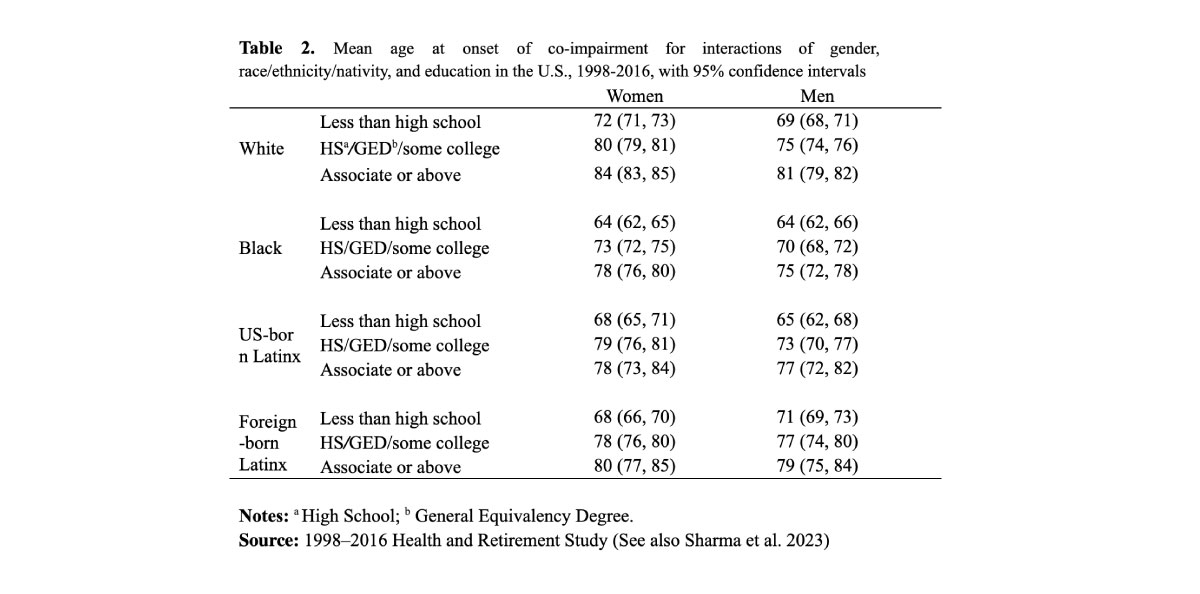
Table 2 presents the average age at onset of co-impairment for racial/ethnic/nativity subpopulations by educational attainment. Black women and men pay the highest penalty for having the lowest level of education. They have the youngest co-impairment onset (at age 64 years), resulting in dramatic disparities of about two decades compared with the highest educated Whites.


Table 3 shows the co-impairment expectancies for all the racial/ethnic/nativity subgroups by educational attainment. In each racial/ethnic subpopulation, those with the lowest education have the longest co-impairment expectancy. In particular, the lowest educated foreign-born Latinx live the longest in co-impairment (men: 5.0 years, women: 9.7 years).

Educational intervention: a potential way to narrow the disparities


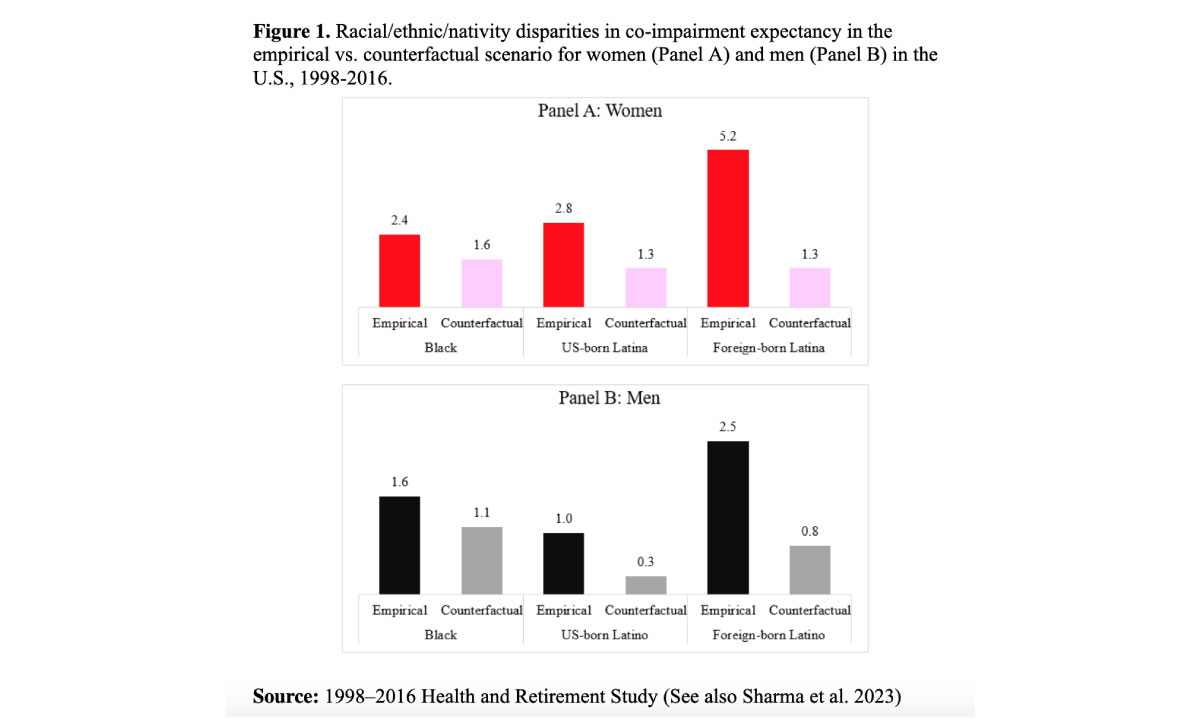
Figure 1 shows the racial/ethnic/nativity disparities in co-impairment expectancy (e.g., between Blacks and Whites) in the counterfactual and empirical scenarios. In the counterfactual scenario, educational inequalities across race/ethnicity/nativity are eliminated. We assign the educational distribution of Whites to Blacks and Latinx and recalculate their expectancies, with differences from the Whites that, not surprisingly, shrink.

The U.S. has a long road ahead to attain health equity


Being co-impaired poses serious disadvantages for the affected individuals, family members, caregivers, and society. Our study provides novel insights into its burden and offers evidence of dramatic disparities in the older U.S. population. We find that older women, Blacks, U.S.- and foreign-born Latinx, and less than high school educated adults experience a considerably greater burden of co-impairment. For instance, we find a difference of almost nine years in co-impairment expectancy between the highest educated White men and lowest educated foreign-born Latinas aged 50.

These findings may help health planners to identify the vulnerable subgroups of caregivers who may need additional resources or support. Particularly, Blacks and Latinx rely more heavily on family members for care and support than Whites (Rote and Moon 2018). Since Blacks, Latinx, and the lowest educated have an earlier onset of co-impairment and live considerably longer in co-impairment than others, their caregivers are subject to greater strain and are themselves at greater risk of poor health in the future.

Maintaining the health and well-being of the growing older population has become a public health priority in the U.S., a serious challenge for health planners and policymakers, also considering that the shares of the most vulnerable groups, Latinx and Blacks, are increasing (Vespa et al. 2018). The considerable disparities across subpopulations in co-impairment indicate that the U.S. has a long road ahead to attain health equity. Nevertheless, at least 31% of the racial/ethnic/nativity disparities in co-impairment expectancy are attributable to educational inequalities. This promising finding emphasizes the importance of an educational intervention in narrowing the future racial/ethnic/nativity disparities in health.

References

  • Hayward, M. D., Hummer, R. A., Chiu, C. T., González-González, C., & Wong, R. (2014). Does the Hispanic Paradox in U.S. Adult Mortality Extend to Disability?. Population Research and Policy Review, 33(1), 81–96. https://doi.org/10.1007/s11113-013-9312-7
  • Riffin, C., Van Ness, P. H., Wolff, J. L., & Fried, T. (2017). Family and Other Unpaid Caregivers and Older Adults with and without Dementia and Disability. Journal of the American Geriatrics Society, 65(8), 1821–1828. https://doi.org/10.1111/jgs.14910
  • Rote, S. M., & Moon, H. (2018). Racial/Ethnic Differences in Caregiving Frequency: Does Immigrant Status Matter?. The Journals of Gerontology. Series B, Psychological sciences and social sciences,73(6), 1088–1098. https://doi.org/10.1093/geronb/gbw106
  • Sharma, S., Hale, J. M., Myrskylä, M., & Kulu, H. (2023). Racial, Ethnic, Nativity, and Educational Disparities in Cognitive Impairment and Activity Limitations in the United States, 1998–2016. Demography, 60(5), 1441-1468.
  • Vespa, J., Armstrong, D. M., and Medina, L. (2018). Demographic turning points for the United States: Population projections for 2020 to 2060. Washington, DC: US Department of Commerce, Economics and Statistics Administration, US Census Bureau. Retrieved from https://www.census.gov/content/dam/Census/library/publications/2020/demo/p25-1144.pdf
  • Yu, W. C., Chou, M. Y., Peng, L. N., Lin, Y. T., Liang, C. K., & Chen, L. K. (2017). Synergistic effects of cognitive impairment on ADL disability in all-cause mortality among men aged 80 years and over: results from longitudinal older veterans study. PLoS One, 12(7), e0181741. https://doi.org/10.1371/journal.pone.0181741

Sunday, November 26, 2023

Racialization and Reproduction: Asian Immigrants and California’s Twentieth-Century Eugenic Sterilization Program

By Marie Kaniecki, Nicole L Novak, Sarah Gao, Natalie Lira, Toni Ann Treviño, Kate O’Connor, Alexandra Minna Stern

During the twentieth century, state health authorities in California recommended sterilization for over 20,000 individuals held in state institutions. Asian immigrants occupied a marginalized position in racial, gender, and class hierarchies in California at the height of its eugenic sterilization program. Scholars have documented the disproportionate sterilization of other racialized groups, but little research exists connecting the racist, gendered implementation of Asian immigration restriction to the racism and sexism inherent in eugenics. This study examines patterns of coercive sterilization in Asian immigrants in California, hypothesizing higher institutionalization and sterilization rates among Asian-born compared with other foreign- and US-born individuals. We used complete count census microdata from 1910 to 1940 and digitized sterilization recommendation forms from 1920 to 1945 to model relative institutionalization and sterilization rates of Asian-born, other foreign-born, and US-born populations, stratified by gender. Other foreign-born men and women had the highest institutionalization rates in all four census years. Sterilization rates were higher for Asian-born women compared with US-born [Incidence Rate Ratio (IRR) = 2.00 (95% CI: 1.61, 2.48)] and other foreign-born women (p < 0.001) across the entire study period. Sterilization rates for Asian-born men were not significantly higher than those of US-born men [IRR 0.95 (95% CI 0.83, 1.10). However, an inflection point model incorporating the year of sterilization found higher sterilization rates for Asian-born men than for US-born men prior to 1933 [IRR 1.31 (95% CI 1.09, 1.59)]. This original quantitative analysis contributes to the literature demonstrating the health impact of discrimination on Asian-Americans and the disproportionate sterilization of racial minorities under state eugenics programs.

Thursday, October 19, 2023

new data base

Семинар проекта "Мониторинг и прогноз ожидаемой продолжительности жизни на основе данных оперативной статистики": "Российская база данных краткосрочных колебаний смертности – новый инструмент изучения здоровья и смертности населения в России"


Международная лаборатория исследований населения и здоровья приглашает всех желающих на выступление Дмитрия Александровича Жданова и Алексея Евгеньевича Щура (МЛ НиЗ), которые представят результаты совместной работы коллектива Лаборатории и коллег-демографов из других научных институтов в рамках проекта "Мониторинг и прогноз ожидаемой продолжительности жизни на основе данных оперативной статистики": Российскую базу краткосрочных колебаний смертности (РосБКС).


Тема: 

«Российская база данных краткосрочных колебаний смертности – новый инструмент изучения здоровья и смертности населения в России»


Дата: 24 октября 2023
Время: 14:40–16:00
Формат: смешанный
Рабочий язык: русский

Место проведения: Москва, Б. Трехсвятительский пер., д.3, ауд. 438

Приглашаются все желающие!


Докладчики:

Дмитрий Александрович Жданов

главный научный сотрудник Международной лаборатории исследований населения и здоровья

Алексей Евгеньевич Щур

научный сотрудник Международной лаборатории исследований населения и здоровья

Аннотация

Российская база краткосрочных колебаний смертности (РосБКС) содержит недельные общие и стандартизованные показатели смертности в разрезе субъектов РФ и в целом в России. Данные РосБКС будут востребованы как при проведении фундаментальных исследований, так и органами исполнительной власти, в первую очередь, в области охраны здоровья населения. База данных недельных стандартизованных коэффициентов смертности в России и ее регионах содержит уникальные данные о колебаниях уровней смертности как внутри отдельных годов, начиная с 2000 года, так и между годами, что откроет новые направления исследований влияния различных социально-экономических, политических, природно-климатических и прочих факторов на кратко- и долгосрочные колебания уровней смертности.

По всем организационным вопросам просьба обращаться к Вере Соколовой по почте: vsokolova@hse.ru

Регистрация на семинар

В ходе семинара может осуществляться видео- и фотосъемка или аудиозапись, которые могут размещаться организаторами семинара в социальных сетях или на корпоративном сайте (портале) НИУ ВШЭ.

Sunday, October 15, 2023

age at retirement

тыцабельно

Пенсионный возраст в разных странах мира


Интересная инфографика, показывающая не только законодательно установленный возраст выхода на пенсию (красные кружки), но и эффективный - возраст, когда люди фактически перестают работать (синие кружки)

И местами эти два возраста очень сильно отличаются! В Саудовской Аравии, к примеру, работают в среднем до 59, хотя на пенсию можно выйти... в 47! В Индонезии разница тоже составляет 12 лет, только оба возраста - на десять лет больше (в 57 можно выйти на пенсию, в 69 в среднем выходят). Работа в возрасте, когда уже можно по закону выйти на пенсию, в целом характерна для азиатских стран и для стран с низкими доходами (многие страны Латинской Америки, Россия, Турция)

А вот в большинстве стран Европы, напротив, эффективный возраст выхода на пенсию ниже законодательно установленного! Во Франции, к примеру, перестают работать в среднем в 60, хотя пенсионный возраст начинает с 65 лет! В большинстве других стран разница составляет 3-4 года. Живут же люди!

Wednesday, October 4, 2023

Measuring population health in Moldova: health expectancies

тыцабельно
Health measures are decisive for the development and implementation of population health policies. Monitoring health indicators can lead to improvements in health and decrease in the inequalities among subpopulations. The life expectancy at birth for the Moldovan population did not increase considerably during the last decades, due to the social and economic crisis which led to high mortality and poor health. In Moldova, no aggregated health indicators are utilized for health monitoring. Therefore, the authors calculated health indicators to assess the population health and argue their importance. Mortality and subjective data on self-perxceived health and self-rated morbidity from the Household Budget Survey was used for constructing period morbidity-mortality tables. Thus, the authors applied Sullivan’s method to calculate the life expectancy in very good/good/fair health and the life expectancy without chronic morbidity for the period 2006–2015. The life expectancies in very good/good/fair health showed a compres-sion of morbidity in the older ages for both sexes, and for rural and urban types of residence. The life expectancies without chronic morbidity for males and for urban dwellers demonstrated an expansion of morbidity. Although the life expectancy is slowly increasing, the trends in population health are contradictory, depending on the applied measures. The health expectancy indicators, based on self-perceived health, depict the actual situation in the population health. These indicators are becoming more essenti al with the ageing process and can be used for the tailoring of social and health policies and services to the real needs of the population

Source

Tuesday, August 22, 2023

medicines

«Коммерсант»:

в Россию перестанут поставлять препарат от гепатита С «Зепатир»


Американская фармацевтическая компания MSD прекратит поставки в Россию препарата зепатир, который широко применяется для лечения гепатита С, пишет газета «Коммерсант».

🔻Издание ссылается на оказавшееся в распоряжении редакции письмо, в котором Минздрав России предупреждает медицинские учреждения о прекращении поставок ряда препаратов, в том числе зепатира. Также эту информацию газете подтвердили в Росздравнадзоре.

🔻В ведомстве при этом утверждают, что решение MSD не повлияет поставки лекарства, запланированные на 2024 год. Хотя, как отмечает «Коммерсант», на этот препарат приходится 20% всех госзакупок лекарств от гепатита.

🔻Минпромторг России заявил, что фармацевты разрабатывают аналоги американского лекарства. «Лекарственный препарат „Зепатир“ находится под патентом на территории РФ до марта 2030 года. По оперативной информации, несколько отечественных предприятий осуществляют разработку воспроизведенного лекарственного препарата», — цитирует сообщение министерства «Интерфакс».

🔻На прошлой неделе издание «Холод» сообщало, что государственные больницы в конце июля получили от Минздрава список из 196 наименований препаратов, которые в ближайшее время исчезнут с российского рынка. Позже российский Минздрав отозвал документ для «уточнения», однако его новая версия до сих пор не поступила в больницы.

🔻В списке препаратов, который разослал российский Минздрав, оказались широко используемые антибиотики («Сивекстро», «Инванз» и «Кубицин»), препараты для лечения онкологических заболеваний (большинство производства израильской компании Teva), стероид «Медрол», препарат от муковисцидоза «Пульмозим» и вакцина против кори М-М-Р II. Кроме того, в список попали и некоторые очень популярные среди россиян препараты — например, лекарство от кашля АЦЦ, детское жаропонижающее «Панадол», обезболивающее «Но-шпа», ингалятор для астматиков «Сальбутамол» и пастилки от боли в горле «Лазолван».

🔻Многие из препаратов, которые перечислило министерство, уже давно потеряли регистрационное удостоверение и ушли с рынка.

Saturday, August 19, 2023

dementia

Томас Харрисон, Брент Форестер. Деменция. Как жить, если близкий человек болен. Полное руководство по общению, помощи и уходу. - М.: Альпина Паблишер, 2023. - 262 с.


Аннотация: Заботиться о человеке, страдающем деменцией, очень непросто. Из-за постоянной тревоги и стресса рутинный уход за ним становится тяжелым бременем для семьи и близких. Как помочь человеку, который не понимает, что происходит, чувствует себя растерянным и сопротивляется вашей помощи? Брент Форестер и Томас Харрисон написали книгу для тех, кто хочет улучшить жизнь близкого человека и не разрушить собственную.

Friday, July 7, 2023

Geriatric Syndromes

Clinical, Research, and Policy Implications of a Core Geriatric Concept

Sharon K. Inouye, MD, MPH, Stephanie Studenski, MD, Mary E. Tinetti, MD, and George A. Kuchel, MD

Geriatricians have embraced the term ‘‘geriatric syndrome,’’ using it extensively to highlight the unique features of common health conditions in older people. Geriatric syndromes, such as delirium, falls, incontinence, and frailty, are highly prevalent, multifactorial, and associated with substantial morbidity and poor outcomes. Nevertheless, this central geriatric concept has remained poorly defined. This article reviews the criteria for defining geriatric syndromes and proposes a balanced approach to developing preliminary criteria based on peer-reviewed evidence. Based on are view of the literature, four shared risk factors: older age, baseline cognitive impairment, baseline functional impairment, and impaired mobility were identified across five common geriatric syndromes (pressure ulcers, incontinence, falls, functional\decline, and delirium). Understanding basic mechanisms involved in geriatric syndromes will be critical to advancing research and developing targeted therapeutic options, although given the complexity of these multifactorial conditions, attempts to define relevant mechanisms will need to incorporate more-complex models, including a focus on synergistic interactions between different risk factors. Finally, major barriers have been identified in translating research advances, such as preventive strategies of proven effectiveness for delirium and fall, into clinical practice and policy initiatives. National strategic initiatives are required to overcome barriers and to achieve clinical, research, and policy advances that will improve the quality of life for older persons.
J Am Geriatr Soc 55:780–791, 2007

Thursday, June 29, 2023

real population policy

How much does a dramatic increase in technology improve healthcare quality in an upper middle-income country? Using rich vital statistics on infant health outcomes, this study evaluates the effect of introducing technologically advanced perinatal hospitals in 24 regions of Russia on infant mortality during the period 2009–2013. A 7-year aggregate panel dataset reveals that opening a perinatal centre corresponds to infant mortality reduction by 3.8 percent from the baseline rate, neonatal (0–28 day) mortality by 7 percent and early neonatal (0–6 day) mortality by 7.3 percent. We find that the perinatal centres help to save 263 additional infant lives annually, ranging from 3 to 25 lives in regions with different birth rates. However, we further find that an average cost per life saved is 52 million rb (or 2.6 million 2014 PPP USD), which is much higher than the cost of similar interventions in the United States.
click on a pic, if 502 Bad Gateway try another browser
† We thank Dmitry Nikolaevich Degtyarev, Joseph Doyle, John Komlos, Ekaterina Aleksandrovna Kvasha, Daria Pelech, Klara Sabirianova Peter, Frank Sloan, Susan Steiner, Christopher Timmins, Maximo Torero, Tanner Regan, Giuseppe Rossitti, Guzel Ernstovna Ulumbekova and the participants of the LSE Spatial Economics Research Center Conference and two anonymous referees for helpful comments and feedback. All errors of fact and interpretation are our own.

Friday, June 23, 2023

How Blood Type Prevalence Varies Around the World

World Blood Donor Day is organized every June 14 by the World Health Organization with the aim of raising public awareness about the need for safe blood, plasma and platelets as well as to celebrate the many people who save lives through their blood donations.

There are four different types of blood: A, B, O and AB. Each of these can either be positive or negative, depending on whether a protein known as the “Rh factor” is present in the red blood cells. Each blood type has slightly different qualities. For instance, those with type O- are universal donors. This means they can give blood to anyone. AB+ on the other hand is a universal acceptor, so they can receive donations from anyone. Only around seven percent of the world are Rh negative.

As the following map shows, the most common blood group worldwide is O positive. Europe tells a slightly different story, however, with the majority of its countries’ populations having A positive blood. Only two countries in the World Population Review’s records have a greater share of B positive blood types: Pakistan and Bangladesh.

While this chart is useful for getting an overview of regional patterns, it hides some of the finer details, such as how evenly split countries are by blood type. For instance, in China and India a fairly high share of the population has B+ blood. Meanwhile, in Europe many countries are fairly closely tied between O+ and A+. There are of course slight differences and exemptions, with the Nordic countries representing a slightly greater share of people having A+ versus O+, according to World Population Review. The U.S. is also fairly closely split, with 37.4 percent of the population having type O+ and 35.7 percent A+, while only 8.5 percent are B+ in the country.

The countries with the clearest prevalence of a given blood group are Ecuador, Peru and Zimbabwe, with 75 percent, 70 percent and 63 percent of O+ blood respectively.

According to the American Red Cross, the opposite rules apply when it comes to the universality of plasma transfusions. In that case, O- blood types can only donate plasma to other O- patients, while the universal plasma donor type is AB blood.How Blood Type Prevalence Varies Around the World
англофобии кусочек

Thursday, June 8, 2023

Is morbidity compressing around the globe?

June 5, 2023 Iñaki Permanyer, Francisco Villavicencio and Sergi Trias-Llimós

Does health deterioration manifest at increasingly (dis)similar ages? Iñaki Permanyer, Francisco Villavicencio and Sergi Trias-Llimós explore inequalities in age-at-morbidity onset globally, and find these to be larger than lifespan inequalities. As longevity increases, the locus of health inequality is moving from death-related inequalities to disease- and disability-centered ones.


As longevity increases worldwide, are the ages at which individuals’ health deteriorates becoming increasingly concentrated over time, or more spread out? This is one of the fundamental questions around which the so-called ‘Compression vs Expansion of morbidity’ debate has revolved for a long time (Gruenberg 1977, Fries 1980), but whose answers have been mostly restricted to a small group of low-mortality countries. In a new study, we assess whether morbidity is compressing or expanding in all countries around the world (Permanyer, Villavicencio and Trias-Llimós 2023). We do so by estimating levels and trends of the newly proposed Healthy Lifespan Inequality (HLI) indicators (Permanyer et al. 2022), which measure the variability in the ages at which individuals cease to be in good health.

Longer and healthier lives enjoyed by everyone?


To investigate whether the ages at which individuals’ health deterioration becomes increasingly concentrated or dispersed over time, we use data from the Global Burden of Disease project (https://ghdx.healthdata.org/record/ihme-data/gbd-2019-life-tables-1950-2019) to calculate the so-called ‘age-at-morbidity onset distributions’ – which are used to estimate survival probabilities in good health. Variability is measured with the standard deviation, a popular indicator of the spread of a distribution.

Figure 1, panels A and B, shows that the levels of HLI generally declined between 1990 and 2019 for both women and men, although not in high-income countries, where instead they stagnated. In general, females tend to exhibit higher variability in the ages at which they cease to be in good health. Another noteworthy exception is that of individuals aged 65 or more: in this group, the variability in age-at-morbidity onset has increased over time across all world regions (panels C and D in Figure 1).
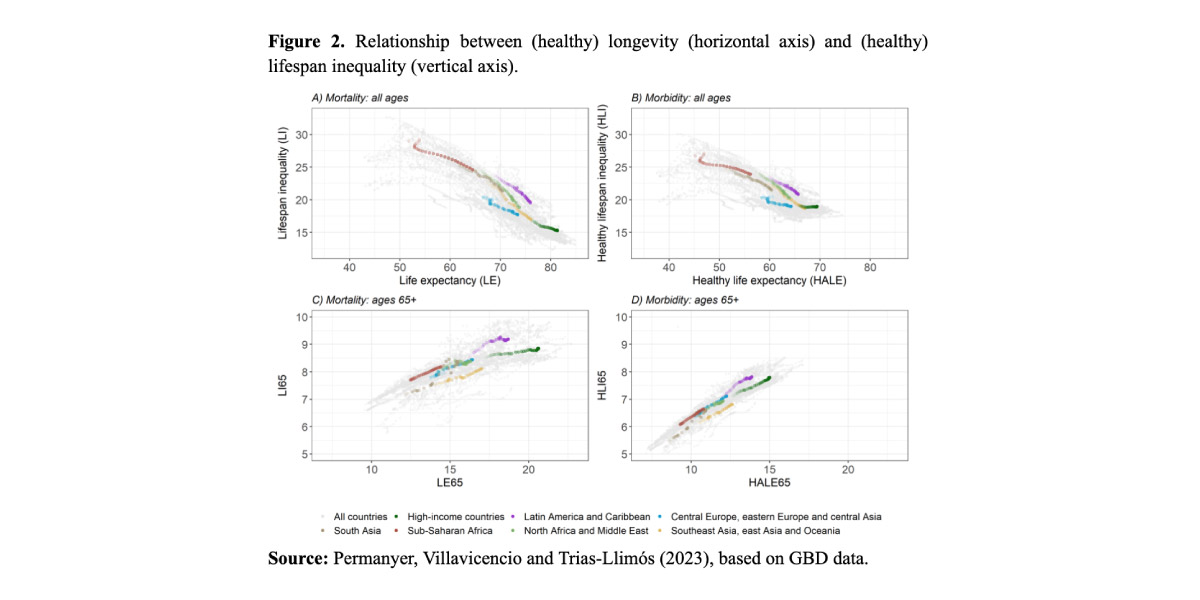
While the relationship between life expectancy and lifespan variability is strong and negative (Figure 2, panel A), the relationship between health-adjusted life expectancy and HLI is weaker and flatter (Figure 2, panel B). Among high-income countries and in Central Europe, Eastern Europe, and Central Asia, increases in health-adjusted life expectancy are not accompanied by reductions in HLI. Restricting the analysis to individuals above age 65, we observe a positive association between (healthy) longevity and (healthy) lifespan variability (Figure 2, panels C and D). This suggests that increases in healthy survivorship in those ages are associated with increases in the variability of the ages at which individuals’ health deteriorates, and similarly, increases in survivorship are associated with increases in the variability in age at death.

Discussion and implications


Previous approaches to assess whether morbidity is compressing or expanding have relied on the comparison of average indicators (i.e., average longevity, or life expectancy, versus average healthy longevity, or health-adjusted life expectancy). However, such average-based approaches do not take into consideration the variability in individuals’ health deterioration processes – a fundamental ingredient that, according to Fries (1980), should be included when studying morbidity dynamics, and which was incorporated in our analyses. Preliminary calculations suggest that the different approaches to assess whether morbidity is compressing or expanding do not yield consistent results, an issue not discussed here and that deserves further investigation.

Overall, high-mortality countries have been successful in increasing (healthy) longevity while simultaneously reducing (healthy) lifespan inequality. This has been the case of sub-Saharan Africa, South Asia, North Africa and the Middle East, or other regions with plenty of room for improvement. Conversely, low-mortality countries have not been very successful in further reducing the variability in healthy lifespans, so it is not clear whether morbidity is compressing or expanding there. Such stagnation might be the result of forces pushing in opposite directions. On the one hand, increases in living standards or the adoption of healthier lifestyles can postpone the deterioration of individuals’ health. On the other hand, screening and prevention programs could lower the age at diagnosis of important diseases (like mental disorders or cancers). Lastly, existing and broadening socioeconomic inequalities can contribute to widening the distribution of ages at which morbidity starts affecting individuals’ health.

The variability in the ages at which morbidity starts can be much larger than the variability in the ages at which individuals die, and this difference increases over time. While age at death is becoming increasingly predictable in longevity vanguard countries, the age at which health starts deteriorating is as uncertain now as it used to be three decades ago – an important finding with consequences for planners aiming to reduce population health inequalities. For instance, retirement or health care policies exclusively based on (increasing) trends in life expectancy might miss the mark and have deleterious social consequences if the corresponding morbidity onset distribution widens over time.

Interestingly, the same living standard improvements, medical innovations and technological breakthroughs that have contributed to reducing mortality-related inequalities across the world (as reflected in the decreasing inequalities in basic survival indicators like life expectancy at birth) have in turn contributed to the emergence of new layers of morbidity-related inequalities among adults at older ages, often to the advantage of privileged countries or socioeconomic groups. Our results point towards a compositional shift in health inequalities within countries: as longevity increases worldwide, the locus of health inequality over the lifespan is gradually moving from death-related inequalities to disease- and disability-centered ones. This compositional shift in health inequality should be taken into consideration in the elaboration of prospective public health policies.

References

    • Fries JF. (1980), “Aging, natural death, and the compression of morbidity”, New England Journal of Medicine 303:130–5.
    • Gruenberg EM. (1977), “The failures of success”. Milbank Mem Fund Q Health Soc: 3–24.
    • Permanyer, I., Spijker, J. and Blanes, A. (2022), “On the measurement of healthy lifespan inequality”, Population Health Metrics 20, 1. https://doi.org/10.1186/s12963-021-00279-8
    • Permanyer, I., Villavicencio, F. and Trias-Llimós, S. (2023), “Healthy lifespan inequality: morbidity compression from a global perspective”, European Journal of Epidemiology, DOI: 10.1007/s10654-023-00989-3.