Showing posts with label глобализм. Show all posts

Thursday, November 7, 2024

Global Leadership: Forces of Good or Ill?

Global Leadership: Forces of Good or Ill?The BRICS summit kicks off in the Russian city of Kazan today, marking the first of its kind since Iran, Ethiopia, Egypt and the United Arab Emirates joined the namesake members Brazil, Russia, India, China and South Africa in expanding the group. While Saudi Arabia has been invited to join too, it has not formally done so yet. The bloc’s growing influence as a global economic and political player is increasingly being recognised as a counterweight to the G7 on the international stage.

Data from a recent Ipsos survey of some 23,800 adults across 31 countries shows that people are generally skeptical of countries trying to use their influence abroad. In the cases of Russia and Iran, respondents were particularly likely to think that these two countries use their influence mostly for bad purposes around the world. This view has become more widespread since 2019. Now, only one in ten respondents say that Russia or Iran mainly use their influence for good.

Views on China are slightly more mixed, with three in ten saying the country uses its influence abroad for bad purposes, while a similar share considers the country’s foreign policy to have both positive and negative impacts. Perceptions of China have declined by 10 percentage points between the two survey waves.

As this chart shows, India is perceived somewhat better internationally than its aforementioned BRICS counterparts, with a lower 12 percent of respondents stating that it uses its influence mostly for bad. Three in ten respondents even said that the country does not use its influence at all. Meanwhile, pending group member Saudi Arabia saw its image improve marginally.

The United States, a key player in the G7, is also viewed with skepticism. It had the highest share of respondents stating that it uses its influence abroad for both good and bad, at 36 percent. Among U.S. respondents, 32 percent agreed with this statement. In South Korea, this rose to 50 percent. Of the 31 countries polled, the populations with the worst views of the U.S. were Indonesia and Turkey, where 36 percent and 33 percent, respectively, said the U.S. used its influence mostly for bad. The U.S. and Israel had the highest share of people saying the country used its influence for good (34 percent, 31 percent).

While this survey is extensive and informative, this data only captures part of the picture as some world regions are underrepresented. For example, South Africa was the only country surveyed in Africa.

Thursday, July 18, 2024

U.S. No Longer Seen as a Shining Example of Democracy

Другие страны больше не воспринимают США как пример демократии

U.S. No Longer Seen as a Shining Example of DemocracyПрежде всего, это характерно для других стран Запада: в Германии 62% опрошенных говорят, что США когда-то были хорошим примером демократии, но больше не могут им считаться, ещё 27% утверждают, что США никогда и не были хорошим примером демократии! В сумме: 89%.

Недовольны американской демократией и 86% британцев, 83% жителей Канады, 78% жителей Франции и далее по списку.

Наименьшее число скептически относящихся к демократии по-американски зафиксировано в Нигерии (в сумме - 30%) и ЮАР (49%)

Tuesday, July 2, 2024

allowed

Страны, где разрешена смена пола


В странах, выделенных синим цветом (а их немало: Канада, некоторые страны ЕС, многие страны Латинской Америки) пол можно сменить... Просто так! В большей части оставшихся стран Европы для этого нужно хотя бы медицинское заключение, а в Китае, Индии и многих странах Средней Азии и Ближнего Востока для смены пола нужна операция.

У нас, как и почти везде в Африке, и в некоторых (немногих) странах ЛатАма и ЮВА, смена пола теперь запрещена

Thursday, May 30, 2024

sex ratio

Соотношение мужчин и женщин в разных странах мира


В целом по миру, мужчин на нашей планете живет больше, чем женщин, но соотношение это очень зависит от страны.

В России (и в целом в пост-советских странах) женщин, напротив, гораздо больше: на 100 женщин в России приходится всего 87 мужчин, в Армении и того меньше - 82! Примерно такие же соотношения в Украина, Беларуси и странах Балтии. За пределами СНГ меньше 90 мужчин на 100 женщин приходится только в двух странах: Португалии и Зимбабве...

Самый экстремальный перекос мужчин наблюдается в нефтяных монархиях Залива: 266 мужчин на 100 женщин в Катаре, 228 - в ОАЭ. Правда, большая часть этих мужчин - мигранты, обеспечивающие прекрасную жизнь местного населения.

В странах Азии (почти всюду, включая Индию и Китай) есть небольшой, но заметный перекос в сторону мужчин, и обусловлен скорее культурными особенностями. В странах Запада и Латинской Америке женщин, напротив, обычно чуть больше, чем мужчин

Sunday, May 26, 2024

happiness is a warm gun

Рэнкинг стран мира по величине межпоколенческого разрыва в ощущении себя счастливым.


На данных Всемирного опроса ценностей (WVS - World Values Survey)

Разница в доле ощущающих себя счастливым среди респондентов до 30 лет и респондентов 50 лет и старше, процентных пунктов.

Величина разницы дана в скобках после названия страны.

В норме молодые поколения всегда счастливее старших (по ряду причин, но, в первую очередь, из-за состояния здоровья).

В лидерах опять посткоммунистические страны из-за того, что поколения этих народов, успевшие повзрослеть в коммунистических режимах, чудовищно травмированы шоковым переходом к рынку и прекрасными 90-ми.

Обратная ситуация, когда молодые менее счастливы, чем старшие — очень ненормальная и свидетельствует о том, что в таких обществах есть серьезные проблемы.

Thursday, May 9, 2024

The shifting landscape of family forms around the world

May 6, 2024 David S. Reher

Living arrangements have changed over the past five decades, leading to a decline of the extended family, growth of the nuclear family and, more recently, the appearance of living alone as a significant lifestyle option for many. Diversity continues to prevail around the world. These trends, David Reher argues, suggest patterns for the relatively near future.


Introduction


Knowledge of the family and the way it functions is essential for our understanding of contemporary society. Existing debates point to the uniqueness of the nuclear family in the developed West and the role development played in this process. Yet lack of comparable data for much of the world has limited the scope of research on the family around the world. Addressing this issue is now possible thanks to the revolution in census microdata provided within the IPUMS project (Minnesota Population Center 2020).

In a recent publication (Esteve & Reher, 2024), Albert Esteve and I make use of massive amounts of data (from 90 countries and 279 samples) to address key issues related to family organization –specifically to living arrangements and the way they have changed over the past half century. We classified basic living arrangements into three categories for each individual present in the household: living alone, living only with nuclear kin (parents, offspring and/or spouses), and living with at least one non-primary kin (grandparents, grandchildren, aunts, uncles, cousins, etc.) in addition to other primary kin. We estimated exposure rates for every age group and type of living arrangement. Combining these rates for all ages enabled us to generate estimates of the relative share of the life course spent in each type of living arrangement. The results provide a nuanced view of co-residence patterns for societies around the world over the past half century.
 

Major results


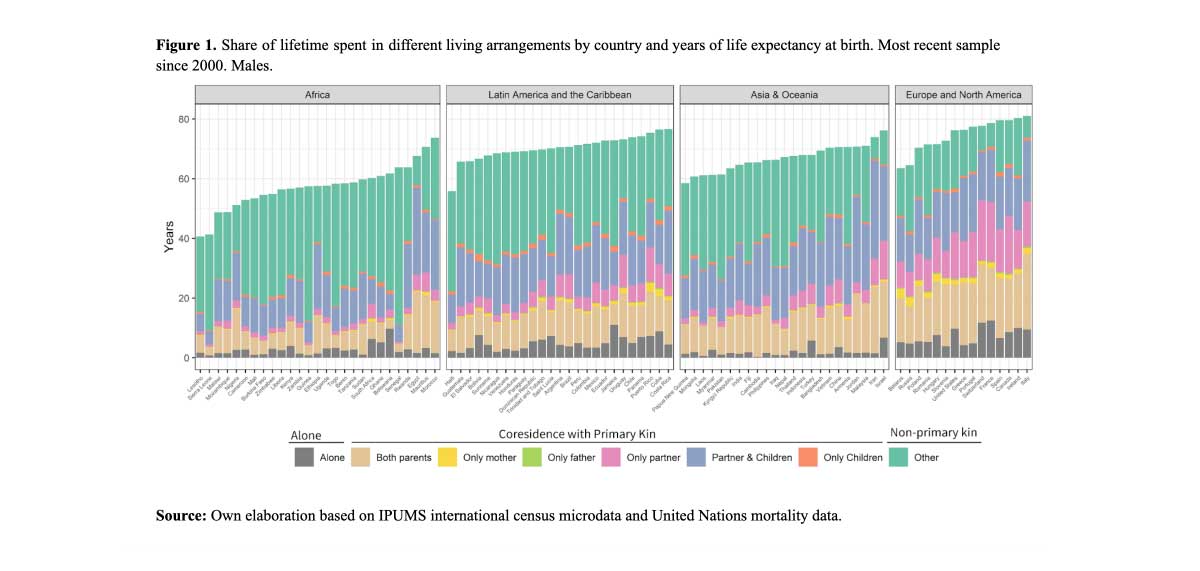
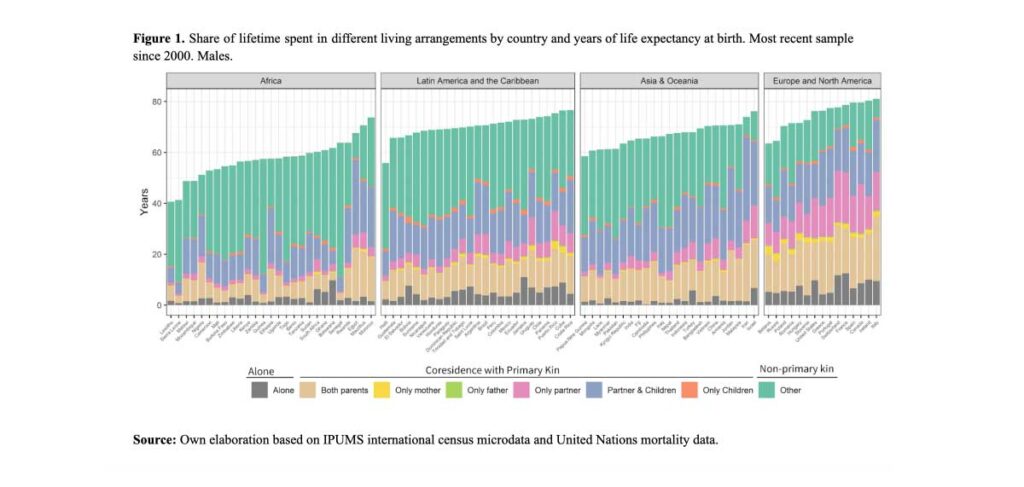
At the start of the twenty-first century there continued to be a wide diversity of family forms around the world. In some regions, people spent a large share of their lifespan living in large families with an abundant presence of non-primary kin and/or non-kin (e.g. many African countries), while in others, people spent most of their lives in households with only nuclear kin (e.g. most developed countries). The results presented in Figure 1 are based on males for the most recent census for each country. Individual country data are arranged by macro region (generally continent) and, within each region, according to the life expectancy in each country. In this way, columns are higher in countries with higher life expectancy. The disparities in the share of the lifespan spent living with non-primary kin (the key to all extended families) are vast, ranging from relatively low in Europe and North America to more than 50 per cent of total life expectancy in most of Africa and in many Latin American and Asian countries. At the outset of the twenty-first century, the world of the family was a diverse one indeed. The predominance of the nuclear family, so important for our understanding of the family around the world, only existed in the developed world, while extended families were predominant elsewhere.
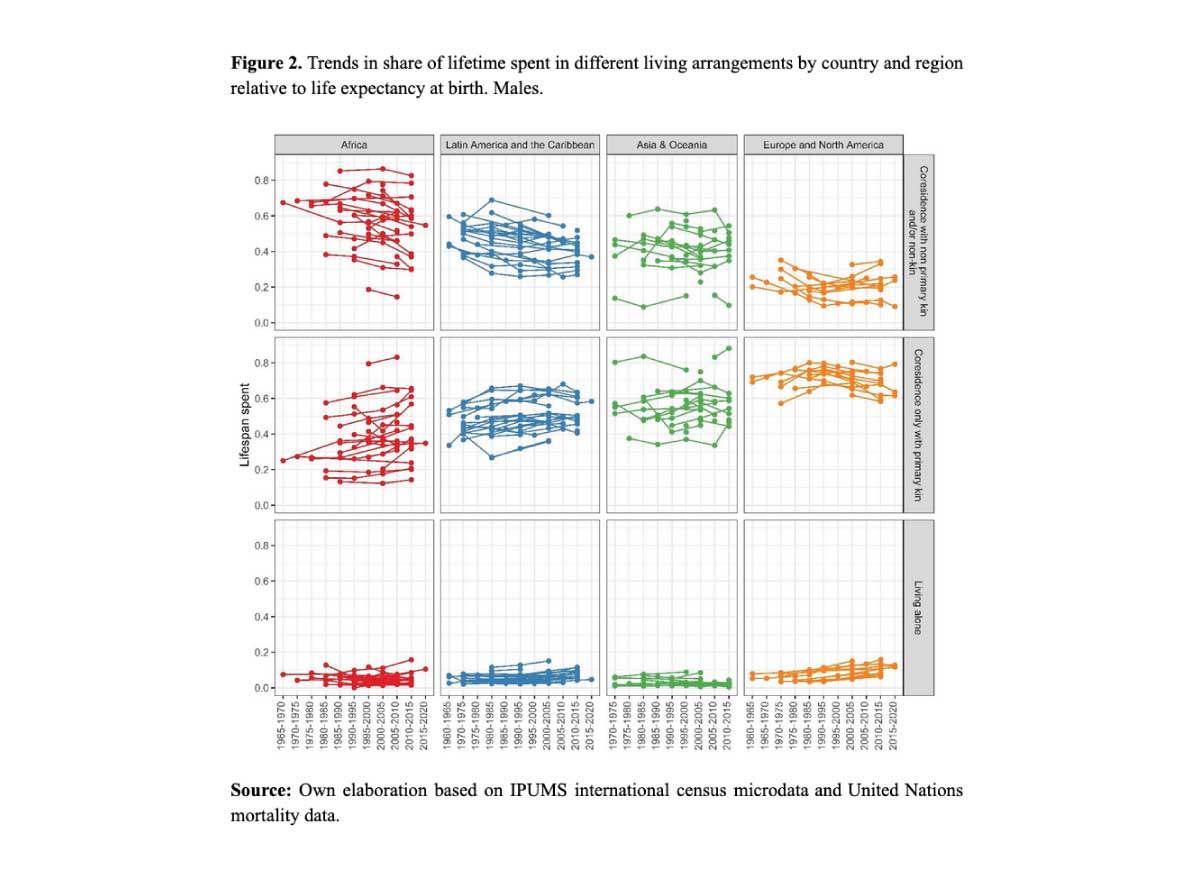
Change over time is shown in Figure 2 (again, only males) where different living arrangements are organized in horizontal panels and world regions are shown vertically. It is important to remember here that everywhere the sum of propensities for the three different living arrangements is, by definition, 1.0 in all countries. This figure shows the changes that have occurred over the past half century, with census dates marked by circles and country trends by lines.
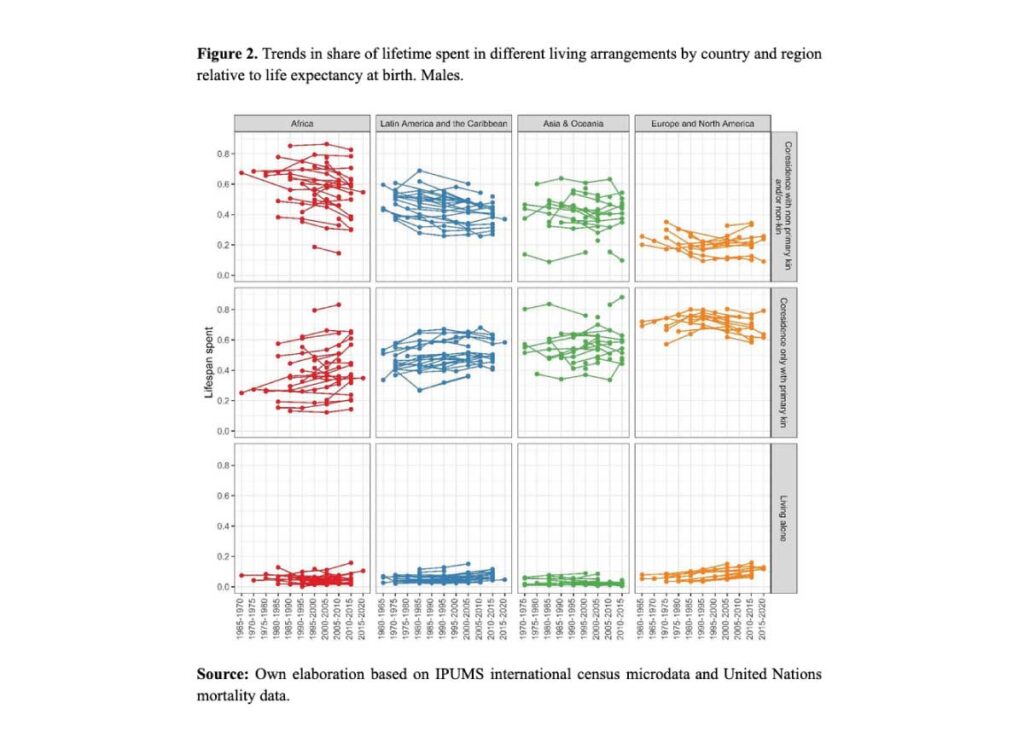
A major result from this figure is that the growth in the prevalence of living arrangements based only on primary kin (nuclear families) around the world over the past half century is especially strong in countries where starting levels were lower. Generally, growth in the prevalence of the nuclear family has been substantial and, by implication, that of the extended family has declined. It is important to underscore the overall diversity of these estimates, both in recent years and in the past. Africa was and is the world region where the presence of non-primary kin was, and continues to be highest, though there have been evident declines. This also fits for Latin America and Asia, yet the prevalence of extended families tends to be lower. The basic pattern of change, however, is very different in the developed world, where from the start the prevalence of nuclear families is much higher than elsewhere. Beginning in the 1990s, however, there is a clear halt to the decrease of extended families, coupled with a modest decline in nuclear families and increases in the shares of people living alone.

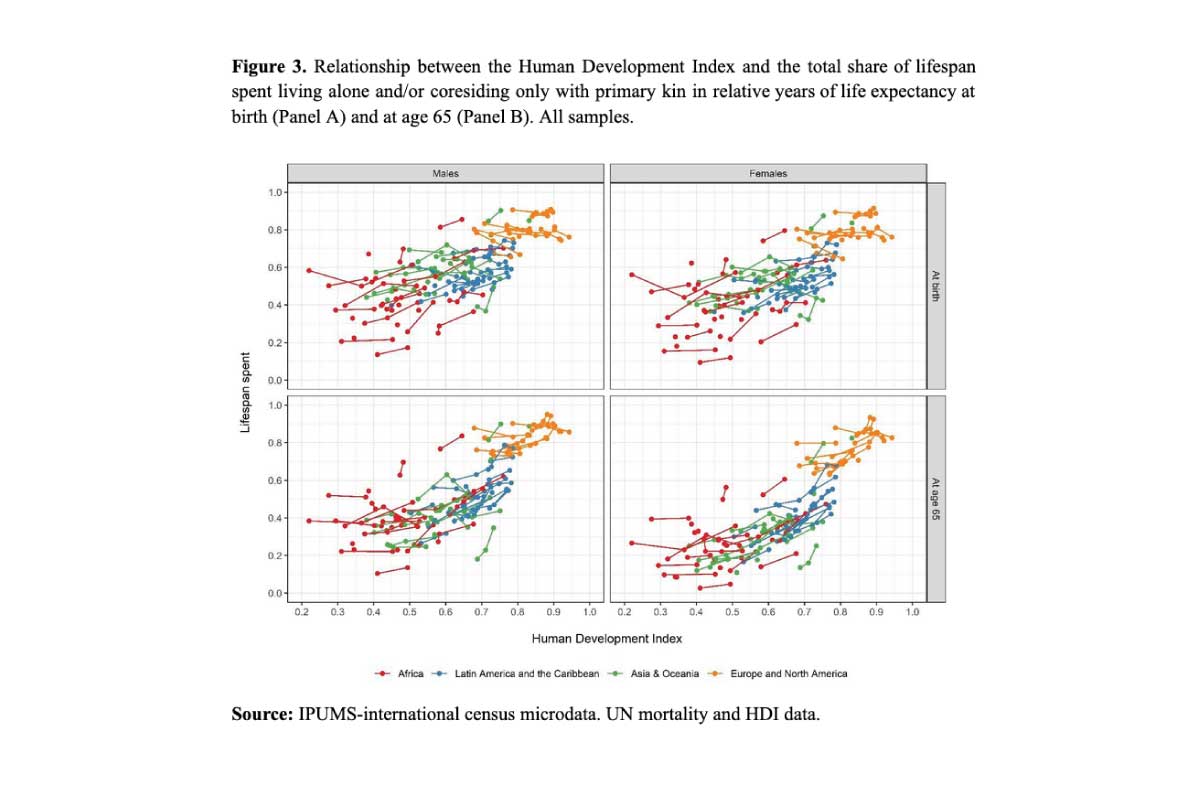
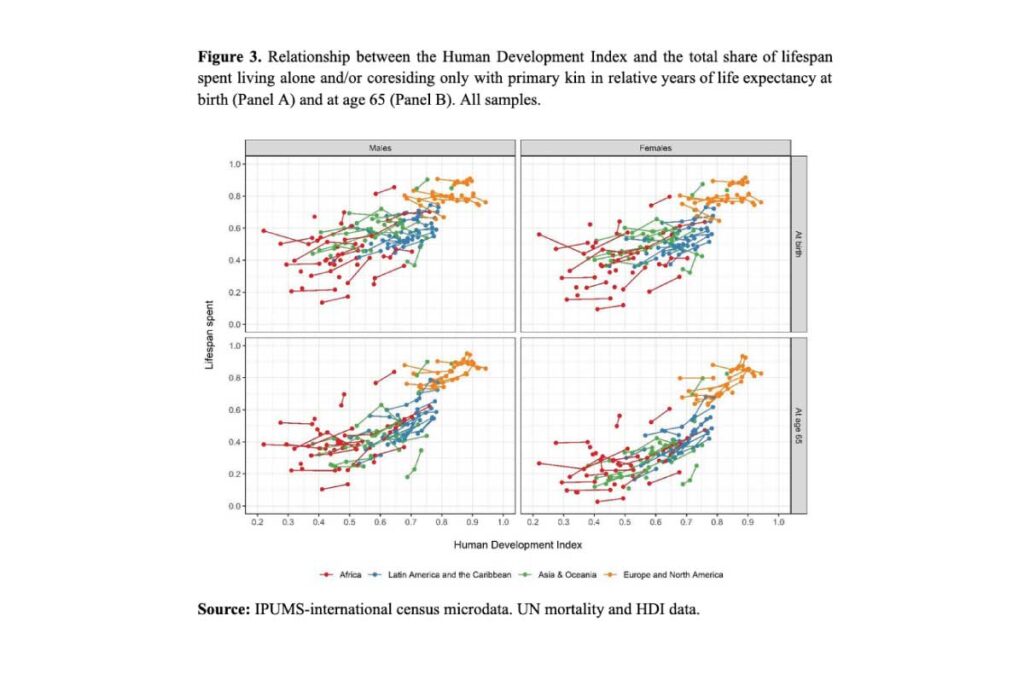
Countries with the highest levels of development are invariably ones where the prevalence of coresidence with non-primary kin and the extended family are lowest, yet time trends for individual countries are not always clear (see Figure 3 with results for males and females). If we only use data for elderly adults (>65) the links between development and the share of the lifespan spent living alone and/or with only nuclear kin are clearer.
A brief discussion


Should current trends continue, in the relatively near future we can expect a continued growth of nuclear living arrangements in much of the world. We can also expect, however, slow or negative growth, coupled with a continuing trend towards an incipient decomposition of the components of kinship in societies where living with nuclear kin is highest, caused largely by on-going reductions in the presence of offspring and of parenting couples in nuclear households. Quite possibly this will take place together with increases in the prevalence of either living alone or living in households including persons unrelated by kinship. These trends have important implications for policy, for society, and for the meaning itself of the family and family life in different parts off the world. Rapidly shrinking household size in much of the world provides a relevant backdrop for these important changes in kin-based co-residence (Esteve et al., 2024). In aging societies, the capacity of families to rely on traditional support networks for the health and well-being of their vulnerable members raises significant concerns.

It is often held that development is a major determinant of the prevalence of the nuclear family because it enables family groups to live in small units and, when the need arises, to avail themselves of institutional supports such as day care that tend to be widespread in societies that can afford them. It also brings improvements in health, longer lives and higher education for large segments of the population. Our study provides some support for this premise. It also points to the major role potentially played by fertility and mortality in shaping kin networks themselves and their needs, and invites further research on the emerging subject of the demography of kinship. Where networks are dense in human and social capital, kin available for co-residence are abundant and will be in demand. As these networks shrink, the prevalence of living arrangements based only around primary kin will increase and the presence of non-primary kin in households around the world will tend to decrease. Mortality also plays a role, especially because of its implications for health and longevity as well as the way it affects the number of available kin.

Once again, the timing and pace of the demographic transition emerges as a key factor in explaining the long-term trends of major social indicators. This does not negate the importance of culturally constrained preferences and values for family development over time, but it does appear to be a key marker for the timing and intensity of change. Development is, of course, important, but is not the sole factor. When kin networks shrink to their bare minimum, the realm of conscious choice tends to emerge as a key element in shaping family life. The influence of the second demographic transition on family structures in North America and Europe and, potentially, in many other societies around the world now and in the future, serves as a pertinent example.

Moving a bit further back in time, these findings also suggest that the prevalence of extended family living arrangements in much of the developing world may have peaked in the 1950s or 1960s, when fertility remained exceptionally high and mortality was already in sharp decline in many parts of the world. By contrast, in the developed world, fertility and mortality were already relatively low and, by implication, kin networks were relatively small, nuclear living was the norm, and ideas of change were pervasive. In this part of the world where closely aligned patterns of fertility and mortality together with relatively modest levels of population growth characterized the entire demographic transition, it is likely that kin networks were consistently modest in size and nuclear living was widespread well before the onset of the twentieth century.

A key, albeit surprising, finding of this paper is the evidence it provides of a recent trend reversal currently taking place in much of the most developed world involving large declines in co-residence only with primary kin, major increases in living alone, and modest increases in co-residence with non-primary kin. This trend is likely related to the spreading effects of the second demographic transition, to increasing longevity, to shrinking kin networks and to the increasing difficulties experienced by families in much of the world (Esteve and Reher 2021). Could it constitute the most recent stage of a fundamental pattern of family development over time outlined, at least in part, in this paper? Possibly. While speculative, this viewpoint warrants further investigation.

References

  • Esteve, Albert, David S. Reher. 2021.”Rising Global Levels of Intergenerational Coresidence Among Young Adults”. Population and Development Review 47 (3): 691-717. https://doi.org/10.1111/padr.12427.
  • Esteve, Albert and David S. Reher. 2024. “Trends in Living Arrangements around the World”. Population and Development Review. https://doi.org/10.1111/padr.12603.
  • Esteve, Albert, Maria Pohl, Federica Becca, Huifen Fang, Juan Galeano, Joan García-Román, David Reher, Rita Trias-Prats, and Anna Turu. 2004. “A global perspective on household size and composition, 1970–2020.” Genus – Journal of Population Sciences, 80 (2), pp 1-22. https://doi.org/10.1186/s41118-024-00211-6

Thursday, May 2, 2024

Suicide rates

Infographic: Suicide Rates Around the World | StatistaMay is Mental Health Awareness Month in the United States. According to the National Alliance on Mental Illness, participants use the month to focus efforts on “eradicating stigma, extending support, fostering public education and advocating for policies that prioritize the well-being of individuals and families affected by mental illness.”

The topic of suicide is an important part of this conversation. As the following chart shows, it is a truly global issue, even though estimated rates vary around the world. For example, according to OECD data, out of every 100,000 men in the United States an average of 23 committed suicide in 2021, while for women the average was close to six per 100,000. In several countries these figures are even higher, such as in South Korea, Lithuania and Hungary.

While there are significant differences between countries, one pattern is clear to see: the rates of men taking their own lives are higher than women in each of the 15 countries selected here. South Korea and Lithuania had the highest rates of suicide among men in 2022 (out of the countries reporting data), at 34.9 and 33.1 cases per 100,000 population, respectively. For women, South Korea and Japan had the highest rates of the selected countries, with 14.9 and 9.8.

If you or somebody you know are in need of help, you can find a list of suicide crisis lines and website for countries around the world here.

Friday, April 12, 2024

Global household trends:

converging sizes, divergent structures

April 8, 2024 Maria Pohl and Albert Esteve

Household structures reflect and affect social, economic, and demographic dynamics. Albert Esteve and Maria Pohl use the new CORESIDENCE database to explore the transformation of households over the last five decades. Their findings suggest a global decline in average household size, although household structures continue to differ across countries.


Households are core units of social organization and reproduction. Their fundamental characteristics, namely size and composition, reflect complex socio-economic and demographic changes (Bongaarts, 2001; Therborn, 2004, 2014). For instance, increases in one-person and two-person households at the expense of larger households might be driven by demographic changes, such as fertility decline or increased longevity. Household characteristics can have far-reaching implications for housing markets, intra and inter-household transfers, or gender relations. Studying household size or composition comparatively and over time allows us to understand how societies change, not only from a demographic standpoint but also from social and economic perspectives.

Comparative research on households on a global scale has remained relatively scarce due to data constraints. The newly developed open-access, open-source CORESIDENCE database aids researchers in filling this gap by providing harmonized household data on the national and subnational scales for 156 countries and 1,511 regions (Galeano et al., 2024), making it possible to study families and households on an international scale. Family researchers, like those studying fertility and mortality, can address questions about family change based on the increasing availability of empirical data, thanks to census microdata available from the Integrated Public Use of Microdata Series (IPUMS) and survey data from Demographic Health Surveys (DHS), Multiple Indicator Cluster Surveys (MICS), or the European Labor Force Surveys (EU-LFS).
 

Converging sizes: moving towards smaller households


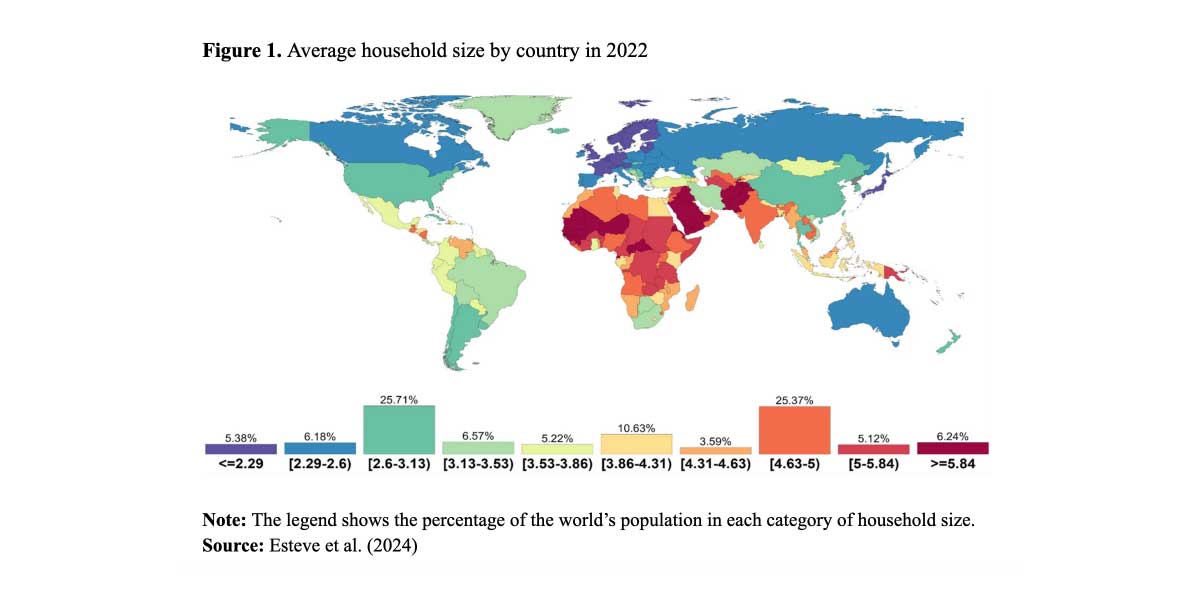
Despite some definitional differences, households are considered to be suitable units for comparative research (Bongaarts, 2001). Household size refers to the number of people who are living together in a dwelling at the time of data collection. It differs substantially across countries as it reflects their diverse fertility levels (Figure 1). However, it is also determined by social norms and customs governing family-formation processes, such as norms for establishing a new, separate household upon marriage.
Households are, on average, smallest in some East Asian countries and in Europe. Denmark leads this group, with an average household size of 1.8 people. The largest households, on average, can be found in Sub-Saharan Africa and among countries of the Arabian Peninsula and Central Asia, reaching a maximum of 8.4 people per household in Senegal, for example. The vast majority of the world’s population (around 83 percent) lives in countries with an average household size of between 2.3 and 5 persons.

Household size has declined quite steadily over the past five decades, by approximately 0.5 people per decade. When average household size in a country falls to around two, the rate of decline slows down: countries with comparatively large households and high fertility levels will likely drive any further decline in average household size. Shrinking households in contexts with relatively small households might suggest an increase in one-person households, driven by young adults who postpone their transition to adulthood or by older adults, such as women who live alone after the death of a partner. However, households do not shrink in all contexts: socio-economic conditions may foster intergenerational coresidence or alternative household configurations that could, at least partially, counteract the reduction in household size due to fertility decline. Moreover, some countries (e.g. Senegal) have maintained large households despite demographic changes.
 

Divergent structures: the roles of children and other relatives


The internal structure of a household is called household composition. This structure is based on a reference person in the household, commonly referred to as the household head or reference person in survey and census data. Household composition varies in response to demographic changes, such as a decline in fertility or changes in family and relationship forms, such as living-apart-together or intergenerational coresidence (Furstenberg, 2019). Household composition further reflects the age structure of a population: the number of children and adults available in a society for distribution across households differs according to the underlying age composition of the population.

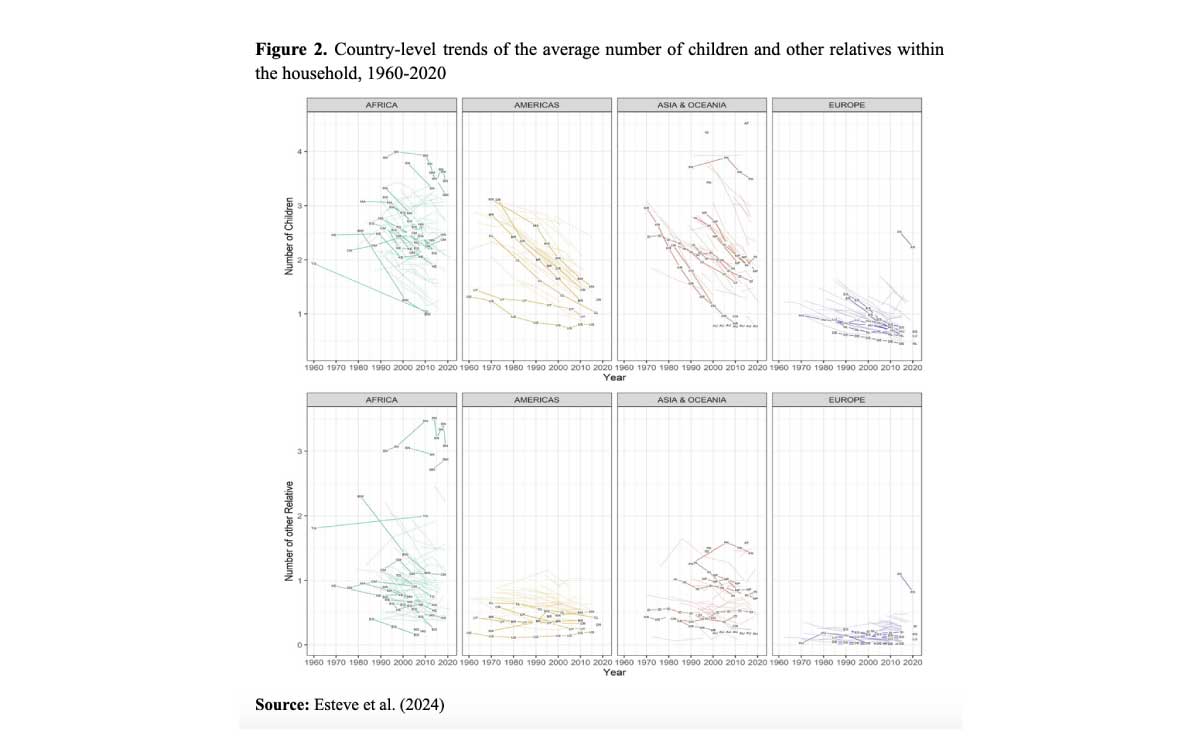
Fertility decline is a core driver of shrinking household size. However, across many contexts, the presence of other relatives of the household head is another crucial component of household composition. If the number of children in the household declines but the presence of other relatives remains stable, their relative weight in the household may increase, with possible implications for care transfers, decision-making processes, and family dynamics.

Figure 2 highlights the decline in children in the household (upper panel) across all major world regions. While children are the central driver of global heterogeneity in household size and composition, another important group contributing to global variation in household size and composition is that of other relatives (lower panel). In many countries, the presence of other relatives in absolute numbers has remained relatively unchanged.

Conclusions


Family patterns, socio-economic and demographic transformations, and cultural systems influence the persistent heterogeneity in household composition (Cherlin, 2012). Our results support the “convergence to divergence” hypothesis, which postulates that future family changes driven by social phenomena are certain but will produce different outcomes in different contexts (Pesando & GFC Team, 2019; Therborn, 2004, 2014). Fertility declines increase the prevalence of smaller households, yet we find persistent internal complexity of households in several countries. Interactions of global trends such as declining fertility and increasing life expectancy will result in different typologies of households, depending on the context in which such changes occur. We further anticipate that a continued decline in fertility rates will lead to smaller households and changes in household composition due to fewer living relatives available for coresidence.

The timing and occurrence of life-course events, societal structures, and individual factors drive variation in household structures. Shifts in transfer patterns, housing demand, gender relations, the division of labour, and living arrangements are some of the possible implications of changes in household structures. The CORESIDENCE project investigates these issues by examining links between households, living arrangements, and related socio-demographic indicators. The project entails macro- and micro-level analyses across various contexts, data sources, and spatial levels. We also invite and encourage other researchers to use the CORESIDENCE database.

Funding: CORESIDENCE is supported by an Advanced Grant funded by the European Research Council (ERC). Grant agreement ID: 101052787.


References

  • Bongaarts, J. (2001). Household size and composition in the developing world in the 1990s. Population Studies, 55(3), 263–279. https://doi.org/10.1080/00324720127697
  • Cherlin, A. J. (2012). Goode’s World Revolution and Family Patterns : A Reconsideration at Fifty Years. Population and Development Review, 38(4), 577–607. https://doi.org/10.1111/j.1728-4457.2012.00528.x
  • Esteve, A., Galeano, J., Turu, A., García-Román, J., Becca, F., Fang, H., Pohl, M., & Trias-Prats, R. (2023). The CORESIDENCE Database: National and Subnational Data on Household and Living Arrangements Around the World, 1964-2021. Zenodo. https://doi.org/10.5281/ZENODO.8142652
  • Esteve, A., Pohl, M., Becca, F., Fang, H., Galeano, J., García-Román, J., Reher, D., Trias-Prats, R., & Turu, A. (2024). A global perspective on household size and composition, 1970–2020. Genus, 80(1), 2. https://doi.org/10.1186/s41118-024-00211-6
  • Furstenberg, F. F. (2019). Family Change in Global Perspective: How and Why Family Systems Change. Family Relations, 68(3), 326–341. https://doi.org/10.1111/fare.12361
  • Galeano, J., Esteve, A., Turu, A., García-Roman, J., Becca, F., Fang, H., Pohl, M., & Trias-Prats, R. (2024). CORESIDENCE: National and subnational data on household size and composition around the world, 1964–2021. Scientific Data, 11(1), 145. https://doi.org/10.1038/s41597-024-02964-3
  • Pesando, L. M., & GFC team. (2019). Global Family Change: Persistent Diversity with Development. Population and Development Review, 45(1), 133–168. https://doi.org/10.1111/padr.12209
  • Therborn, G. (2004). Between sex and power: family in the world, 1900 – 2000 (Reprinted). Routledge.
  • Therborn, G. (2014). Family Systems of the World: Are They Converging? In. J. Treas, J. Scott, & M. Richards (Eds.), The Wiley Blackwell Companion to the Sociology of Families (1st ed., pp. 1–19). Wiley. https://doi.org/10.1002/9781118374085.ch1

Friday, March 15, 2024

the explosive growth of AI-powered fraud

Объём мошенничества с использованием ИИ растёт по всему миру просто чудовищными темпами


В 2023 году на Филиппинах число случаев мошенничества с использованием ИИ (как правило, дипфейки) выросло на 4500% по сравнению с 2022! Во Вьетнаме рост составил больше 3000%, в Японии - 2800%.

Четырёхзначные цифры темпов роста зафиксированы и в США, ОАЭ, ЮАР и многих странах Европы.

И ведь то ли ещё будет! Буквально с каждым днём технологии работают всё лучше и становятся всё доступнее

на статисте не нашол

Thursday, February 29, 2024

fertility

Рождаемость в мире в 2021


В среднем по миру, в 2021 одна женщина имела 2.3 ребёнка - больше, чем уровень воспроизводства населения (2.1), но: в 1963 средняя женщина рожала 5.3 детей, и даже относительно недавно, в 1992, 3 детей.

За пределами Африки и Азии мест с рождаемостью на уровне воспроизводства или выше (выделены синим на графике) почти не осталось - только несколько стран в Латинской Америке да Грузия. Весь остальной мир - вымирает

Saturday, December 23, 2023

climate ?

Surge in extreme forest fires fuels global emissions

Climate change and human activities have led to more frequent and intense forest blazes over the past two decades.

By Xiaoying You

Global forest fires emitted 33.9 billion tonnes of carbon dioxide (CO2) between 2001 and 2022, according to a report by the Chinese Academy of Sciences (CAS). This makes the CO2emissions generated by forest fires each year higher than those from burning fossil fuels in Japan — the world’s sixth-largest CO2 emitter. Driving the emissions spike was the growing frequency of “extreme forest-fire events”.

Xu Wenru, a co-author and a landscape ecologist at the CAS Institute of Applied Ecology, based in Shenyang, China, says that the term ‘extreme forest fires’ generally refers to blazes that, compared with an average forest fire, burn through a larger area, last for a longer time and leave a bigger impact.

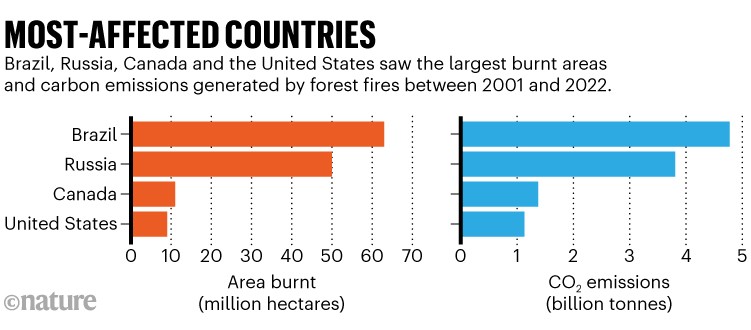
Xu and her colleagues found that the growth in emissions had been mostly fuelled by an uptick in infernos on the edge of rainforests between 5 and 20º S and in boreal forests above 45º N.

In particular, the emissions from boreal-forest blazes “showed a rapidly growing trend”, she says.

The increased numbers of forest fires was partially driven by the frequent heatwaves and droughts caused by climate change, Xu says. “In turn, the CO2 emitted by forest fires contributes to global warming, creating a feedback loop between the two.”

Humans also played a part. “Many forest fires were actually caused by humans when they were, for example, building fires to get warm at night, lighting fireworks or discarding cigarette butts,” says Xu.

Zhou Tianjun, a meteorologist at the CAS’s Institute of Atmospheric Physics in Beijing, found the report shocking. In particular, he points to a figure showing that, on average, the area of forest burnt by fires between 2001 and 2022 was 11 times the size of the forests planted by humans each year during that period.

“Tree plantation has been regarded as an important way to increase carbon sinks, but this figure shows that humans’ efforts could be offset by natural forest fires,” he says.
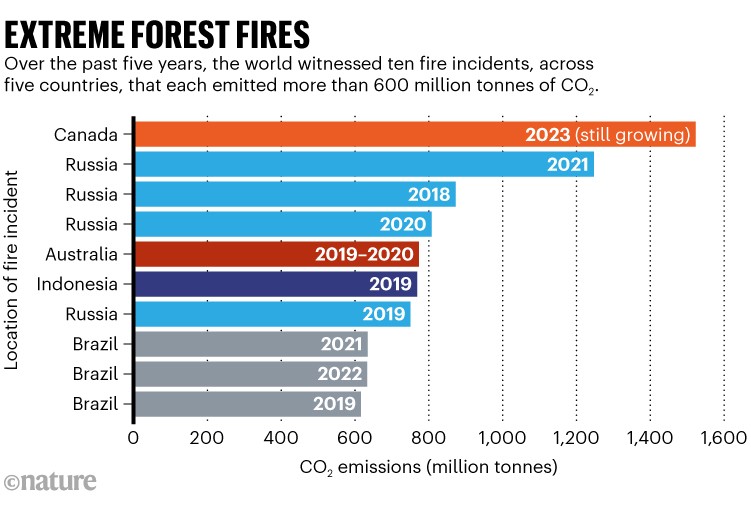
The report singles out ten extreme forest-fire incidents that occurred between 2018 and 2023, each of which sent more than 600 million tonnes of CO2 into the air. They were concentrated in five countries, all of which have vast forests: Russia, Brazil, Canada, Australia and Indonesia (see ‘Most- affected countries’).

Topping the emissions list is this year’s record-breaking conflagration that ripped through Canada, home to 28% of the world’s boreal forests. In 2023, more than 6,700 fires have broken out across the country, burning through a total of 18.5 million hectares, almost half the size of Norway.

The CAS report found that the forest fires in Canada this year had emitted more than 1.5 billion tonnes of CO2 as of October (see ‘Extreme forest fires’), surpassing the emissions from all forest fires in the country over the previous 22 years combined.
The effects of forest fires and other types of wildfire are expected to worsen across the world in the decades to come.

Wang Yuhang, an atmospheric scientist and professor at the Georgia Institute of Technology in Atlanta, says the report complements his work1 which “indicates a roughly 20% rise in global burnt area by the 2050s compared to the 2000s”.

“More surprisingly, global fire carbon emissions are expected to double, highlighting the emergence of fire as a more significant carbon source at short-term timescales in the future,” Wang adds.

Wang echoes the report’s suggestion that countries should include carbon emissions from forest fires into their national climate plans and set up a monitoring, reporting and verification system for such emissions.

Given the scale of emissions that they generate, forest fires have become a source of CO2emissions that “cannot be ignored”, Xu says.

doi: https://doi.org/10.1038/d41586-023-04033-y

Thursday, December 14, 2023

eggs

Россия обнулила пошлины на яйца: ждут поставки из Турции


На фоне резкого роста цен на куриные яйца в России, правительство решило отменить пошлины на этот вид продукции, чтобы исправить ситуацию с помощью импорта, сообщает РБК. Нулевые пошлины вступят в силу 1 января 2024 года. В настоящее время пошлина составляет 15%.

Министерство сельского хозяйства тем временем сообщает, что в ближайшие дни будут импортированы куриные яйца из Азербайджана. Вскоре после этого последуют поставки из Турции. Импорт должен стабилизировать цены в течение месяца.:

Нулевые пошлины будут действительны в течение полугода.

В октябре 2023 года куриные яйца подорожали на 23,9% по сравнению с октябрем 2022 года.

Западные санкции, введенные после широкомасштабного вторжения в Украину, привели к росту цен, в том числе, и на продовольствие.

source: xxx

Wednesday, December 13, 2023

climate

Насколько вырастет средняя температура в разных странах мира к 2100 году


По сравнению со средней температурой во второй половине 19 века, к 2100 году в России, по прогнозам, станет в среднем на 4.98 градуса теплее - и это один из самых высоких результатов в мире! Более сильное потепление ожидается только в Канаде - сразу на 5.21 градуса, а сопоставимое с нашим - в Монголии, на 4.97 градуса.

Среднее потепление в большинстве стран Европы ожидается в диапазоне от 3.5 до 4 градусов, в странах Латинской Америки - ближе к 3, во многих регионах Африки станет на 3.5-4 градуса жарче

кортинко тыцабельно

Friday, December 8, 2023

Where Can the Most Chips Be Manufactured?

Even with semiconductors being integral parts of the automotive and computing industries for decades, the race for AI dominance and more and more of our digital infrastructure moving to the cloud greatly exacerbated the need for high-capacity data centers and chip production by companies like Intel, Samsung or Taiwan-based TSMC. But even with U.S. companies taking the lead in global revenue share, the country lacks production capacity.

According to data from semiconductor lobby organization SEMI, about 70 percent of total manufacturing capacity lies in South Korea, Taiwan and China, with the Americas ranking fifth after Japan, which boasted a 13 percent share in 2022. The picture was decidedly different just a couple of decades ago, with the United States covering 37 percent of fabrication capacity in 1990, Europe a further 44 percent and Japan came in third at 19 percent. The latter was considered a semiconductor powerhouse in the 80s, making up 51 percent of worldwide chip sales in 1988. The bursting of the island nation's economic bubble in the 90s led to it losing its technological leadership role to Western economies.

To reclaim at least parts of its former manufacturing dominance, the Biden administration passed the CHIPS and Science Act in August 2022, allocating around $280 billion to push the lagging domestic chips industry in terms of research and production. Whether this measure is enough for the United States to squeeze past its biggest economic competitor, the People's Republic, remains to be seen.

The data used for this chart is based on one of two annual Fab Outlooks by SEMI. Even though 200mm wafers are still widely produced and used, the chart focuses on 300mm wafers, which were introduced in 2001, can house more chips and are thought to be more cost-efficient. In 2022, the new standard and its predecessor exhibited similar levels of production volume, but these figures are estimated to change drastically over the coming years.

For 2026, SEMI forecasts a monthly volume of 9.6 million 300mm wafers, while 200mm wafer production will allegedly stand at 7.7 million per month. In the latter category, China leads in terms of fabricating capacity, with Japan and Taiwan coming in second and third, respectively.Where Can the Most Chips Be Manufactured?

Saturday, November 18, 2023

Official development assistance (ODA) is increasing, but not at the rate it needs

Official development assistance (ODA) and partnerships are crucial for the world to succeed in delivering opportunities for lower-to-middle income countries. That is what SDG 17 stands for: a revitalization of global aid as a catalyst for progress – a condition that relies heavily on large (and continuous) movements of resources from higher-income countries to least-economically-advantaged ones.

According to the available data, 2022 saw a total of US$211.3 billion being delivered in support for the world’s poorest countries – a significant increase from 2021, year in which the amount of aid stood at US$186 billion. Nowadays, global aid is at an all-time high. However, this is due to contributions for three specific events: the COVID-19 pandemic, the Russian invasion of Ukraine, and the refugees arriving in donor countries.

If we take a closer look, data shows that resources allocated to other areas would have decreased by 1.2 percent if the contributions made for these unique events – pandemic assistance, in-donor-country refugee support, and direct aid to Ukraine – had not existed.
What is the world’s threshold in terms of how many resources are given in official development assistance? SDG 17.2 has set the target for developed economies to allocate 0.7 percent of their GNIs to fund aid for less-wealthy nations across several sectors such as health, education, infrastructure, agriculture, and others.

As shown by the chart below, the world is far from meeting this goal. Altogether, developed countries would have had to increase their contributions by US$200 billion in order to fulfil this commitment in 2022.

Support for the world’s poorest countries in most need of aid – also known as LDCs, or Least Developed Countries – has also fallen short of the goal.

SDG 17.2 states that development aid for LDCs should account for somewhere between 0.15 and 0.20 percent of donor countries’ GNIs. Unfortunately, the gap is widening, as shown in the chart below.
Learn more about ODAs, donor countries, resource flows and sectors aided in the seventeenth story of our 2023 SDG Atlas.

Thursday, November 16, 2023

beer

В Петербурге задержали двух топ-менеджеров «Балтики», которую власти России забрали у Carlsberg


В Петербурге возбуждено дело о мошенничестве в пивоваренной компании «Балтика», подтвердили «Интерфаксу» в четверг в правоохранительных органах. Что известно:

Собеседник агентства сообщил, задержаны два топ-менеджера компании, не уточняя их должностей и имен. «Возбуждено дело по ч.4 ст.159 УК РФ (мошенничество, совершенное организованной группой либо в особо крупном размере)», — сказал собеседник агентства.

Накануне о задержании двух топ-менеджеров «Балтики» сообщало издание «Фонтанка». По его данным, их подозревают в «защите интересов» компании Carlsberg Group и попытке передать датской компании «права на исконные бренды российской компании».

Carlsberg вскоре после начала войны России против Украины объявила о планах покинуть российский рынок. В июне этого года компания подписала соглашение о продаже «Балтики» (не назвав покупателя), однако в июле российский президент Владимир Путин подписал указ, по которому «Балтика» была передана Росимуществу на временное управление.

Carlsberg после этого разорвала все связи со своим бизнесом в России и обвинила российское правительство в том, что оно его «украло».

В начале октября компания отозвала у «Балтики» лицензии, позволявшие ей производить и продавать пиво с ее брендами — как международными, так и российскими. «Балтика» в свою очередь обратилась в арбитражный суд с просьбой запретить Carlsberg расторгать с ней лицензионное соглашение на использование брендов.

По версии «Фонтанки», российские следователи считают, что руководство «Балтики» передало аффилированным с Carlsberg иностранным компаниям права на аренду российских брендов пивоваренного завода. Это якобы происходило еще до передачи российских активов Carlsberg Росимуществу и стало основанием для расследования уголовного дела по статье о мошенничестве.

Полиция и ФСБ, как утверждает «Фонтанка», провели обыски в офисе «Балтики» и у ее топ-менеджеров, были изъяты документы. Двух топ-менеджеров задержали, 16 ноября им изберут меру пресечения, а еще один подозреваемый успел покинуть страну, сообщило издание.

В пресс-службе «Балтики» отказались комментировать ситуацию, отмечает «Интерфакс».

Wednesday, November 15, 2023

overpopulation

Сколько людей способна вынести Земля?


В начале XIX столетия общее население Земли составляло 1 миллиард человек. А 15 ноября 2022 года, год назад, родился восьмимиллиардный житель нашей планеты. И по прогнозам учёных пик ожидается к 2080 году.

Учёные обеспокоены таким ростом, многие города и страны перенаселены. Но при этом на планете есть места, где вообще никто не живёт.

Чем грозит перенаселение и как планируется решать эту проблему? Или такой всё же не существует?

Tuesday, November 14, 2023

total fertility, 1950

тыцабельно (лично я, полечу пря ни хрена не вижу)

Рождаемость в мире в 1950 году


В продолжение разговора про население мира: ещё каких-то 70 лет назад, на памяти некоторых и ныне живущих людей, самая низкая рождаемость в мире была в Германии: в среднем 2 ребёнка на одну женщину! В Австрии это число составляло 2.1 (и Германия с Австрией были единственными странами мира с рождаемостью ниже уровня воспроизводства населения!), в Великобритании - 2.2.

Для сравнения: сейчас даже в Индии рождаемость опустилась до 2.05 ребёнка на женщину (что ниже уровня воспроизводства населения), в Китае она уже давно гораздо-гораздо ниже.

Как быстро меняется мир

Monday, October 16, 2023

Monday, October 9, 2023

both sides

Израиль и Палестина с 1947 по сегодняшний день


Два варианта карты, показывающей эволюцию раздела территории Израиля и Палестины

Верхний блок соответствует позиции Палестины: к началу 1947 года в Палестине жило достаточно много (порядка трети, до Второй Мировой эта цифра была в разы ниже) евреев, их поселения отмечены белым на верхней левой карте. Мандатом ООН территория Палестины была разделена на Израиль и собственно Палестину, а впоследствии Израиль планомерно захватывал всё больше земли

Нижний блок карт - позиция Израиля: на контролируемой Британией территории Палестины было много еврейских и палестинских поселений. По мандату ООН их разделили на две страны, палестинскую часть захватили Египет (сектор Газа) и Иордания, а потом к 1995 на части этих территорий получилось таки восстановить палестинское самоуправление

Что важно. Вне зависимости от того, кто кого больше обидел - нельзя просто так убивать мирных людей. Нельзя угонять в плен и насиловать. Можно, и нужно - договариваться. Всем мира!