Showing posts with label сверхсмертность. Show all posts

Wednesday, September 25, 2024

Europe’s COVID-19 death toll in 2020 and 2021: stark regional differences September 2, 2024

By Florian Bonnet, Pavel Grigoriev, Markus Sauerberg, Ina Alliger, Michael Mühlichen and Carlo-Giovanni Camarda

Europe was hard-hit by the COVID-19 pandemic in 2020 and 2021. While its effects at national level are now well known, intranational differences have been less frequently investigated. Florian Bonnet, Pavel Grigoriev, Markus Sauerberg, Ina Alliger, Michael Mühlichen and Carlo-Giovanni Camarda fill this knowledge gap and show that considerable heterogeneity exists at regional level, even within the same country.


In 2020 and 2021, drastic measures were taken to combat the COVID-19 pandemic, contain the spread of the virus and limit the number of deaths. The efficacy of these measures, initially hard to evaluate (Caporali et al 2022), can be better assessed today, as reliable estimates of deaths caused by this pandemic are now being published by major research institutes in scientific journals and by international organizations. In a report issued in May 2024, for instance, the World Health Organization (WHO) estimated that life expectancy dropped by 1.8 years between 2019 and 2021 globally, erasing a decade of progress.

COVID-19-related excess mortality


These estimates are derived from what is known as excess mortality, which represents the difference between observed mortality during the pandemic years and the mortality that would have been expected in its absence. Excess mortality can be quantified using different indicators, such as the number of excess deaths. However, comparing this indicator between countries of different sizes and age structures can be misleading. Another informative metric is the loss of life expectancy at birth, calculated globally by organizations like WHO.

The regular calculation, publication, and dissemination of excess mortality indicators serve as crucial tools for comparing the pandemic’s impact across different countries at national level. However, the pandemic did not have a homogeneous impact at subnational level, primarily due to the varying confinement strategies implemented to curb the spread of the virus. This variability underscores the importance of quantifying these indicators at a more granular geographical level to highlight the pandemic’s impact in the regions most severely affected. Detailed geographical analysis of excess mortality can thus localize the effect of the pandemic and help tailor response strategies accordingly.

Mortality in Europe at subnational level: 2020 and 2021


In a series of studies published in 2024, we first proposed an innovative method to calculate excess mortality at a fine regional level (Bonnet and Camarda 2024), then used this method to estimate the levels of excess mortality in 561 European regions covering 21 countries in 2020 (Bonnet et al 2024a). We finally expanded our geographical scope to 569 regions covering 25 European countries, differentiating between the two pandemic years, 2020 and 2021 (Bonnet et al. 2024b). These estimates are the outcome of a thorough process involving the collection of data from a wide array of national statistical institutes. Here, we present our findings based on loss of life expectancy at birth for both sexes combined.
Figure 1 depicts the spatial distribution of the estimated life expectancy losses in 2020. Losses were highest in northern Italy and central Spain, with values close to 4 years in the regions of Bergamo and Cremona, 3.5 years in Piacenza, and 3 years in the Spanish regions of Segovia, Ciudad Real, Cuenca, and Madrid. They are even higher when considering only men (not shown here), who were more severely affected by the pandemic: life expectancy loss is close to 5 years in Cremona and 4.5 years in Bergamo. Losses in 2020 were more moderate, though still dramatic, in eastern Europe (notably in Poland), eastern Sweden, and northern and eastern France. In the latter, the Paris region and areas near the German border showed the highest values, ranging from 1.5 to 2 years. Conversely, the losses were much lower in other geographical areas, such as southern Italy, much of Scandinavia and Germany, and western France, where life expectancy remained close to what would have been expected in the absence of the pandemic.

Figure 2 presents the estimated life expectancy losses in 2021. At first glance, the regions affected by excess mortality were not the same as in 2020. The most significant losses were predominantly in eastern Europe. More broadly, among the regions where life expectancy losses exceed 2 years, we find 61 of the 73 Polish regions, 12 of the 14 Czech regions, all eight Hungarian regions, seven of the eight Slovak regions, but only one Italian region and one Spanish region, even though these two countries were also heavily impacted in 2020. Moreover, the life expectancy losses were much greater in Germany in 2021 than in 2020, especially in the eastern part of the country where values often exceed 1.5 years. In southern Saxony, Halle, and Lusatia, losses were nearly 2 years. Conversely, the lowest values were observed in Spain and Scandinavia. In France, life expectancy losses were more uniform than in 2020, generally ranging between 0 and 1.5 years, with the highest loss in the Parisian 
suburbs (Seine-Saint-Denis) where it reached 1.5 years (2 years for men).

Ranking European regions


Combining the data from both years, an overall assessment of the mortality impact of COVID-19 is possible (Bonnet et al 2024b). The regions where mortality increased the most in 2020 and 2021 are Pulawy, Bytom, and Przemyski in south-eastern Poland, and Kosice and Presov in eastern Slovakia. More broadly, eastern European regions predominate among the top 50 regions, which include 36 Polish regions, six Slovak regions, two Czech regions, one Hungarian region, and the two Lithuanian regions. Notably, the Italian regions of Cremona, Bergamo, and Piacenza complete this panel, ranging between the 15th and 30th places. In France, Seine-Saint-Denis ranks 81st, while all other French regions rank below the 100th place.

Conclusions


In conclusion, analyzing the impact of a crisis like the COVID-19 pandemic on longevity at a fine geographical scale is essential, as within-country disparities can be significant. This was notably true for Italy in 2020 (between the South and the North), and for Germany in 2021 (between the west and the east). Our study highlighted the severe impact of the pandemic in certain European regions, where the loss of life expectancy exceeded 3 years. The most affected regions shifted between 2020 and 2021, moving from areas with traditionally high life expectancy (northern Italy, central Spain, Greater Paris) to those with traditionally low life expectancy (Eastern Europe). France was relatively spared compared to the rest of Europe except for Seine-Saint-Denis. The coming years will be crucial for determining whether life expectancy levels return to their long-term trajectory or whether the pandemic has caused a structural impact in certain regions.

References

  • Caporali, A., Garcia, J., Couppié, É., Poniakina, S., Barbieri, M., Bonnet, F., … & Torres, C. (2022). The demography of COVID-19 deaths database, a gateway to well-documented international data. Scientific Data, 9(1), 93.
  • Bonnet, F., & Camarda, C. G. (2024). Estimating subnational excess mortality in times of pandemic. An application to French départements in 2020. PLoS ONE, 19(1), e 0293752.
  • Bonnet, F., Grigoriev, P., Sauerberg, M., Alliger, I., Mühlichen, M., & Camarda, C. G. (2024a). Spatial variation in excess mortality across Europe: a cross-sectional study of 561 regions in 21 countries. Journal of Epidemiology and Global Health, 1-10.
  • Bonnet, F., Grigoriev, P., Sauerberg, M., Alliger, I., Mühlichen, M., & Camarda, C. G. (2024b). Spatial disparities in the mortality burden of the covid-19 pandemic across 569 European regions (2020-2021). Nature Communications, 15(1), 4246.

Monday, July 10, 2023

excess mortality 22

избыточная мужская смертность в 2022


На Медузе и Медиазоне сегодня вышло ГИГАНТСКОЕ расследование о мужской избыточной смертности в России за время войны (спойлер: ~25 тыс. в 2022; ~50 тыс. до конца мая 2023). Уникальные данные (реестр наследственных дел!) и огромная работа. Рекомендую. (Самая подробная версия -- по-русски на Медузе.)

https://meduza.io/feature/2023/07/10/47-tysyach-pogibshih-rossiyskih-soldat
https://zona.media/article/2023/07/10/stats
https://meduza.io/en/feature/2023/07/10/bring-out-your-dead
https://en.zona.media/article/2023/07/10/stats

Напишу здесь о небольшой части расследования: по годовым данным Росстата за 2022. Предыдущая запись на эту тему: https://kobak.livejournal.com/130289.html; тогда данных за 2022 еще не было. Некоторые говорили, что Росстат не выдаст данные за 2022, но ничего подобного: я в июне сделал запрос, и мне все прислали. Данные и анализ лежат тут: https://github.com/dkobak/excess-mortality-war.

Сырые данные выглядят так:

Избыточная смертность среди мужчин 20-24 и 25-29 очевидна, и ее несложно оценить на глазок. Но в более старших группах это труднее. Посмотрим, например, на 35-39:

а) Кол-во мужских смертей в 2022 меньше, чем в 2021. Но в 2021 был пик эпидемии ковида, это увеличило смертность в 2021; а в 2022 ковид уже почти закончился. Так что, чтобы посчитать военную избыточную смертность, сравнивать с 2021 нет смысла.
б) Можно взять доковидный тренд (2015-2019) и продолжить его вперед на 2022. Проблема в том, что в 2022 ковид все-таки закончился не совсем; в начале года была мощная волна омикрона. Может быть, часть избыточной смертности относится на его счет. И действительно, среди женщин кол-во смертей немного повышено относительно доковидного тренда.

Что же делать? Гениальная идея коллег из Медузы -- смотреть на ОТНОШЕНИЕ мужских смертей к женским. Оно выглядит так:

Отношение явно скакнуло вверх во всех группах до 50 лет. Считаем "избыточное отношение" и переводим его в "избыточные мужские смерти". Потом суммируем по группам. В итоге получается 24 тысячи:

Под катом -- эти же графики, но с 1990, а не с 2015, а также парочка любопытных регионов.


Monday, October 31, 2022

extra mortality in the regions of European Russia

12 ноября в 14:00 студенческое общество «Демограф» проведёт семинар на тему

"Избыточная смертность в городах и регионах европейской России во время жары 2010 года".


Изменение климата приводит к повышению частоты и интенсивности погодных аномалий, в частности, волн жары. В России наибольшее влияние на состояние здоровья населения оказала жара 2010 года в течение 27-33 недель которого потери населения в общей сложности составили 57,7 тыс. человек. Об избыточной смертности во время данной волны жары на уровне больших городов и регионов европейской России расскажет Михаил Максименко - аспирант Института демографии имени А.Г. Вишневского, младший научный сотрудник Института статистических исследований и экономики знаний.

Семинар пройдет в гибридном формате: очно (г.Москва ул. Мясницкая, д.20, аудитория 225) с онлайн-трансляцией.

Ссылка для регистрации на семинар: https://forms.gle/5dxe6mSBG9ymCufL7
Регистрация открыта до 12:00 10 ноября (тогда же будет выслана ссылка на онлайн-трансляцию). При необходимости заказа пропуска пишите координатору: Татьяна, tamaksimova_1@edu.hse.ru

Tuesday, August 9, 2022

covid in Italy

Wednesday, July 20, 2022

Mortal danger for mothers

America’s already-dreadful maternal mortality rate looks set to rise

After Roe, abortion bans will take their toll


Jul 19th 2022 | WASHINGTON, DC
The young woman’s waters broke when she was 19 weeks pregnant. The doctors told her the baby stood no chance of surviving, but that if the pregnancy continued the woman risked an infection, which might lead to sepsis and kill her. They could not perform an abortion, though. Months earlier Texas, where she lived, had passed a law banning terminations after detection of a fetal heartbeat unless there was danger “of death or a serious risk of substantial impairment of a major bodily function”. This wording worried the doctors: if they did an abortion while she still appeared healthy and the baby had a heartbeat, they could be prosecuted. They suggested she fly to Colorado instead.

So she did: booking a seat, as advised, near the toilets in case she went into labour. She reached the clinic in time and is now healthy. But things could have turned out differently, if she had not had the cash for a plane ticket, say, or if no clinic had been able to give her an appointment. “It is barbaric to put a woman in distress on a plane to another state,” says Carole Joffe, a professor at the Bixby Centre for Global Reproductive Health at the University of California, San Francisco. “It is not how you do medicine in a civilised country.”

America has the highest maternal mortality rate in the industrialised world. With the overturning of Roe v Wade, the Supreme Court ruling that abortion was a constitutional right, it is likely to rise. International comparisons are imperfect but in 2018, while in the Netherlands and Norway there were no more than three maternal deaths for every 100,000 live births, in America there were 17. Most us states that now ban abortion, or soon will, allow exceptions if a woman’s life is in danger. But abortion providers and obstetrician-gynecologists (ob-gyns) say laws tend to be so vaguely worded that they often do not know if they are breaking them.

Nisha Verma, an ob-gyn who performs abortions in Georgia, where they may soon be banned after six weeks, says such laws are not written by medical experts—and it shows. They fail to recognise that a woman can develop a condition that may not put her in immediate danger but that, without an abortion, could nonetheless kill her. Waters breaking before a fetus is viable is one such condition; cancer that necessitates chemotherapy (which may hurt the fetus) is another. The list goes on: high blood pressure, cardiomyopathy and renal disease are all conditions that can arise or worsen during pregnancy. Reports have already surfaced of women denied crucial medical care to complete a miscarriage or end an ectopic pregnancy for fear it could be construed as aiding an abortion.

Doctors should not have to weigh up whether following their training and instinct will put them in legal jeopardy. Besides the personal toll, it raises the possibility of conflicts that have no place in medicine. “The dystopia I fear is a situation in which pro-life doctors are saying, she has a 50% chance of living, while pro-choice doctors and lawyers are saying she has a 50% chance of dying,” says Ms Joffe. “And while they argue, the woman dies.”

Bans mean abortions are routinely delayed, exacerbating medical problems in pregnancy. Shelly Tien, a doctor at a Planned Parenthood clinic in Jacksonville, Florida, says that soon after Texas’s “heartbeat bill” took effect last September she saw a woman who sought an abortion at seven weeks but did not get to Florida until 21 weeks—a common scenario, she says. She expects to see many more such patients among those now “flooding into Florida” from nearby states, including Alabama (where is abortion is illegal) and Tennessee (where it soon will be).

Dr Tien warns too of a “terrible snowballing effect” when the time it takes for a woman to raise funds for an abortion, and the necessary travel, means her pregnancy progresses so far that the cost of the procedure rises. She then delays again while she raises more funds. This will worsen, Dr Tien says, as clinics become busier.

The states in which pregnant women are likely to be in greater danger are those that have long had high maternal mortality rates. Alabama, Arkansas, Kentucky, Louisiana, Mississippi and Tennessee score worst (with over 30 deaths per 100,000 live births). They have also long had restrictive abortion regulations and, following the end of Roe, have either banned abortion or plan to. There is no proven link, but it seems likely that some women have died when they needed abortions but did not get them.

Yet there are other causes, too. States with high maternal mortality rates tend to share three other features: large black populations, high levels of poverty and poor access to health care. In Mississippi, which provided the case that the Supreme Court used to overturn Roe, Medicaid is cut off 60 days after a woman gives birth, yet many problems arise after this time. Black women (who were a majority of patients in the state’s last clinic before it closed for good on July 6th) are nearly three times likelier than white women to die from pregnancy-related complications.

Another reason why America’s maternal mortality rate has long been high, say doctors, is a country-wide lack of ob-gyns. This too seems likely to worsen without Roe. If doctors fear their expertise will clash with badly written laws, putting them at risk of imprisonment, fewer people may want to specialise in the field. Those who do, in states in which abortion is illegal, may miss a crucial part of their training. Where access to health care is already poor, the harms will be particularly grievous. And so the tragedy piles up. The states with higher rates of pregnancy-related deaths are also among those in which more babies die before they turn one.

Wednesday, June 1, 2022

mortality in Buryaad Ulas

Sunday, March 27, 2022

Midlife Mortality Crisis

The US Midlife Mortality Crisis Continues: Excess Cause-Specific Mortality During 2020

Dana A Glei
American Journal of Epidemiology, https://doi.org/10.1093/aje/kwac055

This analysis investigates whether monthly excess mortality in the United States during 2020 varied by age and cause of death. Based on national-level death counts and population estimates for 1999-2020, sex-specific negative binomial regression models were used to estimate monthly cause-specific excess mortality by age group during 2020. Among males, 71% non-COVID excess deaths occurred at working ages (25-64), but those ages accounted for only 36% of non-COVID excess deaths in females. The results revealed substantial numbers of excess deaths from external causes (particularly among males), heart disease, diabetes, Alzheimer’s disease (particularly among women), and cerebrovascular disease. For males, the largest share of non-COVID excess deaths resulted from external causes, nearly 80% of which occurred at working ages. Although incorrectly classified COVID-19 deaths may explain some excess non-COVID mortality, misclassification is unlikely to explain the increase in external causes of mortality. Auxiliary analyses suggested that drug-related mortality may be driving the rise in external mortality, but drug overdoses were already increasing for a full year prior to the pandemic. The oldest Americans bore the brunt of COVID-19 mortality, but working-age Americans, particularly men, suffered substantial numbers of excess non-COVID deaths, most commonly from external causes and heart disease.

Monday, January 31, 2022

mortalite, fatalite, letalite

где собака порылась? – никак понять не могу

Какова «истинная» смертность от COVID-19? Ответа на это вопрос нет, и он вряд ли будет


На сегодня (18-1-2022) по официальным данным с начала пандемии COVID-19 в мире от него умерло около 5,6 миллиона человек. То, что реальное число смертей больше, мало у кого вызывает сомнения. Но насколько больше? В последнем номере Nature (датирован 20 января 2022) опубликована статья, озаглавленная «The efforts to count the pandemic’s global death toll” (в вольном переводу: «Усилия для подсчёта глобального числа смертей от СOVID-19»). Это не научная статья, а популярное описание научных подходов, используемых в этой области. В самый раз для меня - неспециалиста по демографии, медицинской статистики и математических моделей. Полагаю, она будет интересна и читателям моего блога.

Начну с конца. Вывод, причём не только автора-журналиста, но и профессионалов, мнение которых он цитирует - на сегодня нет достоверного способа оценить глобальное число смертей от COVID-19. И дело не только и не столько в том, что у многих стран достоверная статистика смертности отсутствует. Основная проблема связана с неопределённостями в определении «ожидаемой смертности» (того, какой бы она была бы, если бы не пандемия). Значение ожидаемой смертности предопределяет «избыточную смертность». А ведь последняя является главным «инструментом», используемым для «поправки» официальных данных о смертности от COVID-19. Казалось бы, всё ясно – избыточная смертность это разница между смертностью реальной и ожидаемой, при условии отсутствия эпидемии. Но как подсчитать ожидаемую смертность? С моей «дилетантской колокольни» это было совсем неочевидно. Вот лишь несколько вопросов, однозначного ответа на которые нет. За сколько лет усреднять? Как учитывать изменения возрастной структуры популяции и общем уровне здоровья населения? Вклад природных катаклизмов?

Для любителей простых решений замечу, что по мнению экспертов демографов, приведённому в статье, широко распространённый способ расчета ожидаемой смертности (усреднение за предшествующие пять лет) удовлетворительным считаться не может.

Необходим более «утончённый» подход, что и реализуется в различных математических моделях. Проблема в том, что таких моделей может быть «сконструировано» очень много, но какая из них даёт «правильную» оценку определить невозможно. А предсказания разных моделей отличаются, порой разительно. Для примера, на рисунке ниже представлены предсказания избыточной смертности в Японии (мало у кого в мире медицинская статистика лучше). Расчёты сделаны двумя «популярными» математическими моделями - журнала The Economist и авторитетного американского исследовательского института IHME (Institute of Health Metrics and Evaluation). Cиняя кривая – официальные данные, красные кривые – предсказания каждой из моделей, бледный тон - 95% доверительные интервалы.

Как видите предсказания моделей, даже в таком относительно «лёгком» случае как Япония, противоположны. Кстати, значимые детали этих моделей пока не опубликованы, и они корректируются в «закрытом режиме». В результате первоначальная оценка модели IHME для США из 900 тысяч превращалась в 670 тысяч. Так можно ли доверять предсказаниям этих моделей, хотя они сейчас и на слуху? На мой взгляд, нет. А ведь эти предсказания нередко преподносятся как «разоблачительные».

На этом остановлюсь. Но замечу, что статья значительно детальнее моего поста о ней. В ней ещё много интересного, включая довольно неожиданный для меня подход – подсчёт могил на кладбищах крупных городов по спутниковым снимкам. Так-что советую постом не ограничиться и ознакомится с оригиналом.

Tuesday, December 14, 2021

accuracy

Аккуратнее с рекордами смертности!


Подавляющее большинство оценок избыточной смертности, вызванной пандемией COVID-19, базируются на сравнении наблюдаемого уровня смертности (или ожидаемой продолжительности жизни) в 2020-2021 гг. с так называемыми «ожидаемыми» (или базовыми) показателями, которые, как правило, рассчитываются путем прогноза смертности на основе данных за последние несколько лет [1],[2],[3]. Реже в качестве ожидаемого уровня смертности используются усредненные показатели за несколько предшествующих лет или даже за один год (в данном случае – 2019 г.) [4].

Результаты всех этих расчетов показывают, что Россия возглавляет список экономически развитых стран, либо находится на одном из первых мест по тяжести людских потерь, вызванных пандемией COVID-19. Это – очень серьезный вызов, говорящий в пользу необходимости решительных и последовательных мер в области вакцинации, масочного режима и других немедицинских и медицинских мероприятий.

Однако, этих выверенных результатов оказалось мало автору статьи «Смертность в России за последний год стала рекордной со времен войны» [5] Александру Соколову, который (по его утверждению) ссылается также на демографов А. Ракшу, А. Синельникова, и А. Иванову. Вместо того, чтобы опереться на научные публикации в международных рецензируемых журналах, А. Соколов наивным образом сравнивает нынешний уровень смертности и понесенные потери с далеким прошлым, доходя до 1945 (!) года. Конечно, очень соблазнительно выглядит возможность постулировать, что нынешний прирост смертности в России сопоставим аж с потерями в послевоенные годы. Подумать только – сейчас хуже, чем во времена послевоенной разрухи, постоянного недоедания, жизни в бараках и перенаселенных коммуналках, все еще низкого уровня образования и т.д. и т.п. Оказывается, что в течение 75 лет, прошедших с окончания войны, не было отмечено ни одного случая повышения смертности, которое было бы больше того, которое произошло в 2020-2021 гг.

Действительно ли это так? Ну конечно, нет! Есть только одна научная правда и ее может легко понять любой человек, мало-мальски знакомый с основами демографии. Для начала сделаем сравнение таблиц смертности 2019 и 2020 гг. с таблицами смертности 1946 и 1947 гг. [6] В 2019 и 2020 гг. ожидаемая продолжительность жизни (ОПЖ) в России составила 68,2 и 66,5 лет у мужчин и 78,1 и 76,4 лет у женщин. Мы видим, очень большую (по нынешним меркам) потерю ОПЖ – 1,7-1,8 года. Посмотрим теперь на продолжительность жизни в 1946 и голодном 1947 годах – 46,6 и 55,3 лет у мужчин и женщин в 1946 году и 39,9 и 49,8 лет в 1947 году. Падение составило 6,7 и 5,5 лет у мужчин и женщин соответственно. Таким образом, показатель ожидаемой продолжительности жизни, который считается эталонным в демографии для оценки уровня и тенденций изменения смертности, показывает намного большее падение ОПЖ между 1946 и 1947 гг., чем между 2019 и 2020 гг.

Что же тогда говорит и показывает на своем графике корреспондент «Ведомостей» Соколов, и почему его график так радикально отличается от того, что показывают данные таблиц смертности? Судя по графику, озаглавленному «Смертность и убыль населения в России худшие со времен войны», падение коэффициента смертности между 2019 и 2020 гг. было максимальным после 1945 года. В чем здесь ошибка?

Дело в том, что А. Соколов использовал для сравнения уровня смертности между концом 1940-х и началом 2020-х годов совершенно непригодный для этого показатель – общий (или грубый) коэффициент смертности. На этот легко доступный статистический индикатор оказывают влияние два фактора, действующие в противоположных направлениях, – снижение смертности и старение населения. Именно по причине действия этих двух взаимно уравновешивающих сил, на графике в «Ведомостях» общие коэффициенты смертности в 1946-1947 гг. и 2019-2020 гг. находятся примерно на одном уровне. На самом деле, риск смерти в конце 1940-х был несопоставимо выше, чем в 2019 и даже в 2020 гг. При этом, значения общих коэффициентов смертности были сопоставимы в эти два периода потому и только потому, что возрастной состав населения в 1940-х был радикально моложе, чем в 2010-х гг. Простой расчет показывает, что если бы возрастные коэффициенты смертности в 2020 году были такими же, как в 1946 году, то общий коэффициент смертности в 2020 году составил бы 22,8‰, а не реально наблюдавшееся значение в 14,6‰, а если бы в 2020 году возрастной состав населения был таким же, как в 1946 году, то общий коэффициент смертности составил бы 5,0‰ вместо все тех же 14,6‰.

Наши элементарные расчеты доказывают, что различия в возрастной структуре послевоенной и современной России, оставшиеся без внимания А. Соколова, значительно влияют на парадоксальный и многократно растиражированный результат статьи в «Ведомостях». Жаль, что профессиональные демографы, упомянутые в данной публикации, не имели возможности скорректировать основные выводы статьи, чтобы не вводить (вольно или невольно) в заблуждение уважаемого читателя.

Коллектив Международной лаборатории исследований населения и здоровья НИУ «Высшая школа экономики»
(Владимир Школьников, Евгений Андреев, Дмитрий Жданов и Сергей Тимонин).

[1] Islam N, Jdanov D A, Shkolnikov V M, Khunti K, Kawachi I, White M et al. Effects of covid-19 pandemic on life expectancy and premature mortality in 2020: time series analysis in 37 countries BMJ 2021; 375 :e066768 doi:10.1136/bmj-2021-066768
[2] Islam N, Shkolnikov V M, Acosta R J, Klimkin I, Kawachi I, Irizarry R A et al. Excess deaths associated with covid-19 pandemic in 2020: age and sex disaggregated time series analysis in 29 high income countries BMJ 2021; 373 :n1137 doi:10.1136/bmj.n1137
[3] Timonin S, Klimkin I, Shkolnikov V, Andreev E, McKee M, Leon D. Excess mortality in Russia and its regions compared to high income countries: an analysis of monthly series of 2020 SSM-Population Health 2021 (in press)
[4] Aburto J, Scholey J, Kashnitsky I, Zhang L, Rahal C, Missov T, Mills M, Dowd J, Kashyap R. Quantifying impacts of the COVID-19 pandemic through life-expectancy losses: a population-level study of 29 countries, International Journal of Epidemiology, 2021;, dyab207, https://doi.org/10.1093/ije/dyab207
[5] https://www.vedomosti.ru/society/articles/2021/11/29/898151-umershih-antirekord
[6] Е.М. Андреев, Л.Е. Дарский, Т.Л. Харькова. Демографическая история России: 1927-1959. Москва “Информатика" 1998. 187 с., 25 иллюстраций

Friday, November 19, 2021

Millions of helpline calls reveal how COVID affected mental health

Data from almost 20 countries suggest that many callers were anxious and lonely rather than experiencing abuse or suicidal impulses.

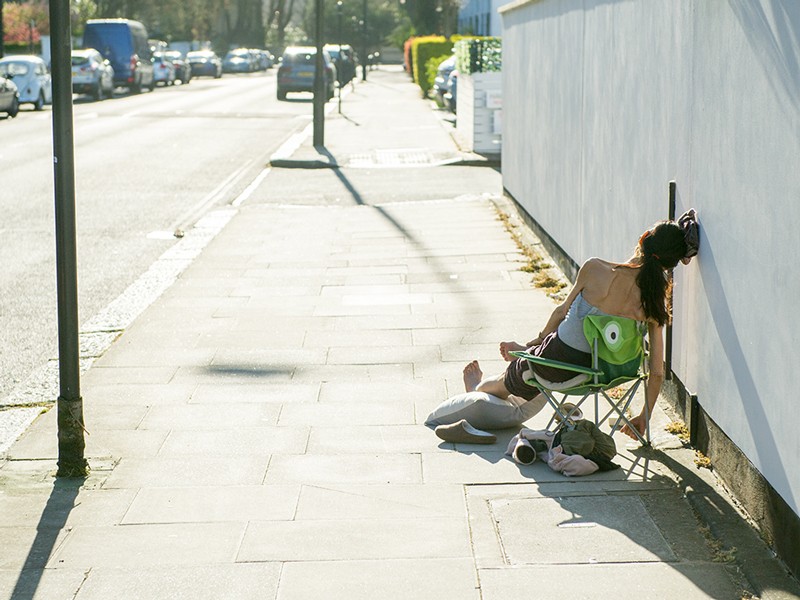
The COVID-19 lockdowns of 2020 created public space for sunbathing but have been linked to a rise in helpline calls in some countries.

A sweeping study of 8 million calls to helplines in 19 countries and regions found that call volumes jumped during the first wave of coronavirus infections. Loneliness and concerns about the pandemic drove most of the callers, rather than imminent threats such as suicidal thoughts or abuse.

The analysis, published on 17 November by Nature1, is one of the largest to address mental-health challenges during the pandemic. The authors report that calls to helplines increased over the first six weeks of the initial wave of coronavirus infections. At the six-week peak, the total number of calls was 35% higher than before the pandemic.

“The increase in calls was mainly driven by additional people ringing because they wanted someone to talk to about this pandemic,” says Marius Brülhart, an economist at the University of Lausanne in Switzerland and a co-author of the paper. “There was no sign of an explosion in calls due to domestic violence or suicide.”

Furthermore, the team found that in France and Germany, suicide-related calls to helplines increased when lockdowns became more stringent, but decreased with the arrival of financial support from the government, such as payments for furloughed workers and struggling businesses.

The project was forged in the early days of the pandemic in 2020, when Brülhart and a colleague were looking for a way to monitor the impact of the pandemic and resulting lockdowns on mental health. Most large-scale mental-health analyses draw on electronic health records and data about mental-health outcomes such as suicides. But such reports tend to be slow. “Usually, the time lag is not a big deal,” says Brülhart. “But in a pandemic, you’d like to know what’s happening today.”

So the team turned to crisis helplines, collecting data from 19 countries and regions including the United States, China, Lebanon and 14 European countries. The data included the reasons for the calls, but not the demographics of the callers. Also, initial data on the volume of calls could have been affected by problems with staffing, Brülhart says, because many helplines reported being overwhelmed both by the volume of calls and as a result of staff shortages.

A lesson for future pandemics


Despite fears that the pandemic would cause a surge in mental-health crises including suicides and addiction, and in intimate-partner abuse, Brülhart and his collaborators did not find signs of this in their data. That does not invalidate the suffering of some individuals, or anecdotal or regional studies that might have found different results, Brülhart says — it just means that the trend did not emerge from the large-scale helpline data his team collected.

The results of the study are correlative rather than causative, meaning that the researchers cannot tell if the financial assistance was the cause of the drop in suicide-related calls in France and Germany. But it is a signal worth following up on, says Munmun De Choudhury, a computer scientist at Georgia Institute of Technology in Atlanta who works on digital mental health.

Mental health “is an ecological experience,” she says. “There are things that happen in our environment and communities that impact us, and financial aspects are a very important part of it.”

Overall, the approach provides an exciting way to track mental health changes as they occur, says Cindy Liu, a clinical psychologist at Brigham and Women’s Hospital in Boston, Massachusetts, and the author of a commentary published with the paper. “We don’t really have a great way of monitoring mental health,” she says. “And I think sometimes mental health gets the shaft as a result. People don’t know if the policies are really making a difference.”

doi: https://doi.org/10.1038/d41586-021-03454-x


If you or someone you know is experiencing a mental-health crisis, please reach out. You can find assistance through a helpline: https://findahelpline.com/


References

1. Brülhart, M., Klotzbücher, V., Lalive, R. & Reich, S. K. Nature https://doi.org/10.1038/s41586-021-04099-6 (2021).

Friday, August 13, 2021

covid mortality in Russia

Смертность в Москве выросла на 60% в июле после новой волны Covid-19


В июле 2021 года в Москве было зарегистрировано на 60% больше смертей, чем в июле 2020 года, следует из данных городского департамента здравоохранения. Рост смертности, по оценкам властей, обусловлен резким скачком заболеваемости коронавирусом в июне.

За минувший июль в Москве зарегистрировали 17 237 смертей - это на 6 464 случая больше, чем за аналогичный период прошлого года (10 773), и на 7 180 случаев больше, чем в июле 2019 года (10 057).

Таким образом, по отношению к июлю 2020 года рост смертей в столице составил 60%, а по отношению к допандемийному июлю 2019 года - 71%.

В июне в Москве было зарегистрировано на 24% больше смертей, чем в том же месяце 2020 года, и на 75% больше, чем в июне допандемийного 2019 года, сообщал депздрав.

Как уточняется в сообщении депздрава, коронавирус в июле этого года был отмечен в качестве основной или сопутствующей причины смерти в 6 583 случаях (основная причина - 6 145 случаев, сопутствующая причина - 438 случаев, существенное влияние на развитие другого заболевания - 193 случая).

Рост смертности после роста заболеваемости


Рост смертности, по оценкам департамента, обусловлен резким скачком заболеваемости коронавирусом в июне (в связи с распространением нового штамма), а также аномально жаркой погодой в последние месяцы.

"Показатели смертности отстают на несколько недель от пиков заболеваемости коронавирусом. А рекордные значения числа заболевших были зафиксированы в июне 2021 года, когда ежесуточное число новых случаев достигло рекордных 9 тысяч", - напомнил департамент.

В первый летний месяц заболеваемость коронавирусом в России и, в частности, в Москве вернулась к значениям января-декабря, когда был зафиксирован предыдущий пик пандемии. 19 июня, как сообщал оперативный штаб по борьбе с коронавирусом, в Москве было зарегистрировано рекордное число заражений с начала пандемии - 9 120.

В июле официальные данные о заболеваемости Covid-19 начали демонстрировать снижение. 25 июля впервые с 6 июня число новых случаев заражений в столице оказалось ниже 3 тысяч. В августе это тенденция продолжилась, что позволо московским властям объявить о смягчении коронавирусных ограничений.

10 августа в Москве выявили 1 639 новых случаев Covid-19 - минимум с конца апреля. После этого суточный прирост три дня подряд снова превышал 2 тысячи и в пятницу составил 2 529 заражений. В России за последние сутки зарегистрировали 22 277 новых случаев заражения - максимум за пять дней.

Высокая суточная смертность в России


Число смертей с Covid-19 продолжает оставиться на рекордном уровне. В пятницу суточная смертность пациентов с коронавирусом в России обновила максимум за время пандемии - 815 летальных исходов после 808 накануне. Второй день подряд и впервые за весь период этот показатель оказался выше отметки 800.

Данные по смертности от коронавируса, которые приводит оперативный штаб, примерно вдвое ниже данных Росстата.

При этом вклад Москвы и Петербурга в суточную ковидную смертность в последние недели заметно снизился.

Если в конце июня и начале июля в крупнейших российских городах от Covid-19 умирали более 100 человек в день, то за минувшие сутки эти показатели составили 59 и 42 соответственно (накануне - 56 и 48). В Краснодарском крае за сутки умерли 33 пациента, в Иркутской, Ростовской и Свердловской областях, а также в Пермском крае - по 28 человек.

Данных о смертности в июле по России пока нет. Неделю назад Росстат отчитался об июньских показателях: в июне в стране умерли 185 655 человек, в том числе 27 108 пациентов с Covid-19. Основной причиной смерти, по данным Росстата, коронавирус стал в 19 998 случаях, что на 52,8% выше, чем в мае.

Что касается июньской жары в Москве, то она, как завили в департаменте здравоохранения, "негативно влияла на тяжесть течения заболевания коронавирусом, его последствия, и привела к обострению в первую очередь заболеваний сердечно-сосудистой системы".

"Врачи-кардиологи отмечают, что потеря жидкости в организме и увеличение вязкости крови вследствие жары могут приводить к резкому повышению риска тромбообразования, падению давления и инсульту", - говорится в сообщении департамента.

Friday, April 30, 2021

mortality grows

Смертность в России в марте увеличилась более чем на четверть


Ведомости

В марте 2021 г. в России умерло 191 320 человек, свидетельствуют данные Росстата [то-есть, таки не смертность, а число умерших]. Это на 25,3% больше показателя марта прошлого года — тогда в России по официальным данным умерло 152 740 человек.

COVID-19 в марте стал основной причиной смерти у 15 003 человек, предполагаемой, но не подтвержденной причиной смерти COVID-19 стал у 2454 человек. Еще у 1401 человека коронавирус повлиял на развитие других заболеваний и способствовал появлению осложнений, что ускорило их смерть. COVID-19, не повлиявший на наступление смерти, но оказавшийся сопутствующим заболеванием, был выявлен у 4857 человек, говорится в данных Росстата. Таким образом, число россиян, у которых в момент смерти был коронавирус, составило 23 715, что на 4,3% меньше, чем в феврале 2021 г.

В марте число новорожденных увеличилось на 15,5% в годовом выражении и составило 128 217 человек, младенческая смертность за указанный период снизилась на 3% и составила 566 детей.

Таким образом, естественная убыль населения в России в марте составила 63 103 человека, в марте прошлого года убыль составила 41 719 человек.

Росстат также зафиксировал увеличение количества зарегистрированных браков на 25% в годовом выражении. В марте было официально зарегистрировано 62 088 браков. При этом число разводов также увеличилось на 29,6% и составило 57 393 случая расторжения браков.

Saturday, January 9, 2021

excess female child mortality

Published on N-IUSSP.ORG November 5, 2018

Counting excess under-5 female mortality in Indian districts


Christophe Z. Guilmoto, Nandita Saikia


Excess female mortality resulting from gender discrimination in the postnatal period was still common in India at the beginning of the century. Yet, little attention has been paid so far to its distinctive spatial patterns, that point to the presence of a large territory in north central India where high fertility, relative underdevelopment and staunch son preference combine to give rise to high levels of excess female mortality among girls below five. Christophe Z. Guilmoto and Nandita Saikia fill this gap.

The literature on “missing women” in Asia tends to focus on the female deficit due to prenatal sex selection and underplays the role of postnatal sex selection. One reason is that there is a sort of fascination with the idea that modern technologies can be used to implement ancient patriarchal forms of bias against girls and women.

Another reason is more technical. It is easy to evidence skewed sex ratios at birth with basic birth data, whereas signs of postnatal discrimination are far more blurred, at least ever since deliberate selective infanticide has disappeared from China and India. This is primarily due to the absence in many countries of reliable civil registration data that would otherwise allow for easy computation of mortality rates by age and sex. In addition, the very concept of “excess female mortality” and the way to calculate it are still debated, since existing series demonstrate that, in “normal conditions” (i.e., without discrimination), the expected male-female mortality ratio varies greatly by age and overall mortality level.

As a result, estimates usually require the use of heavy statistical machinery and lead to a single estimate of excess female deaths for an entire country (Alkema et al. 2014; Bongaarts and Guilmoto 2015; Costa et al. 2017). However, a single number cannot adequately reflect the situation of a country as diverse as India, where history and geography have shaped very different regional gender systems.

Estimating excess under-five female mortality


This consideration led us to focus on the existing demographic datasets describing India’s 640-odd districts. Among these, an often neglected source is the decadal census, and in particular the detailed, district-level fertility tables of its 2011 edition, which detail the number of newborns by sex and mother’s age (Fertility Series data F1, F5 and F9; Guilmoto et at 2018). We decided to test the strength of the classical Brass method, in which the proportion of surviving children by mother’s age can be used for estimating past infant and child mortality, taking into account age at childbearing, which varies by district. Under-five mortality is an ideal measure, since earlier studies have shown that most of the excess female mortality is concentrated during the first years of life, a period during which girls have a distinct biological mortality advantage over boys.

The procedures involved quite a few stages:¹ here, let us focus on the results. We found that the average level of excess mortality in girls aged 0–4 in 2000–2005 was no less than 18.5 per 1000 live births, translating into an average of 239,000 excess deaths of young girls per year. Around 22% of the overall female under-5 mortality is therefore due to gender bias. Incidentally, India narrowly missed Millennium Development Goal 4 on child mortality (about 2 units per 1000 live births). This implies that without excess female mortality, India’s Millennium Development Goal of reducing under five mortality (both sexes combined) from 125 per 1000 live births in 1990 to 42 by 2015 could have easily been achieved.

A map of gender discrimination


The situation at district level is depicted in Figure 1. What emerges, in particular, is the strong spatial patterning of excess female mortality on the Ganga River Basin in North central India. There is a large cluster of almost 60 adjacent districts in Madhya Pradesh, Uttar Pradesh, and Rajasthan where excess female mortality exceeds 30 per 1000 live births. In contrast, gender discrimination is much lower, even if not totally absent, in many states in the South and East of the country.

Beyond their unique geography around the Hindi belt, the districts where postnatal discrimination towards girls takes the heaviest toll in India tend to be rural, agricultural districts, characterized by high population density, high fertility, low social development and high son preference. On the contrary, excess female mortality weakens with increasing female education and the substantial presence of Muslim and tribal populations.

To understand the dynamics of gender bias, it is worth underlining that this map does not coincide at all with the more prosperous districts to the West of the country, from Punjab to Maharashtra, where prenatal sex selection is rife. Son preference and large families go hand in hand with excess female mortality. In contrast, the rapid fertility decline in Western India where the preference for male offspring remains pervasive has been accompanied by a skewed sex ratio at birth visible since the 1990s.

Conclusions


Excess female mortality resulting from gender discrimination in the postnatal period is a rarely studied phenomenon, and this, in our opinion, confers a special interest to our study and to Figure 1. It also reveals the distinct contours of the old discriminatory gender regime, characterized by high fertility and strong discrimination towards young girls. As the regional estimates of excess deaths of girls demonstrate, any intervention to reduce the discrimination against girls in food and health care allocation should therefore target in priority the regions of Bihar and Uttar Pradesh where poverty, low social development, and patriarchal institutions persist and investment in girls is limited.

The transition from postnatal to prenatal sex selection across districts is likely to extend soon to the large states of North India featuring on our map, where fertility is currently declining rapidly and economic progress is reaching even remote rural districts. This does not bode well for the future of the sex ratio at birth in India, and reinforces the need to address directly the issue of gender discrimination in addition to encouraging social and economic development that benefits Indian women.

References

  • Alkema L, Chao F, You D, Pedersen J, Sawyer CC. (2014) National, regional, and global sex ratios of infant, child, and under-5 mortality and identification of countries with outlying ratios: a systematic assessment. The Lancet Global Health. September 30;2(9):e521-30.
  • Bongaarts J, Guilmoto CZ. (2015) How many more missing women? Excess female mortality and prenatal sex selection, 1970–2050. Population and Development Review. June 1;41(2):241-69.
  • Costa JC, da Silva IC, Victora CG. (2017) Gender bias in under-five mortality in low/middle-income countries. BMJ Global Health. July 1;2(2):e000350.
  • Guilmoto CZ, Saikia N, Tamrakar V, Bora J (2018). Excess under-5 female mortality across India: a spatial analysis using 2011 census data. Lancet Global Health.

Foot notes


¹ We first obtained a series of under-five mortality rates by sex and district. We then used a set of existing life-tables drawn from countries with no gender bias to model the relationship between the sex ratio of under-five mortality and overall child mortality. Finally, we applied these standardized mortality sex ratios to our mortality estimates to derive excess under-5 female mortality for each district of India, and then converted this information into absolute numbers of excess female deaths. For more details, see Guilmoto et al. (2018).

Friday, December 25, 2020

Wednesday, December 16, 2020

excess mortality in Russia

Смертность в России на фоне пандемии стала рекордной за десять лет

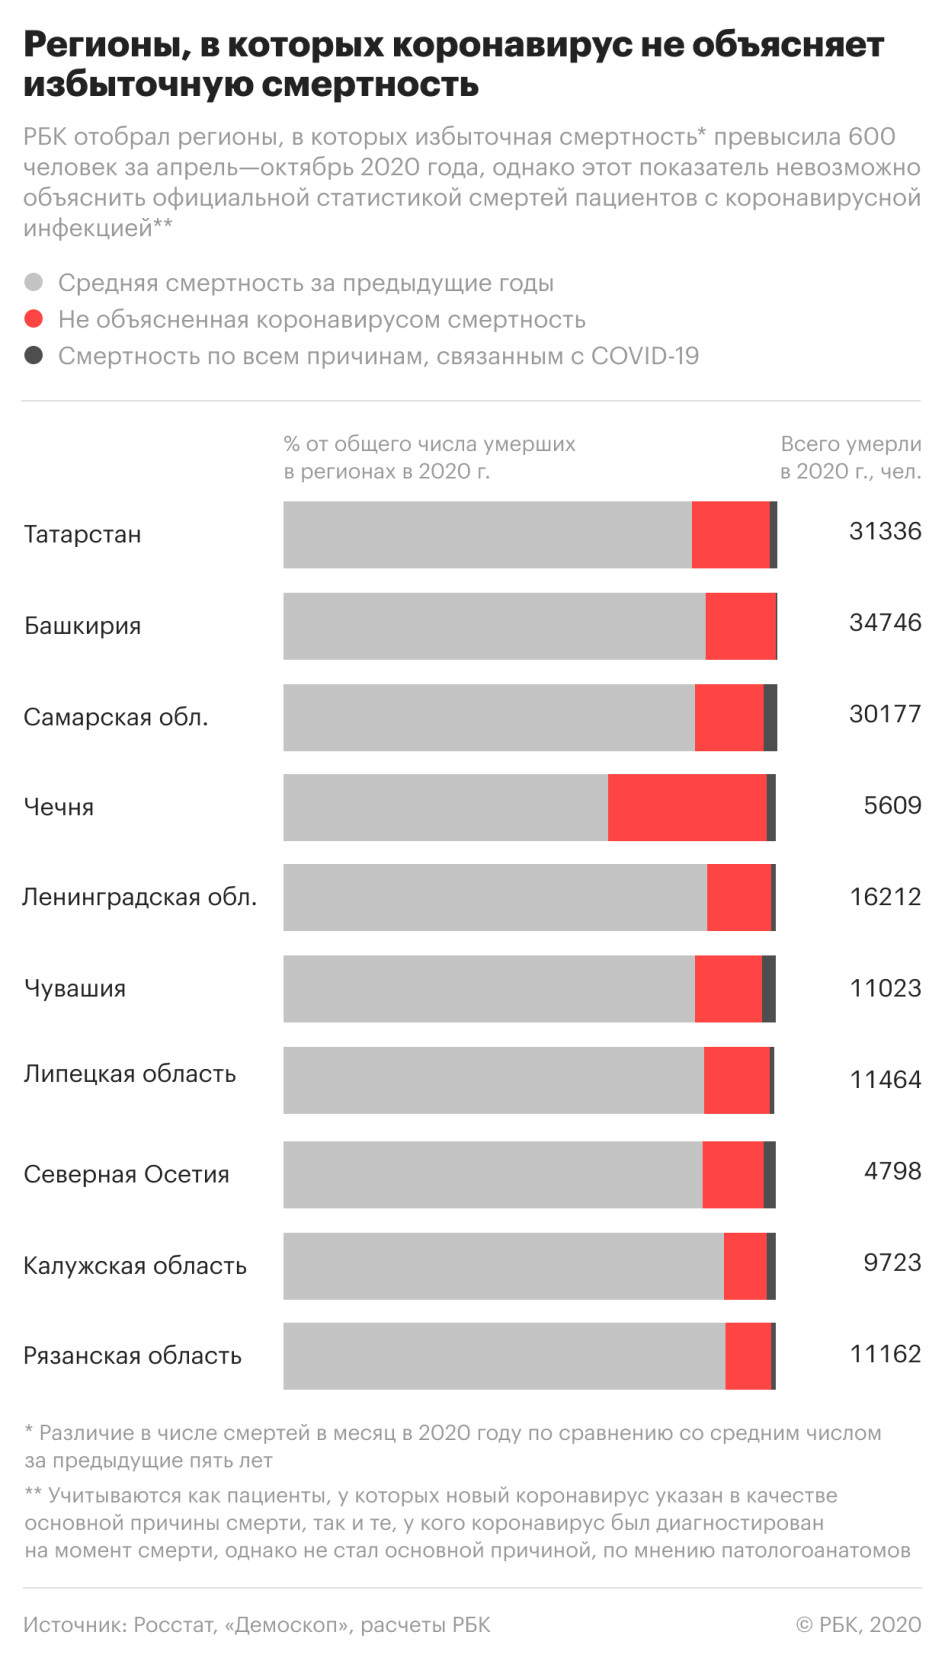
Уровень смертности в России по итогам января—октября 2020 года стал максимальным за десять лет, следует из расчетов РБК на основе данных Росстата. Рост не объясняется только прямыми потерями от COVID-19


Уровень смертности в России за январь—октябрь 2020 года достиг максимального значения за последние десять лет, следует из соотношения количества умерших на 10 тыс. живущих за соответствующие периоды 2011–2020 годов (расчеты РБК произведены на основе данных Росстата [постеснялись бы штоле]).

К 2019 году смертность в России в результате мер по улучшению демографической ситуации опустилась до 102,9 человека на 10 тыс. населения (январь—октябрь). Это на 13,7% ниже, чем за тот же период 2010 года (119,3 умерших на 10 тыс. живущих), и на 8,7% меньше, чем в январе—октябре 2011 года (112,7). Однако в 2020 году на фоне пандемии COVID-19 показатель составил 113,2 (рост более чем на 10% к 2019 году) и стал максимальным за десять лет — с 2010 года, когда смертность в России выросла на фоне аномально жаркого лета.

В региональном разрезе смертность в расчете на 10 тыс. жителей за десять месяцев 2020 года увеличилась в 82 из 85 регионов страны по сравнению с 2019 годом. В 33 из 85 субъектов показатель, как и в целом по стране, оказался наивысшим за десятилетие.
Общее количество умерших в России, по данным Росстата, за январь—октябрь 2020 года достигло 1,661 млн человек, что на 9,7% больше, чем за аналогичный период 2019 года. Последний раз до этого абсолютная смертность была выше в 2010 году (январь—октябрь) — 1,704 млн человек. На Крым и Севастополь, вошедшие в состав России в 2014 году, в текущем году приходится около 1,7% от общей смертности.

Вице-премьер Татьяна Голикова, говоря о росте смертности за десять месяцев на 9,7%, ранее отмечала, что без пандемии смертность в России существенно снижалась бы, а не повышалась. В конце года власти прогнозируют рост смертности, указывала Голикова. По ее словам, в числе факторов — традиционный рост смертности зимой [по предварительному прогнозу — зимы не было?].

Избыточная смертность призвана оценить дополнительную смертность, связанную с эффектами пандемии. В большинстве стран она превышает смертность от коронавируса.

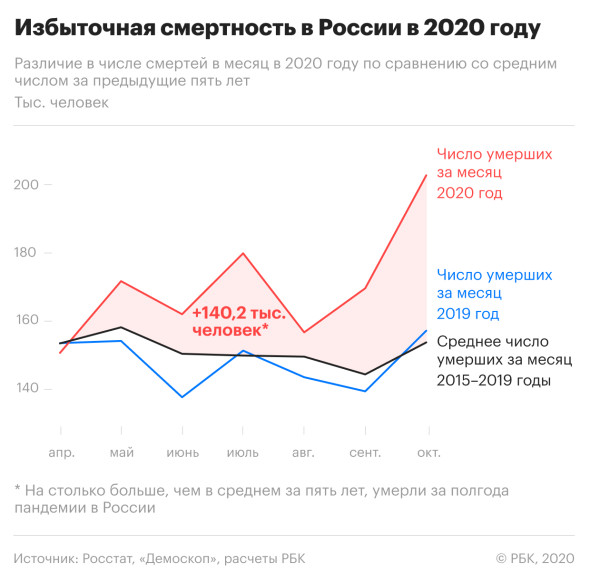
Для оценки избыточной смертности в России РБК подсчитал общую смертность с апреля по октябрь 2020 года (период с начала пандемии, когда Росстат стал вести коронавирусную статистику) и сравнил ее со средним значением смертности за пять последних лет с апреля по октябрь. Организация экономического сотрудничества и развития (ОЭСР) указывала в октябре 2020 года (.pdf), что среднюю смертность за пять предыдущих лет обычно берут в качестве рабочего показателя для оценки избыточной смертности.

За апрель—октябрь 2020 года в России, по данным госстатистики, умерли 1,2 млн человек, тогда как среднее значение смертности за аналогичный период предыдущих пяти лет составляло 1,06 млн человек. Исходя из этих данных, избыточная смертность во время пандемии 2020 года — 140,2 тыс. человек. Есть косвенные эффекты пандемии, которые могут уменьшать итоговый показатель избыточной смертности, — например, снижение дорожного трафика из-за карантинных мер приводит к сокращению смертности на дорогах: по данным МВД, число ДТП с пострадавшими в январе—сентябре 2020 года снизилось на 9,4%.
Коронавирусная инфекция за апрель—октябрь была выявлена у 78,6 тыс. умерших в стране, подсчитал Росстат [вряд ли росстат это считает]. В том числе у 46,1 тыс. человек она послужила основной причиной смерти, у остальных — выявлена в качестве сопутствующей причины (как повлиявшей на летальный исход, так и не повлиявшей). На все зарегистрированные случаи с COVID-19 приходится 6,5% от общего количества умерших в стране, или 56% от числа смертей, которые можно считать избыточными.

Из расчетов следует, что смерти примерно 62 тыс. россиян за указанный период не объясняются официальной смертностью от коронавируса. Это может быть связано как с недоучетом смертей от COVID-19, так и с косвенными эффектами пандемии — в частности, возросшей нагрузкой на систему здравоохранения, недоступностью жизненно важной медпомощи и даже психологической реакцией россиян на распространение коронавируса, пояснили РБК демографы.

Правительство никогда не скрывало данных по смертности, подчеркивала ранее Татьяна Голикова [что она имела в виду под правительством?]. «Сегодня мы можем утверждать, что не только Российская Федерация, но и весь мир, столкнувшись с новой коронавирусной инфекцией, получил и получает добавленную смертность к тем показателям, которые традиционно фиксировались в той или иной стране», — добавила она.

Как мы считали


РБК сравнивал ежемесячные показатели смертности по России в целом и в региональном разрезе с апреля по октябрь 2020 года (последние доступные данные Росстата) со средним значением смертности с апреля по октябрь в 2015–2019 годах. Выявленная положительная разница определена как избыточная смертность.

В проведенных РБК расчетах содержится предпосылка, что ряд данных по смертности в апреле—октябре с 2015 по 2020 год «стационарный», то есть существует корректное среднее арифметическое, пояснил РБК замдиректора Международной лаборатории демографии и человеческого капитала РАНХиГС Сергей Шульгин. Метод пятилетнего среднего исходит из [неверного] допущения, что численность населения и его возрастная структура не меняются со временем. Но такая оценка носит предварительный характер: по словам Шульгина, нужно учитывать и нелинейный тренд возрастной структуры смертности (то есть разные значения смертности в каждой возрастной группе населения). В частности, население России в целом «стареет»: медианный возраст (возраст жителя, выбранного таким образом, что ровно половина населения будет старше, а половина — младше) вырос с 38 лет в 2010 году до 39,6 в 2020 году, по данным ООН.

Расчет избыточной смертности с учетом возрастной структуры может получиться как выше, так и ниже оценки РБК, отметил Шульгин, добавив, что детализированные данные по структуре смертности появятся в 2021 году.

Масштаб избыточной смертности


Общая смертность в России за последнее десятилетие постепенно снижалась: если в начале 2010-х в месяц умирали в среднем 155–160 тыс. человек, то в 2019 году — 140–150 тыс. человек.

Росстат с апреля 2020 года перестал публиковать ежемесячную статистику по числу умерших по основным классам причин смерти. Из-за этого пока невозможно проанализировать, смертность от каких заболеваний, кроме коронавируса, выросла на фоне пандемии.

Росстат действительно перестал публиковать детализированную статистику по смертности в ежемесячном режиме, подтвердила РБК пресс-служба статистического ведомства, заверив, что по итогам 2020 года эта информация будет раскрыта. «В соответствии с методологией и правилами учета данных о естественном движении населения Росстат фиксирует причины смерти на основе информации, получаемой из ЕГР ЗАГС, проверяя ее с помощью окончательных медицинских свидетельств. Однако в настоящее время сроки проведения исследований, необходимых для подготовки окончательных медицинских свидетельств, удлинились. В этом случае выдача окончательных медицинских свидетельств затягивается. Отсутствие подтверждающих документов не позволяет нам раскрывать точную информацию о количестве смертей по основным классам и причинам с прежней оперативностью», — заявил официальный представитель Росстата.

В Москве рост показателей смертности в апреле—сентябре 2020 года обусловлен влиянием COVID-19, явившегося в большинстве случаев основной причиной смерти, а в других — катализатором, который оказал существенное влияние на развитие иных заболеваний (ускорил и утяжелил их течение), что в совокупности и объясняет избыточную смертность, пояснили РБК в пресс-службе департамента здравоохранения Москвы. По его данным, избыточная смертность в Москве за период с января по сентябрь составила 14,3 тыс. случаев, а COVID-19 в качестве основной и сопутствующей причины смерти за тот же период отмечен в 14,9 тыс. случаев, что обосновывает всю избыточную смертность за этот период времени. Для сравнения: по расчетам РБК, в столице в апреле—сентябре смерти с COVID-19, когда вирус стал как основной, так и сопутствующей причиной, покрывают 92% избыточной смертности.

Согласно расчетам РБК, по месяцам максимум избыточной смертности в России пришелся на октябрь (почти 47 тыс. случаев) и июль (27,8 тыс.). Больше всего умерших с диагностированным COVID-19, согласно официальной статистике, было в октябре и мае — 22,6 и 12,7 тыс. человек соответственно.

Действительно, существует зазор между общим приростом числа умерших (по сравнению со средним их числом за предыдущие годы) и той его частью, которая обусловлена COVID-19 во всех его проявлениях — как основной, так и сопутствующей причины смерти, констатировал директор Института демографии НИУ ВШЭ Анатолий Вишневский. «Это может быть следствием как недостаточно полной диагностики COVID-19, так и ростом смертности, обусловленным косвенным негативным воздействием пандемии на условия оказания медицинской помощи людям с другими заболеваниями и даже на психологическое состояние людей», — полагает он.

Идеальные данные, которые необходимо иметь для аналитической оценки избыточной смертности в 2020 году, — это вся структура смертности, детализированная по полу, возрасту и по типу населенных пунктов (город/село), данные о которой должны появиться в 2021 году, предупреждает Сергей Шульгин. Однако, по словам демографа, уже сейчас очевидно, что избыточная смертность в 2020 году будет выше числа умерших с COVID-19.

Массовое преобразование стационаров и медцентров в инфекционные больницы и ограничение оказания плановой медпомощи привели к резкому сокращению доступности медицинской помощи, по крайней мере в начале пандемии, отмечали авторы исследования «Общество и пандемия: уроки борьбы с COVID-19 в России» (.pdf).

Росздравнадзор фиксировал рост жалоб, связанных с доступностью медпомощи. Но нельзя однозначно отнести все избыточные смерти, не имеющие выявленной связи с COVID-19, к потерям, вызванным ограничениями в доступности медицинской помощи. Еще одной причиной могло стать «низкое качество регистрации случаев коронавируса», отмечали авторы монографии, а при определенном уровне распространения вируса часть пациентов могут отказываться от обращения даже за жизненно важной помощью из-за опасений заражения COVID-19 в клинике.

Рост смертности в России из-за пандемии приведет к тому, что ожидаемая продолжительность жизни при рождении по итогам текущего года снизится (рост показателя является национальной целью, обозначенной в указе президента). «Ожидаемая продолжительность жизни при рождении в России по итогам 2020 года сократится по сравнению с 2019 годом (в прошлом году она составила 73,3 года. — РБК), и возможно, что сразу на несколько лет», — констатировал Шульгин, напомнив, что до пандемии в текущем году прогнозировался рост ожидаемой продолжительности жизни.

Другие оценки избыточной смертности от COVID-19


Во многих странах мира избыточная смертность в период пандемии превысила зарегистрированную смертность от коронавируса, показывают расчеты The Economist и The New York Times.

The Economist для оценки избыточной смертности использовал собственную статистическую модель, которая показывает, какой была бы смертность в 2020 году, если бы не пандемия COVID-19.

По оценкам журнала, в США (первое место по количеству случаев заражения коронавирусом в мире) избыточная смертность составила на последнюю отчетную дату 310,6 тыс. человек, или 95 человек на 100 тыс. населения.

По Индии (второе место по количеству заражений) данные недоступны.
В Бразилии (третье место) — 149,1 тыс. человек, или 71 человек на 100 тыс. жителей.
В России (четвертое место) The Economist насчитал 131,5 тыс. избыточных смертей за период с 1 апреля по 30 сентября, или 90 человек на 100 тыс. населения.

Американская газета The New York Times для межстранового сравнения подсчитала, на сколько в процентах фактическая смертность во время пандемии превысила норму. Под нормой понимается экстраполяция на 2020 год линейного тренда смертности за предыдущие несколько лет. Самые значительные превышения нормы зафиксированы в Перу (133%), Боливии (93%) и Эквадоре (88%). Но в некоторых странах избыточной смертности не наблюдается — в частности, в Чехии, Норвегии, Дании, Германии. Одна из причин этого: указанные страны быстро вводили строгие ограничения.
РБК направил запросы в Минздрав, федеральный и столичный оперативные штабы по борьбе с распространением коронавирусной инфекции, а также в департаменты и министерства здравоохранения всех регионов, где высокая избыточная смертность не объясняется статистикой по COVID-19.

Авторы
Дада Линделл, Юлия Старостина
При участии
Иван Ткачёв, Егор Губернаторов

Подробнее на РБК:

Tuesday, November 3, 2020

Wednesday, October 28, 2020

Looking for determinants of males excess mortality

Спасибо Ilya Kashnitsky @ikashnitsky за картинку

Думал, что призыв в армию и демобилизация из армии влияют на смертность, по картинке вроде не так, скорее, окончание школы.

death rates
Смотришъ в книгу — видишь Ригу

Friday, September 18, 2020

covid related extra mortality in Belarus

Оценка уровня избыточной смертности, ассоциированной с COVID-19 в Республике Беларусь


Главное в этой статье

  • Выполнен статистический анализ многолетних месячных данных по смертности в Республике Беларусь с целью оценить уровень избыточной смертности в период пандемии COVID-19.
  • Наиболее вероятная суммарная избыточная смертность в стране в апреле-июне 2020 г. оценена в 6737 человек, что значительно превышает ранее опубликованную оценку в 5500 человек.
  • Наиболее вероятный удельный прирост смертности в апреле-июне 2020 г. оценен в 23%. В пересчете на 100 тыс. населения смертность за этот период времени возросла на 71 человека.
  • Полученные оценки избыточной смертности в Беларуси сравнимы с таковыми в странах, существенно пострадавших от пандемии COVID-19.

наиболее вероятный удельный прирост смертности в Беларуси в апреле, мае и июне 2020 г. составил 9.9%, 18.5% и 42.9% соответственно. В целом же за три месяца точечная оценка удельного прироста смертности оказалась равной 23.1%. При этом истинное значение показателя с вероятностью 95% находилось в пределах от 13% до 35%. Данные оценки доверительных границ ставят Беларусь по негативному воздействию COVID-19 в один ряд с такими европейскими странами, как Франция, Швеция и Италия, где удельный прирост смертности за 11 недель пандемии составил 20%, 28% и 35% соответственно.

вылечит всехъ


Friday, June 5, 2020

Sex hormones signal why virus hits men harder

prostate pr
DATA: MONTOPOLI ET AL., ANNALS OF ONCOLOGY,
HTTPS://DOI.ORG/10.1016/J.ANNONC.2020.04.479 (2020)
In January, one of the first publications on those sickened by the novel coronavirus in Wuhan, China, reported that three out of every four hospitalized patients were male. Data from around the world have since confirmed that men face a greater risk of severe illness and death from COVID-19 than women, and that children are largely spared. Now, scientists investigating how the virus does its deadly work have zeroed in on a possible reason: Androgens—male hormones such as testosterone—appear to boost the virus' ability to get inside cells.

A constellation of emerging data supports this idea, including COVID-19 outcomes in men with prostate cancer and lab studies of how androgens regulate key genes. And preliminary observations from Spain suggest that a disproportionate number of men with male pattern baldness—which is linked to a powerful androgen—end up in hospitals with COVID-19. Researchers are rushing to test already approved drugs that block androgens' effects, deploying them early in infection in hopes of slowing the virus and buying time for the immune system to beat it back.

“Everybody is chasing a link between androgens … and the outcome of COVID-19,” says Howard Soule, executive vice president at the Prostate Cancer Foundation, who on 13 May ran a Zoom call presenting the newest research that drew 600 scientists and physicians. A second call scheduled for 3 June will discuss incipient clinical trials.

Epidemiological data from around the world have confirmed the early reports of male vulnerability. In Lombardy in Italy, for example, men comprised 82% of 1591 patients admitted to intensive care units (ICUs) from 20 February to 18 March, according to a JAMA paper. And male mortality exceeded that of women in every adult age group in another JAMA study of 5700 New York City patients hospitalized with COVID-19.

Now, researchers are on the trail of a mechanism for this male bias—an effort led by prostate cancer researchers, who have a deep acquaintance with androgens. Christina Jamieson of the University of California (UC), San Diego, who has developed organoids to study prostate cancer, recalls that she was in a Zoom meeting honing ideas on how to link her research to COVID-19 when her sister, also a UC San Diego scientist, sent her a one-word text. It read: “TMPRSS2.”

It was 16 April, and within minutes Jamieson had found the publication that prompted the text: a Cell paper by Markus Hoffmann of the Leibniz Institute for Primate Research and colleagues. The paper sent a lightning bolt through the prostate research community because it showed that infection with SARS-CoV-2, the virus that causes COVID-19, relies in part on TMPRSS2, a membrane-bound enzyme. The enzyme cleaves the “spike” protein on the coronavirus' surface, allowing the virus to fuse with the host cell's membrane and get inside the cell.

Jamieson and other prostate cancer researchers were familiar with the enzyme because in about half of all prostate cancers, a TMPRSS2 mutation revs up an oncogene that kicks cell growth into overdrive. In the prostate, TMPRSS2 is produced when male hormones bind to the androgen receptor. “Doing research, it's like you're trying to throw an anchor into the vast ocean of possibilities,” Jamieson says. The discovery that TMPRSS2 helps the virus enter cells “felt like the anchor hit ground.”

Researchers haven't established that androgens control TMPRSS2 in the lung—ground zero for SARS-CoV-2 infection—as they do in the prostate; studies in lung tissue and cells from mice and humans come to conflicting conclusions. But after the Cell paper was published, Andrea Alimonti, head of molecular oncology at Università Della Svizzera Italiana, strengthened the androgen link by looking at data on more than 42,000 men with prostate cancer in Veneto in Italy. He and colleagues found that patients on androgen-deprivation therapy (ADT)—drugs that slash levels of testosterone—were only one-quarter as likely to contract COVID-19 as men with prostate cancer not on ADT, they reported in the Annals of Oncology (see table, above). Men on ADT were also less likely to be hospitalized and to die, although numbers were small.

Another retrospective study, still unpublished, controlled for age and other medical conditions and got similar results: Of 58 patients with prostate cancer who contracted the coronavirus, the 22 taking ADT were significantly less likely to be hospitalized and to need supplemental oxygen, says William Oh, a prostate cancer physician-scientist at the Icahn School of Medicine at Mount Sinai. “Our conclusion supports the hypothesis that androgen signaling might increase the risk of severe outcomes from COVID-19 and that androgen deprivation may limit those severe outcomes,” Oh says.

Two small studies have reported that men with male pattern baldness are overrepresented among hospitalized COVID-19 patients. This type of baldness is associated with high levels of dihydrotestosterone (DHT), a key metabolite of testosterone, in the scalp. An April study of 41 Spanish men hospitalized for COVID-19 found that 71% had male pattern baldness; the background rate in white men is estimated at 31% to 53%. A second study published last month found that 79% of 122 men in three Madrid hospitals with COVID-19 had male pattern baldness.

More circumstantial evidence comes from stem cell biologist Faranak Fattahi, of UC San Francisco. Her team found a strong link between a measure of active androgens in the blood and the severity of COVID-19 disease in data from several hundred male patients in the UK Biobank; they did not find this effect in women.

Such evidence is already inspiring possible therapies. Matthew Rettig, an oncologist who directs prostate cancer research at UC Los Angeles, is leading a double-blind, randomized, placebo-controlled trial of the androgen-suppressing drug degarelix in 200 veterans hospitalized with COVID-19 in Los Angeles, Seattle, and New York City. Patients in the active arm will receive a single injection that virtually zeroes out testosterone levels within 3 days. That reduces expression of the TMPRSS2 gene, at least in the prostate, to almost nil. Side effects include hot flashes and breast growth and “are equivalent to surgical castration,” Rettig says.

But whereas in prostate cancer, the injections are given month after month, “This study only involves a one-time dosage. It's temporary,” Rettig says. He hopes to learn in 4 to 5 months whether the treatment helps keep patients off ventilators and reduces mortality.

Several other antiandrogen trials are in the offing in the United States and Europe. Prostate cancer researcher Catherine Marshall of Johns Hopkins University is preparing a trial of bicalutamide, an older, inexpensive androgen receptor blocker, in 20 patients hospitalized within 3 days after they tested positive for COVID-19. Her group will compare outcomes with patients who don't receive the drug. “We think that if this works it's going to work by decreasing the viral load in patients,” Marshall says. “That's why we are doing it earlier in people's course of the disease.”

Women are being included in the trial, she adds, because they have androgens, although at lower levels than men, and because estrogens have been shown to help heal acute lung injury. Bicalutamide raises estrogen levels as well as suppressing androgen activity. Marshall says of the emerging wave of trials: “All these trial ideas have been team science at its best and probably at its fastest.”

Adding to the promise of antiandrogens is lab-based evidence from Fattahi's study. Her team screened Food and Drug Administration (FDA)-approved drugs in heart cells in the lab to see which ones reduced levels of the essential SARS-CoV-2 receptor, angiotensin-converting enzyme 2 (ACE2). Key hits included finasteride and dutasteride, drugs that block the conversion of testosterone to DHT, according to a 15 May preprint. Finasteride is FDA-approved to treat male pattern baldness and dutasteride for prostate enlargement. Dutasteride also reduced ACE2 levels in healthy human lung alveolar cells.

Although researchers pursuing the androgen link caution that their hypothesis remains just that until it is borne out in lab and clinical studies, they're optimistic. “When all evidence points to the same thing it's very satisfying,” Fattahi says.

Science 05 Jun 2020:
Vol. 368, Issue 6495, pp. 1038-1039
DOI: 10.1126/science.368.6495.1038

Friday, April 3, 2020

death counts in two Italian cities

из твиттера

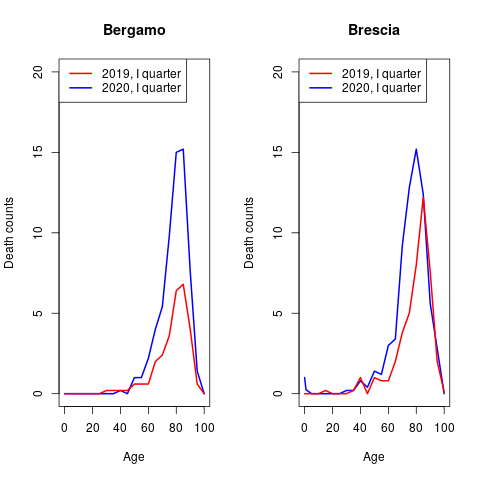
Well done. Italian National Institute of Statistics also released new data on deaths for all causes. It turns out (see graph, the age distribution of men deaths in the first quarter of 2019 and 2020 in two cities) that the rise of mortality involves young people as well.