Showing posts with label неравенство. Show all posts

Tuesday, April 16, 2024

LEX during covid pandemic


COVID-19 exacerbated inequalities in life expectancy in Den mark


Social inequalities in mortality expanded during the COVID-19 pandemic in Denmark. Cosmo Strozza, Serena Vigezzi, Julia Callaway, and José Manuel Aburto quantified life expectancy changes in 2020 and 2021 and underlying causes of death. COVID-19, as well as other causes, contributed to these changes.


The COVID-19 pandemic disrupted life expectancy trends in most high-income countries. In Denmark, while overall life expectancy returned to 2019 levels after the initial two pandemic years (2020 and 2021), this pattern was not observed across all the socioeconomic strata of the Danish population. Indeed, contrary to what many people outside the Nordic countries believe, large social inequalities in life expectancy persist in the Nordic countries (Brønnum-Hansen et al. 2021). In a recent publication (Strozza et al. 2024), using Danish registry data from 2014 to 2021 for all individuals aged 30 years and over, we investigated whether the COVID-19 pandemic magnified social inequalities in life expectancy in Denmark, and examined what causes of death contributed most to the observed changes.
 

Life expectancy changes during the COVID-19 pandemic


Life expectancy can be calculated in different years and at various ages. Table 1, for instance, shows life expectancy at 30 years at the beginning of the period and for the first two pandemic years by sex and income quartile, used as a proxy of socioeconomic status (SES).

Life expectancy is a snapshot of mortality conditions, and not a forecast of any individual’s lifespan. Therefore, its decline does not represent the number of years that will be deducted from the lifespans of individuals; rather, it provides a comparable measure of the impact of the mortality shock generated by the pandemic.

Table 1 shows yearly changes in life expectancy by sex and income quartile for the five years prior to the pandemic (2014-2019) and the initial two pandemic years (2020-2021).
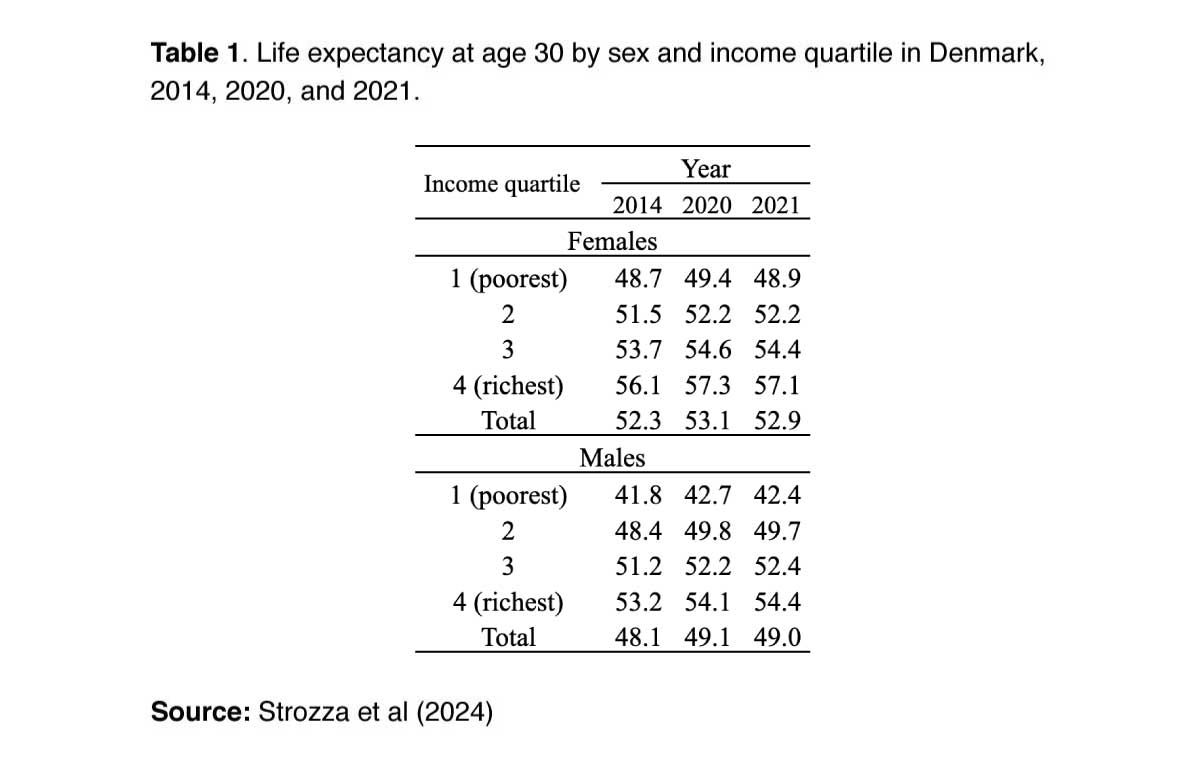
Before the pandemic, yearly female life expectancy gains followed a social gradient. In other words, life expectancy was increasing faster for women in the highest socioeconomic groups than in the lowest. However, the confidence intervals shown in Figure 1 suggest that these results should be interpreted with caution. This was the case, to some extent, for men too, with the exception of the highest income group, where survival improvements were relatively limited. However, the differences in life expectancy changes were small, and the gap in life expectancy between the highest and lowest income groups remained large.

Figure 1 illustrates the Danish COVID-19 success story of 2020, when small gains in life expectancy were observed in the overall population (Aburto et al. 2021), as well as for most sub-populations, possibly due to the timing of policy interventions. However, the situation changed in 2021, and life expectancy losses were observed for the overall population (Schöley et al. 2022) and for most sub-populations.
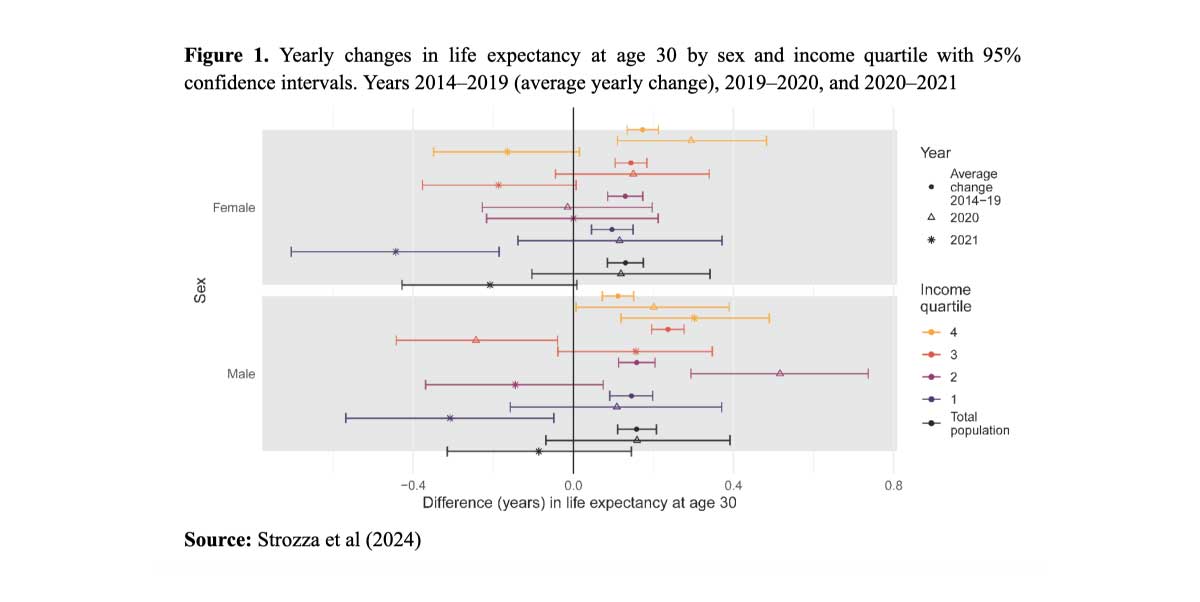
Focusing on 2021, we observe a social gradient in life expectancy changes for both men and women. Among women, all sub-populations experienced a loss in life expectancy, with those in the highest income group experiencing the smallest loss, less than two and a half months, compared to those in the lowest income group, who lost almost six months. Among men, those in the highest income groups experienced gains in life expectancy, while those in the lowest income groups experienced losses, the extent of which spanned from of almost four months gained to almost four months lost between 2020 and 2021. To summarize, inequalities in life expectancy increased across socioeconomic groups for both women and men. While the confidence intervals for the 2020 results mostly overlap, in 2021 this is the case for women but not for men, at least not when the top and the bottom quartiles are compared.

Causes of death contributing to changes in life expectancy


COVID-19 was not the only factor that contributed to changes in life expectancy over this period. Mortality from other leading causes of death changed too, illustrating socioeconomic inequalities in health caused indirectly by the pandemic.

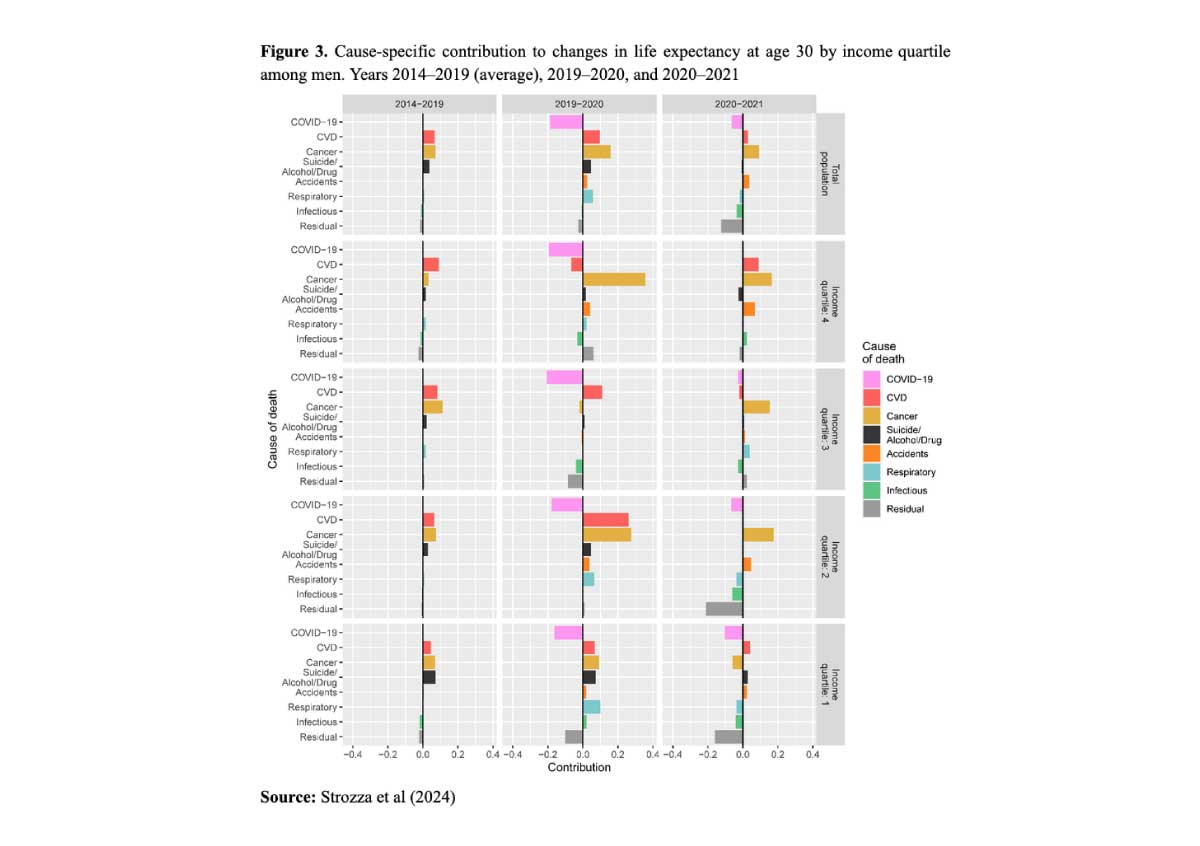
Figures 2 and 3 show cause-specific contributions to changes in life expectancy at age 30 by income quartile for women and men, respectively. Note that individual year-on-year changes include random variability, and thus require caution in their interpretation. The positive trend in 2020 was due to a decrease in cardiovascular disease and cancer mortality across income quartiles, which counterbalanced the negative contributions of COVID-19. The smaller losses among women in the highest income group in 2021 were explained by decreases in cancer mortality and a smaller negative contribution of COVID-19 and residual causes. For those in the lowest income group, cancer mortality increased slightly, contributing to small negative changes in life expectancy. Slightly higher COVID-19 mortality, together with a high contribution from residual causes and infectious diseases accounted for the rest. Analyzing changes in other causes of death, in conjunction with COVID-19 deaths, gives a more complete picture of the indirect impacts of the pandemic.
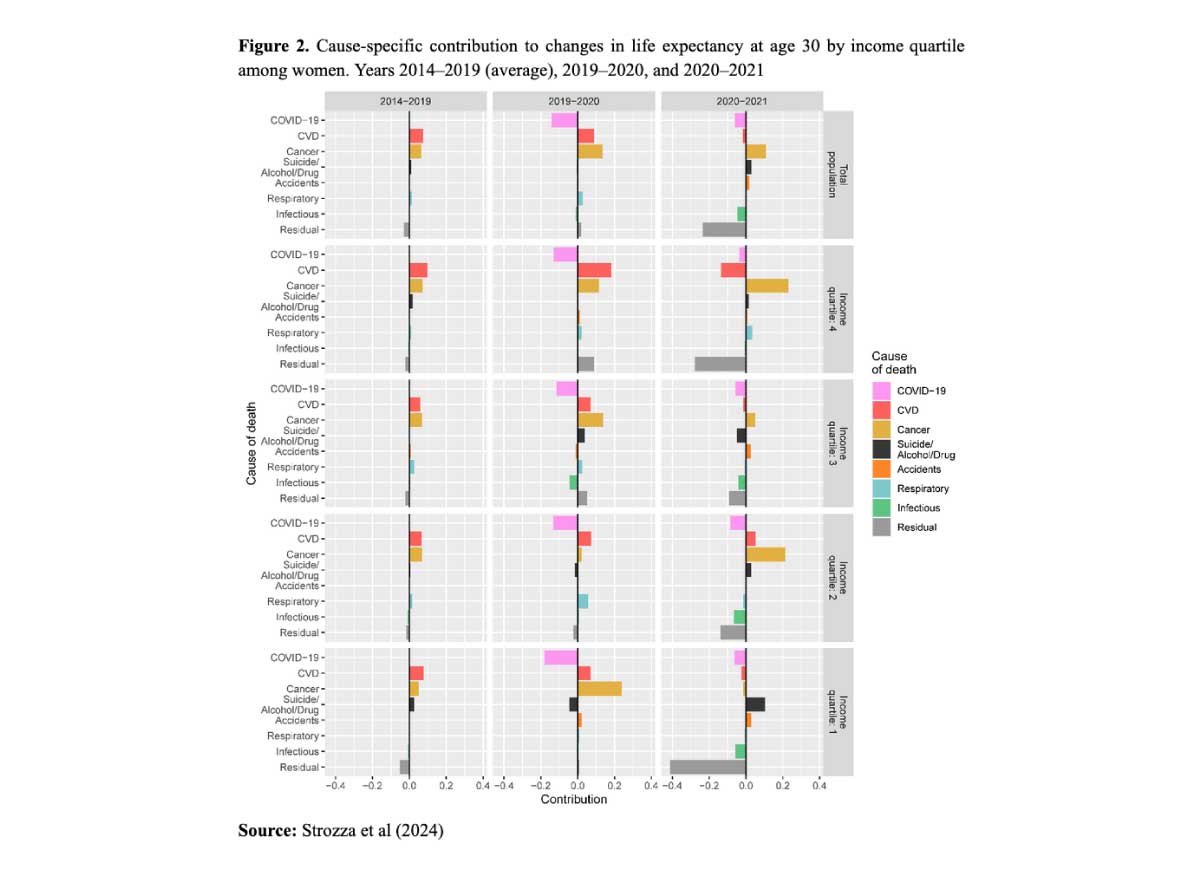
Among men, reductions in cardiovascular disease and cancer mortality also counteracted the emergence of COVID-19 in 2020, as they did for women, although other causes, such as accidents, deaths caused by suicide, drugs, or alcohol abuse, and deaths due to respiratory diseases had negative effects on changes in life expectancy in the lowest income groups. In 2021, cardiovascular disease and cancer mortality continued to decrease in high-income groups, leading to positive contributions to changes in life expectancy, while COVID-19 had practically no impact. Low-income groups, on the other hand, experienced increased mortality from COVID-19 as well as from respiratory diseases, infectious diseases, and other residual causes. For both women and men, this shows how the direct and indirect effects of COVID-19 contributed to the increasing life expectancy gap across socioeconomic groups.
 

Conclusions


Disparities in life expectancy across income groups in Denmark increased after the initial two pandemic years. The well-established mortality gaps were exacerbated by the dual impact of the pandemic, both directly through COVID-19 mortality, and indirectly through greater social inequalities in mortality from other causes of death. Our findings emphasize the critical need for more focused interventions for socially disadvantaged sub-groups during health emergencies. These interventions should not be restricted to the cause of the crisis itself, but are key to preventing a further widening of the gap between the most and least vulnerable sub-groups. Ultimately, this approach will foster a more equitable response to health crises.

References

  • Aburto JM, Schöley J, Kashnitsky I, Zhang L, Rahal C, Missov TI, et al. Quantifying impacts of the COVID-19 pandemic through life-expectancy losses: a population-level study of 29 countries. Int J Epidemiol. 2021;51(1):63-74. https://doi.org/10.1093/ije/dyab207
  • Brønnum-Hansen H, Östergren O, Tarkiainen L, Hermansen Å, Martikainen P, van der Wel KA, et al. Changes in life expectancy and lifespan variability by income quartiles in four Nordic countries: a study based on nationwide register data. BMJ Open. 2021;11(6): e048192. doi.org/10.1136/jech-2020-214108
  • Schöley J, Aburto JM, Kashnitsky I, Kniffka MS, Zhang L, Jaadla H, et al. Life expectancy changes since COVID-19. Nat Hum Behav. 2022;6(12):1649–59. doi.org/10.1038/s41562-022-01450-3
  • Strozza, C., Vigezzi, S., Callaway, J., and Aburto J.M. (2024). The impact of COVID-19 on life expectancy across socioeconomic groups in Denmark. Population Health Metrics 22, 3. doi.org/10.1186/s12963-024-00323-3

Wednesday, September 13, 2023

Childhood internal migration and the intergenerational transmission of socioeconomic inequalities

September 11, 2023 Aude Bernard

Using lifetime data for baby boomers from 15 European countries, Aude Bernard shows that (i) children from higher socioeconomic backgrounds are more likely to migrate and (ii) individuals who migrated in childhood are more likely to migrate in adulthood. Thus, poorer children are doubly disadvantaged in coming from a lower socioeconomic background and being less migratory, which limits the economic benefits of changing region of residence in adulthood and exacerbates social reproduction.


The widening of income inequalities has stimulated research on the intergenerational transmission of advantage and disadvantage. We now know that social reproduction is a multidimensional process underpinned by various mechanisms, including parental time and resource investments, parental socialisation, wealth assortative mating and neighbourhood effects. Internal migration may be an additional mechanism.

In a recent paper, I used retrospective data from the Survey of Health and Ageing in Europe (SHARE), which, at Wave 7 in 2017, collected complete migration histories from birth to age 50 in 15 European countries: Austria, Belgium, Croatia, the Czech Republic, Denmark, Estonia, France, Germany, Greece, Italy, Luxembourg, Slovenia, Spain, Sweden, and Switzerland (Bernard 2023). I defined migration as a change of NUTS-2 region (i.e., regions in France, Hungary, and Italy; provinces in Belgium; national areas in Sweden; and autonomous communities in Spain), which means that I focused on relatively long-distance internal migration and on its role in the perpetuation of socioeconomic inequalities

Migration is intergenerationally transmitted


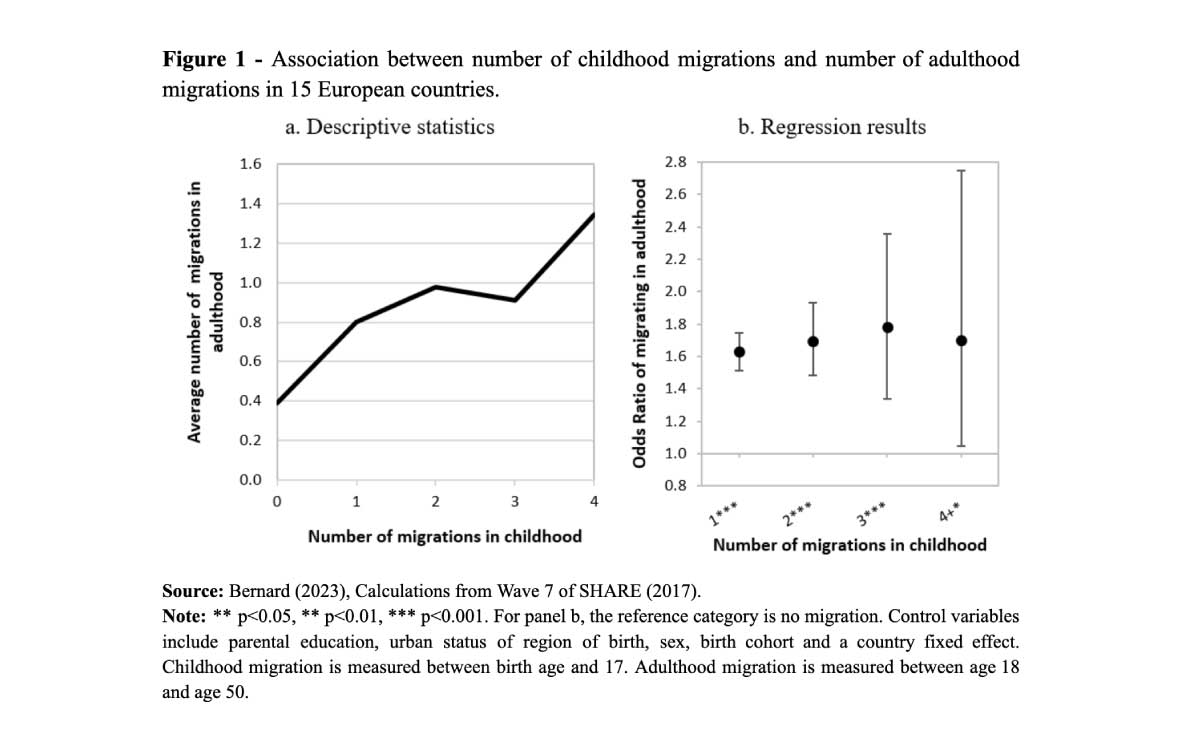
Mounting evidence indicates that migration is transmitted from parents to children (Bernard and Vidal 2020; Myers 1999): individuals who migrated in childhood and adolescence (0‒17 years) are more likely to migrate throughout adulthood (18‒50 years). By leaving and entering new social contexts, children are likely to develop social skills that they can mobilise for future migration. Panel a in Figure 1 shows a clear linear association between the number of childhood internal migrations and the number of adulthood migrations. Individuals who did not migrate in childhood report an average of 0.40 migrations in adulthood, compared with one or more migrations among individuals who migrated at least twice in childhood. This association holds when parental socioeconomic background is controlled, as in Panel b.
This finding supports the idea that internal migration is intergenerationally transmitted. More importantly, panel b shows that migrating at least once in childhood is paramount to increasing the odds of migrating in adulthood. The overlapping confidence intervals imply that the number of childhood migrations is not relevant to subsequent migration decisions in adulthood.

Migration is socioeconomically beneficial


Children who migrated in childhood are more likely to reside in large cities which provide greater educational and employment opportunities. Considering sociospatial inequalities, this means that childhood migration can promote upward social mobility without the need to migrate in adulthood. However, individuals who migrated in childhood are more likely to migrate in adulthood than stayers even if they reside in large cities (results not reported here).

This is important because internal migration in adulthood promotes upward occupational mobility (Fielding 1992; Mulder and Van Ham 2005). Panel a in Figure 2 depicts a positive linear association between the number of adulthood internal migrations and SES at age 50: individuals who migrate in adulthood multiple times are more likely to report higher SES at age 50. Regression coefficients in panel b confirm this association when controlling for possible cofounders. Migrating in adulthood promotes all three components of SES: homeownership, tertiary education and higher occupational prestige. The effect of migration on the latter two is particularly pronounced for migration to large urban centres (Results not reported here).

Migration is selective


The results so far mean that individuals exposed to internal migration early in life are more likely to migrate in adulthood and thus more likely to report a higher socioeconomic status at age 50. This finding has important implications for understanding social mobility and social reproduction. On the one hand, internal migration could be an important mechanism for individuals to achieve intergenerational upward social mobility. On the other hand, because migration likelihood increases with educational level (Wagner 1990) and because this relationship is nearly universal (Abel and Muttarak 2017), children from lower socioeconomic backgrounds are less likely to migrate than children from higher socioeconomic backgrounds.

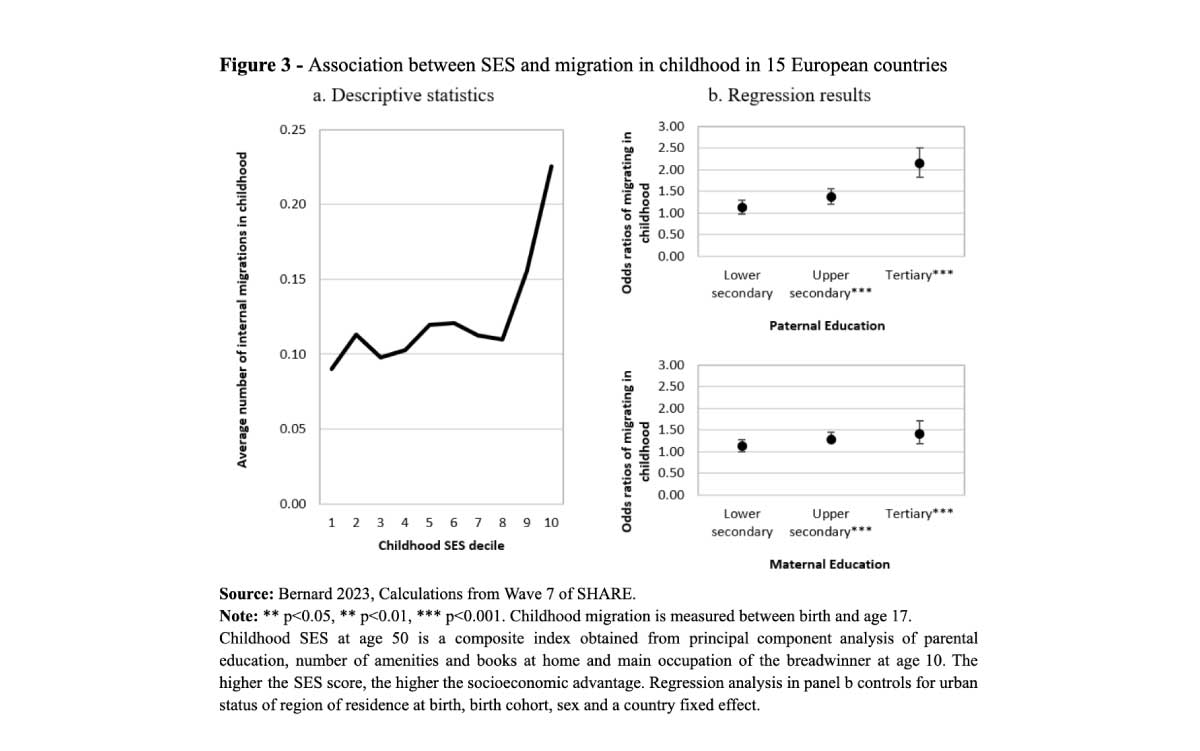
Panel a of Figure 3 shows that European children from the top two deciles report more than twice as many internal migrations, on average, as children from the lower deciles, suggesting that the propensity to migrate internally in childhood is socially determined.
This association holds when country, birth cohort and sex are controlled for in panel b: the higher the level of parental education, the greater the odds of migrating in childhood. The effect of education is gradual and holds for both paternal and maternal education.
Implications

Collectively, my results show that European children from lower socioeconomic backgrounds are doubly disadvantaged in having a disadvantaged background and being less migratory, which exacerbates social reproduction by limiting their mobility in adulthood and the economic benefits of changing region of residence.

The relevance of the processes described here for international migration deserves to be explored. Growing evidence suggests that international migration is also transmitted intergenerationally (de Jong and de Valk 2023). A continued increase in cross-country migration within Europe points to the importance of understanding its potential role in the transmission of inequalities between generations.

References

  • Abel, G. and R. Muttarak. 2017. “Who is moving? Exploring internal migration by gender and occupation across 58 countries.” in IUSSP conference. Cape Town, South Africa.
  • Bernard, A. 2023. “Does Internal Migration Contribute to the Intergenerational Transmission of Socioeconomic Inequalities? The Role of Childhood Migration.” Demography: 10826486-10826486.
  • Bernard, A. and S. Vidal. 2020. “Does moving in childhood and adolescence affect residential mobility in adulthood? An analysis of long-term individual residential trajectories in 11 European countries.” Population, Space and Place 26(1): 1-16.
  • de Jong, P.W. and H.A. de Valk. 2023. “Emigration of the Western European second generation: is having immigrant parents a predictor of international migration?” Journal of Ethnic and Migration Studies: 1-22.
  • Fielding, A.J. 1992. “Migration and social mobility: South East England as an escalator region.” Regional Studies 26(1): 1-15.
  • Mulder, C.H. and M. Van Ham. 2005. “Migration histories and occupational achievement.” Population, Space and Place 11(3): 173-186.
  • Myers, S.M. 1999. “Residential mobility as a way of life: Evidence of intergenerational similarities.”Journal of Marriage and the Family 61: 871-880.
  • Wagner, M. 1990. “Education and migration.” in Event History Analysis in the Life Course Research, edited by K.U. Mayer and N.B. Tuma. Madison: The University of Madison.

Tuesday, September 5, 2023

Gender asymmetries in mixed unions

September 4, 2023 Albert Esteve, Ewa Batyra and Annika Elwert

An increasing number of people in high-income countries marry or cohabit with partners who were born abroad. Using census microdata for Spain and the United States, Albert Esteve, Annika Elwert and Ewa Batyra examine gender differences in cross-national heterosexual couples regarding country of birth, age, and educational attainment, and find well-differentiated patterns by gender in marital interaction with the foreign population.


According to data from the 2010 round of population censuses in Spain and the United States, roughly 10 percent of young couples (aged 30–39) involve a native and a foreign-born partner. However, the macro-level characteristics of these couples have rarely been researched and to date, most studies on cross-national couples in high-income Western countries have focused on the migrant’s perspective (Qian, Glick, and Batson 2012, Kulu and Hannemann 2018). In a recently published paper, we shift attention to the natives (Esteve, Elwert and Batyra 2023). We examine differences in union patterns of native women and men in cross-national unions. In a context of profound transformation of gender norms and roles in high-income countries, we aim to stimulate research on the gender dynamics that shape interactions of native populations with foreign-born individuals in an increasingly global world (van de Putte et al. 2009, Esteve, Garcia-Roman and Permanyer 2012).

Gender differences in country of birth, age, and education


We use samples from the International Integrated Public Use Microdata Series and focus on cross-national couples formed by women and men aged 30-39. We compute the age gap between spouses and dichotomize education according to whether each partner has tertiary education or not.

Finally, we analyze gender asymmetry in cross-national couples as follows: for each country of birth of the international partner, if there are at least 50 unions of this type (otherwise we drop all observations), we calculate the share of those where the native is the man. A share of 0.5 indicates that native men and native women are equally likely to partner with immigrants from a given country. To systematize the gender patterns that might exist in relation to these unions, we classify countries based on their level in the human development index (HDI). For each dyad, we compute the HDI gap between the native country (i.e., the United States or Spain) and the country of birth of the international partner.

Figure 1 shows the relationship between gender asymmetry in cross-national couples and the HDI gap, separately for Spain and the United States. Although the origins of international partners differ across the two countries, the results for the two nations suggest a similar pattern. Cross-national couples have very distinct gender profiles, with native men and native women partnering with immigrants from countries at very different levels of development. In both countries, gender asymmetry in cross-national couples increases with the HDI gap.
This means that unions between a native and a foreigner from a less developed country (HDI gap above zero) are formed predominantly by native men, as opposed to native women. For example, see the case of the Philippines: in both Spain and the United States, more than 80 percent of mixed unions with individuals from the Philippines involve a native man and less than 20 percent a native woman. Conversely, women tend to be overrepresented in unions where a spouse is from a country with a similar or a higher level of development (HDI gap around or below zero). This pattern is clearly visible for unions of natives with immigrants from Western Europe such as Belgium, Germany, or the United Kingdom. For example, 60 percent of unions with Belgians in Spain involve Spanish women and only 40% involve Spanish men.

With reference to Spain, Figure 2 provides further evidence about gender asymmetries in cross-national unions according to age and education. Native men in cross-national unions (top panels) tend to partner with younger women (spousal age gaps > 0) and the difference tends to increase sharply with HDI gap. This pattern reverses in the case of native women (bottom panels), for whom the spousal age gap tends to decrease and become negative with an increasing HDI gap (Figure 2, left panels). Similar patterns are found for the United States (not shown here).
Despite stark asymmetries in age between spouses in cross-national couples and between unions of native women and native men, the right panels of Figure 2 show that educational profiles are rather similar across genders. There is no clear link between educational attainment of natives in cross-national unions and HDI, although in many dyads, natives tend to be have an above-average educational level. This pattern is even more visible in the United States (not shown here).

Conclusion


We find distinct cross-national marriage patterns between native men and native women. Native men who partner with immigrant women from less developed backgrounds form unions with rather traditional patterns of spousal age differences, especially when the HDI gap is large.

At the same time, some native women might be challenging this pattern by forming unions with younger men from countries with a lower development level.

References

  • Esteve A., A. Elwert, E. Batyra. 2023. Gender Asymmetries in Cross-National Couples. Population and Development Review.
  • Esteve A., J. Garcia-Roman, I. Permanyer. 2012. The Gender-Gap Reversal in Education and Its Effect on Union Formation: The End of Hypergamy? Population and Development Review 38(3): 535–546.
  • Kulu H., T. Hannemann. 2018. Mixed Marriage among Immigrants and Their Descendants in the United Kingdom: Analysis of Longitudinal Data with Missing Information. Population Studies 73(2), 1–18.
  • Qian Z., J.E. Glick, C.D. Batson. 2012. Crossing Boundaries: Nativity, Ethnicity, and Mate Selection. Demography 49(2): 651–675.
  • Van de Putte B., F. van Poppel, S. Vanassche, M. Sanchez, S. Jidkova, M. Eeckhaut, M. Oris, K. Matthijs. 2009. The Rise of Age Homogamy in 19th Century Western Europe. Journal of Marriage and Family 71(5): 1234–1253.

Tuesday, July 18, 2023

Alcaraz Halts Djokovic's Grand Slam March

As the Wimbledon final began yesterday, Novak Djokovic was on the verge of equaling three significant records: Most consecutive Wimbledon titles (five), most Wimbledon titles in total (eight) and most Grand Slams including the pre-Open era (24). Spain's 20-year-old world number one Carlos Alcaraz had lofty ambitions of his own, though, and ended up beating the Serbian 1-6, 7-6, 6-1, 3-6, 6-4 in a thrilling match at the All England Club.

That victory takes Alcaraz to a total of two Grand Slam titles and leaves Djokovic still tantalizingly close to surpassing Serena Williams as the Open Era player with the most major tournament wins. The Serb had been in blistering form this year, going into the tournament with the Australian and French Opens already under his belt. His next chance to win that coveted 24th Grand Slam? The U.S. open: A competition he last won in 2018 and whose reigning champion is none other than Carlos Alcaraz.Alcaraz Halts Djokovic's Grand Slam March

Monday, July 10, 2023

inequality in aging

Socioeconomic inequalities in functional health in Chilean older adults

July 10, 2023 Pedro Olivares-Tirado and Rosendo Zanga Pizarro

Old age is frequently marred by ill health. Socioeconomic conditions, too, play their part: the poorest also suffer from worse health conditions in Chile, as Pedro Olivares-Tirado and Rosendo Zanga Pizarro show, and arguably also elsewhere.


In the last three decades, Chile has experienced accelerated demographic ageing. In the 2017 Census, older adults (OA60+, aged 60 years and over) represented 16% of the country’s population, a share that is projected to increase to about 31% in 2050 (CELADE 2017). Population ageing raises the issue of the “quality of ageing” (Scott 2021), which may be significantly lowered by impairments in self-care, mobility, and cognitive functions affecting autonomy, independence and well-being in older persons. Different measures may be used to determine functional limitations. Regarding basic activities of daily living (BADL), six items are usually used: eating, bathing, personal mobility, toilet use, getting in/out of bed and dressing.

Socioeconomic inequalities and functional limitations


Functionality depends also on the social context in which older adults live and on their socioeconomic status, both of which affect their access to the healthcare system (Zhanget al 2019, Huang and Fu 2021).

Despite public policy improvements, Chile still has inequality in access, opportunity, quality, and financial coverage of health care, particularly among older adults (Fuentes-García et al 2013, Moreno et al. 2021). In a recent paper (Olivares-Tirado and Zanga Pizarro 2022), we examined the association between socioeconomic inequalities and functional limitations among Chilean older adults using self-reported BADL limitations and household income from the National Socioeconomic Characterization Survey-2017 (CASEN/2017).

Over 44,000 OA60+ were surveyed, 56% of them women. Most of them lived in urban areas, and had average schooling of 10.7 years for men and 9.3 years for women. The average adjusted household income was 1,638 US$ for men and 1,532 US$ for women. Furthermore, 85% of the OA60+ were covered by public health insurance, 7% by private health insurance, and the remaining were retired from the armed forces or had no insurance.

Table 1 shows the percentage of BADL limitations among OA60+, stratified by sex and severity. About 87% men and 81% of OA60+ women had no BADL limitation. Concerning each BADL, personal mobility was the daily activity that showed the most significant functional limitations in both sexes, followed by bathing and dressing. In all BADLs, women presented more severe functional limitations than men.
Figure 1 shows trends in BADL limitations of the poorest (first two deciles) and richest (last two deciles) OA60+ across age groups and by sex. An exponential increase in the frequency of BADL limitations across age groups in both sexes was observed. Women have higher prevalence (and higher severity) of BADL limitations than men in all age groups. The difference between the poorest and the wealthy decreases with advancing age.
Let us consider the case of personal mobility limitation rates, for instance (other limitations have similar patterns, not shown here). Figure 2 shows the gradient of both severity levels, by gender and income decile, from the poorest (decile I) to the richest deciles (decile X). It emerges clearly that personal mobility limitations decline as income increases, and are always higher for women.

Policy implication of socioeconomic inequalities in functional health


While everybody is more likely to experience functional limitations as they age, significant gender and socioeconomic inequalities exist among Chilean older adults. Poor people present higher values in both severity levels of BADL limitations than rich people, and women are more affected than men.

These findings highlight the need for policies and programs to combat these socioeconomic inequalities in early adulthood in order to prevent and reduce limitations in functional health later in life. This goal will require significant changes in the social infrastructure and institutions around health, education, jobs, careers, pensions, legislation and community relationships.

The implication of living longer and achieving healthy ageing will inevitably place increased responsibility on the individual. The young generation most affected by increased longevity trends will require the most significant changes and adaptations in terms of education, careers, jobs and lifestyles.

References

  • CELADE. 2017. Long term population estimates and projections 1950-2100 Chile. 2017 Revision.
  • Fuentes-García A, Sánchez H, Lera L, Cea X, Albala C. 2013. Desigualdades socioeconómicas en el proceso de discapacidad en una cohorte de adultos mayores de Santiago de Chile. Gac Sanit. 27(3): 226–232.
  • Huang F, Fu P. 2021. Intergenerational support and subjective wellbeing among oldest-old in China: the moderating role of economic status. BMC Geriatr 21, 252. https://doi.org/10.1186/s12877-021-02204-y
  • Moreno X., Lera L., Moreno F. et al. 2021. Socioeconomic inequalities in life expectancy and disability-free life expectancy among Chilean older adults: evidence from a longitudinal study. BMC Geriatr 21, 176. https://doi.org/10.1186/s12877-021-02126-9.
  • Olivares-Tirado P, Zanga Pizarro. 2022. Socioeconomic Inequalities in Functional Health in Older Adults. Journal of Population Ageing 16(3). https://doi.org/10.1007/s12062-022-09404-3
  • Scott AJ. 2021. The longevity society. Lancet Healthy Longev. 2(12): e820-e827. doi: 10.1016/S2666-7568(21)00247-6.
  • Zhang CQ, Chung PK, Zhang R, Schüz B. 2019. Socioeconomic Inequalities in Older Adults’ Health: The Roles of Neighborhood and Individual-Level Psychosocial and Behavioral Resources. Front Public Health. 7:318. doi:10.3389/fpubh.2019.00318

Monday, June 26, 2023

sexual disparities

Женщины — за накопления в рублях, мужчины — в долларах


6 из 10 россиян доверяют рублю, а 4 из 10 выбрали его лучшей валютой для хранения сбережений. В опросе сервиса по поиску высокооплачиваемой работы SuperJob приняли участие 1600 представителей экономически активного населения из всех округов страны.

6 из 10 россиян убеждены в том, что сбережения сегодня стоит хранить в рублях. Доверие к доллару и евро значительно ниже: в том, что следует перевести накопления в американскую валюту, уверены 37% опрошенных, в европейскую — 30%. Мнение об устойчивости рубля чаще всего разделяют представители старшего поколения (62%), тогда как уверенность в надежности доллара и евро больше свойственна опрошенным моложе 34 лет (44 и 39% соответственно).

По сравнению с сентябрем прошлого года, уровень доверия к рублю снизился на 5 п.п., к доллару и евро — повысился на 7 и 6 п.п. соответственно. Основная причина — рост курса американской и европейской валют по отношению к рублю в последнее время. Впрочем, если сравнивать с мартом 2022-го, то приверженцев рубля стало больше (+13 п.п.), а число убежденных в стабильности доллара и евро практически не изменилось.

Называя лучшую валюту для хранения сбережений, рублю отдают предпочтение 43% россиян, доллару — 14%, евро — только 7%. За рублевые заначки чаще голосуют женщины, за долларовые — мужчины. На фоне небольшого ослабления рубля его популярность с сентября 2022-го незначительно снизилась (минус 4 п.п.), а доллара и евро — выросла (на 3 и 4 п.п. соответственно). Позиции доллара и евро по сравнению с мартом 2022-го не изменились, а рубля — выросли (+10 п.п.).

Место проведения опроса: Россия, все округа
Населенных пунктов: 388
Время проведения: 14—23 июня 2023 года
Исследуемая совокупность: экономически активное население России старше 18 лет
Размер выборки: 1600 респондентов

Подробнее

Friday, September 17, 2021

Swiss, elderly, single, and childless. Happy?

September 16, 2021 by Malgorzata Mikucka

Around the world, more and more people age without close kin. Contrary to expectations, however, according to Małgorzata Mikucka, this does not reduce their life satisfaction, or at least not systematically and not in Switzerland.

Contemporary adults are at increasing risk of ageing without close living kin (Verdery et al, 2019). Past studies showed that old-age singlehood and childlessness are typically associated with lower life satisfaction and greater material disadvantage (Dykstra 2009). However, the question remains about what happens as age progresses.

In a recent paper, I tried to understand the nexus between family situation and life satisfaction among a sample of older Swiss, using data from the Swiss Household Panel, SHP (Mikucka, 2020). The panel started in 1999, and when I conducted my analysis, data were available up to 2017. I tested whether unmarried and childless respondents were less satisfied with their lives than married people and parents, and how these differences evolved with age.

The Swiss way to life satisfaction


In the cohort aged 60–64 years at first observation (any year between 1999 and 2007), married people were indeed more satisfied with their lives than those who were never-married, divorced, or widowed (Fig. 1). However, the differences in the older cohort (75–79 years old) were not statistically significant, except for divorced fathers who were less satisfied than married fathers. The result for the younger cohort is consistent with previous literature which documented the greater life satisfaction of married than unmarried people (Bures et al. 2009). Conversely, childlessness did not systematically correlate with life satisfaction. This lack of difference is at odds with some past studies (Albertini and Arpino 2018), but it may be explained by the cross-country variation of the consequences of childlessness.
To understand whether the differences related to family situation intensified or declined with age, I analysed within-individual changes in life satisfaction over the period 1999-2017 (Figure 2). Life satisfaction among married parents (the reference category in the analysis) declined slightly with age. This baseline rate of decline did not differ systematically with gender or education, but it was shaped by life course transitions. This suggests that, at least in Switzerland, life satisfaction trajectories are shaped by the events that people experience, rather than by their underlying characteristics.

Do inequalities cumulate as people get older?


Theoretically, two opposite mechanisms may shape the consequences of kinlessness as people progress into advanced old age. The first is the mechanism of cumulative (dis)advantage. It postulates that, due to longer exposure to (dis)advantageous conditions, the differences among groups intensify with age (Dannefer 2003). In my analysis, the group experiencing the most “advantageous conditions” were married parents, judging from their high initial life satisfaction at the age of 60–64 years. The group with lowest life satisfaction at the same age were never-married mothers.

According to the cumulative (dis)advantage hypothesis, the life satisfaction trajectories of married parents should be more positive than those of the divorced, widowed, or never married. However, my results did not conform to this pattern (Figure 2). On the contrary, the life satisfaction of some subgroups of unmarried respondents (e.g. divorced and never-married mothers) increased at a faster rate than that of the married.

Partly consistent with the hypothesis of cumulative (dis)advantage was the pattern for never-married mothers (figure 2, third panel). This group’s life satisfaction, low at the start, declined more rapidly than in other groups, past age 75. However, the support for the hypothesis was only partial because the initial life satisfaction disadvantage was observed only in the younger cohort, whereas the faster rate of life satisfaction decline occurred only among the older cohort.

Ageing as an equalizing experience?


The alternative theoretical mechanism is called “age-as-leveller” (Dupre 2007): it postulates that as age advances, health becomes the most important, if not the only, predictor of life satisfaction, and as age-related health decline affects everybody, lower life satisfaction should characterize all groups.

Qualitative inspection of the predicted results of Figure 2 suggests that the life satisfaction gap between married and previously married people has been closing for both men and women, in both younger and older cohorts. However, only a few of these changes are statistically significant (Mikucka, 2020). Moreover, the gap closes in the younger cohort only, whereas the hypothesis predicts that the levelling mechanism should play a role primarily at advanced ages.

Conclusions


Neither the cumulative (dis)advantage hypothesis, nor age-as-leveller mechanism accurately describe the effect of family situations on life satisfaction when people become old. Instead, the buffering effect of parenthood seems more relevant.

Childlessness itself makes little systematic difference for life satisfaction and its dynamics in Switzerland in the observed years. However, elderly men who became widowers experienced a greater loss of life satisfaction if they were also childless (Figure 3). Additionally, life satisfaction of childless married and divorced respondents in the older cohort declined more rapidly than that of parents (Mikucka 2020). These results suggest that parenthood may have a protective buffering effect in certain cases, e.g. among men entering widowhood, but not in general.
Never-married mothers appear to be a particularly fragile group. Single parenthood is in itself a difficult experience (e.g., Meier et al. 2016), especially in a conservative social context, like that of Switzerland.

However, the main take-home message from this research is that growing instability of marriages and ageing without close kin do not pose a considerable threat for life satisfaction of elderly people in Switzerland, and probably also in other relatively wealthy countries offering welfare support. The (often implicit) assumption that lack of close family is particularly painful and detrimental for elderly persons did not find consistent support in my data.

References

  • Albertini M., B. Arpino. 2018. Childlessness, parenthood and subjective wellbeing: The relevance of conceptualizing parenthood and childlessness as a continuum. Preprint. DOI: 10.31235/osf.io/xtfq6
  • Bures R.M., T. Koropeckyj-Cox, M. Loree. 2009. Childlessness, parenthood, and depressive symptoms among middle-aged and older adults. Journal of Family Issues 30(5): 670–687.
  • Dannefer D. 2003. Cumulative advantage/disadvantage and the life course: Cross-fertilizing age and social science theory. The Journals of Gerontology Series B: Psychological Sciences and Social Sciences 58(6): S327–S337.
  • Dupre M.E. 2007. Educational differences in age-related patterns of disease: Reconsidering the cumulative disadvantage and age-as-leveler hypotheses. Journal of Health and Social Behavior 48(1): 1–15.
  • Dykstra P.A. 2009. Childless old age. In International Handbook of Population Aging, pages 671–690. Springer.
  • Mikucka M. 2020. Old-Age Trajectories of Life Satisfaction. Do Singlehood and Childlessness Hurt More When People Get Older?. Swiss Journal of Sociology, 46(3), 397-424.
  • Meier A., K. Musick, S. Flood, R. Dunifon. 2016. Mothering experiences: How single parenthood and employment structure the emotional valence of parenting. Demography 53(3): 649–674.
  • Verdery A.M., R. Margolis, Z. Zhou, X. Chai, J. Rittirong, J. (2019). Kinlessness around the world. The Journals of Gerontology: Series B, 74(8), 1394-1405.

Wednesday, September 15, 2021

Gender and socioeconomic inequalities in health after age 50 in Europe

September 13, 2021 by Damiano Uccheddu, Anne H. Gauthier, Nardi Steverink and Tom Emery
health after age 50
Does the impact of socioeconomic factors on health after midlife vary among women and men depending on the welfare context? Apparently it does: Damiano Uccheddu, Anne H. Gauthier, Nardi Steverink, and Tom Emery find that education and wealth have a stronger health impact on older women living in Southern and Western European societies than on those living in Northern Europe.

Gender disparities in health are influenced by a wide set of biological, socioeconomic, and institutional factors (Read and Gorman, 2010). Men usually have better education, better jobs, higher incomes, and higher social status than women, which should give them an advantage in access to health care. Conversely, a well-developed welfare state might help women obtain more autonomy and economic independence (Bambra, 2007).

The key challenge that remains is to understand the intersections between SES, gender, and health in different welfare state typologies. To what extent does the impact of socioeconomic factors on the health of women and men vary across different welfare states? The knowledge gap around this question is even greater at older ages, when health and healthcare services become more important.

Our study


In our research (Uccheddu et al., 2019), we focused on how the association between three different measures of SES (i.e., education, income, and wealth) and a Frailty Index (a multi-dimensional health indicator) (Romero-Ortuno and Kenny, 2012) varies according to gender and across different European contexts. We tested these associations using cross-national data from five waves of the Survey of Health, Ageing and Retirement in Europe (SHARE, 2004-2015). We did so for three European welfare clusters:
  1. Northern Europe (Social Democratic), which includes Denmark and Sweden;
  2. Western Europe (Bismarckian/Conservative), composed of Austria, Belgium, France, Germany, and Switzerland;
  3. Southern Europe (Latin/Mediterranean), represented by Italy and Spain.
The three clusters represent different welfare state regimes and geographical regions:
  1. Northern European countries are characterized by a universalistic approach to social rights and high levels of defamilization (i.e., the extent to which the welfare state permits individual entitlements to a socially acceptable standard of living independent of family relationships) and decommodification (i.e., the degree to which the welfare state frees individuals from market dependence for a socially acceptable standard of living) (Bambra, 2007, 2004);
  2. Western European countries typically have earnings-related access to social support, welfare programs that tend to maintain existing social patterns, a marginal role of the market, and an emphasis on the role of the family;
  3. in Southern European countries state support to families is extremely limited and women are encouraged to take up family and care responsibilities.
Our measure of education was based on the international classification ISCED-97 and refers to the respondent’s highest level of education. We classified education as low (ISCED 0, 1 and 2), medium (ISCED 3 and 4) or high (ISCED 5 and 6). This variable was collected only in the baseline interview. Country and wave-specific quartiles of income and wealth were estimated at the household level and adjusted for family size. These two measures were assessed in each wave of the survey and refer, by survey design, to the year preceding the measurement of the dependent variable. The Frailty Index (FI), our dependent variable, is a composite measure of various deficits, measured at each wave of SHARE, on respondents aged between 50 and 104 years. FI scores were expressed in the range 0-100. High values indicate higher frailty and therefore a poor health status. While the observed minimum of the FI was 0 in the whole sample, its maximum was 83.75, and its average was lower for men (11.05) than for women (13.60).

To assess the influence of SES on health, we estimated a series of “hybrid” (i.e., between-within) regression models and controlled for a series of confounding factors. This method allowed us to account for two types of variation: between-individual and within-individual variation over time.

Results


Table 1 reports the mean values and standard deviations of the FI. Two interesting results emerge. First, the observed mean of the FI was higher for women than for men in all the welfare clusters under analysis. Second, for both men and women, the average FI levels were higher in Southern and lower in Northern Europe, suggesting a north-south gradient in health conditions.
To investigate the intersections between SES, gender, and health, we included gender and SES interaction terms in separate regression models for all older adults combined (Table 2). Note that since the analysis was carried out separately for each welfare cluster, adjusting for country fixed effects, the parameters implicitly refer to a different standard and for this reason they are comparable only in relative terms.

We found that the association between SES and frailty is stronger for women than for men in Southern (education and wealth) and Western European countries (education), as indicated by the statistically significant interaction effect of gender in those contexts (between-individual estimates). For example, we found that the association between education and health was strongest for women living in Southern Europe (b_medium = –2.15; b_high = –2.13), less strong in Western Europe (b_medium = –1.07; b_high = –0.75), and smallest in Northern Europe (b_medium = –0.21; b_high = –0.29).
Southern European women were also more vulnerable than men to the influence of wealth in terms of frailty: the FI of women in the 4th quartile of wealth is 3.7 points lower that of women in the 1st quartile.

However, in an analysis of within-individual variation over time, the association between SES and FI was not statistically significant (results not shown). This means that the differences in health between high- and low-income or wealth groups were more due to differences betweenindividuals than to individual changes in income or wealth.

Concluding remarks


In summary, our findings suggest that SES, as a predictor of health in later life, does not have the same impact across gender within different socioeconomic contexts. In Southern (Italy and Spain) and Western European countries (Austria, Belgium, France, Germany, and Switzerland) especially, the impact of education and wealth on health is stronger for women. Conversely, in Northern Europe (Denmark and Sweden) we did not observe any gender difference in health status according to SES.

Our results are in line with the idea that women’s SES is related to the extent to which the welfare state facilitates women’s autonomy and economic independence from the family (Bambra, 2007). The international variations observed between individuals might be due to the more generous, decommodifying, and defamilializing welfare state policies of the Scandinavian countries that better protect against the health effects of low SES. The more equal distribution of socioeconomic resources in the Northern European countries, combined with high levels of defamilization, may have contributed to smaller gender inequalities in health than in the less redistributive and less protective Southern and Western European countries.

An implication of our findings is that policy and practice aiming to reduce later-life gender and socioeconomic inequalities in health should focus on reducing the objective and systematic inequalities – such as the educational ones – that we examined in our study and which originate in the early stages of life.

References

Thursday, September 9, 2021

Homogamy among high-income partners drives up family income inequality

September 6, 2021 Yifan Shen

More married couples today consist of two high-income or two low-income partners (i.e., income homogamy), which leads to greater income inequality in married-couple families. Yifan Shen shows that, all else being equal, increases in income homogamy among high earners are always more influential in shaping the level of income inequality among couple-headed families.

Demographers contribute to the study of household income inequality by highlighting the importance of demographic forces such as marriage and family structures. Since most men and women form families, the income correlation between husbands and wives is a demographic factor that can shift the level of family income inequality even if there is no change in the individual income distribution (Lam 1997). If more couples consist of two high-income or two low-income partners (i.e., income homogamy rises), the inequality between couple-headed families will intensify. Further, a rising concentration of economic resources among high-powered, dual-career couples may enhance the family-based advantage among children, which may propagate the inequality of opportunity across generations.

Why should we care?


Academic researchers and nonacademic readers are interested in this topic perhaps for different reasons. For the former, the primary goal is to gain a deeper intellectual understanding of this phenomenon, even if it may not have explicit policy implications. Although most researchers are aware that a higher husband-wife income correlation increases income inequality between families, few have considered a further, more nuanced side of the phenomenon: if the level of income homogamy increases, say, by 10% among high-income husbands and their wives, is its impact on between-couple income inequality the same as a similar 10% increase in income homogamy among low-income couples? In other words, does the increase in income homogamy at each level of income contribute equally to between-couple inequality? A better understanding of this question can help researchers identify the subpopulation group that is more relevant to this demographic process of income inequality generation (Liao 2016).

For nonacademic readers, perhaps a more puzzling question is: why should I care about this phenomenon? Rich people tend to marry each other, so what? This is their personal affair. Nothing can be done about it, even if their private decisions may worsen inequality at societal level (Nozick 2013). This is certainly a legitimate concern and many academic researchers probably share it.

Thought experiment


Both questions can at least be partly answered by a thought experiment (Shen 2021). Suppose in a hypothetical world we have three societies that consist of only married men and women. The overall income distributions of married men and women are most unequal in Society 1, modestly unequal in Society 2, and least unequal in Society 3. Further, assume that all men and women within each society are randomly matched with each other in terms of income (so the husband-wife income correlations are zero in each society). Within each society, we order couples by husbands’ incomes from high to low and divide them into five equal-sized groups (quintiles). This is the initial setting of the experiment.

Now, the experiment begins. Within each society, we rematch the top quintile of husbands and their wives assuming perfectly positive matching on their incomes while preserving the baseline pattern of random matching among couples in the other four quintiles. We conduct this quintile-specific rematching one quintile at a time, from the top to the bottom quintile. We end up with six data sets: one baseline data set of randomly matched couples (initial setting) and five new data sets of partially positively rematched couples. We then compute the difference in between-couple inequality between the baseline data set and each of the five new data sets. This gives us a quantitative assessment of the impact on between-couple inequality of increases in husband-wife income correlation (from zero correlation to perfect correlation) at different parts of the income distribution.

Figure 1 shows the results. The impact of increases in income homogamy on between-couple inequality (as measured by Gini index) is far from linear. As long as there is some degree of inequality in husbands’ and wives’ income distributions (i.e., in Society 1 [solid line] and Society 2 [dashed line]), income homogamy increases inequality more when it happens in the top quintile than when it happens in the middle and low quintiles. Because income distributions in real life are always unequal, we can conclude with confidence that increases in income homogamy among high earners always have the largest impact on inequality (holding other conditions constant).

Figure 1 also conveys another message — the impact of income homogamy on between-couple inequality is multiplicative. Increases in income homogamy intensify between-couple inequality, and their disequalizing impact is stronger in societies where incomes are more unequally distributed among married men and women. In the extreme scenario represented by Society 3, in which the income distributions among husbands and wives are very equal, even a drastic transition from random matching to perfect homogamy generates very little inequality between couples (i.e., the dash-dotted line is much lower than the two other lines).

Implications


Returning to our nonacademic question, why should we care about this topic? After all, even if we spend great efforts studying the relationship between income homogamy and inequality, we are still unable to address the inequality that stems from homogamy, as people are free to decide whom they marry. Now we have a partial answer: even though we can do nothing, or should not do anything even if we could, to interfere with high income “homogamy” among high earners, its undesirably large impact on between-couple inequality can still be mitigated by progressive policies – if such policies can reduce the overall income inequality among individual men and women – because when the overall income inequality is reduced, the inequality impact of increases in income homogamy is also reduced. This finding provides an additional rationale for progressive policies that aim at reducing overall income inequality.

References

  • Lam, D. (1997). Demographic Variables and Income Inequality. In M. R. Rosenzweig & O. Stark (Eds.), Handbook of Population and Family Economics (pp. 1015–1059). Elsevier Science B.V.
  • Liao, T.F. (2016). Evaluating Distributional Differences in Income Inequality. Socius: Sociological Research for a Dynamic World, 2, 1–14.
  • Nozick, R. (2013). Anarchy, state, and utopia (Reprint Edition.). New York, NY: Basic Books.
  • Shen, Y. (2021). The Nonlinear Linkage Between Earnings Homogamy and Earnings Inequality Among Married Couples. Demography, 58(2), 527–550.

Monday, July 12, 2021

Parenting culture and gender equality: the case of Iceland

July 12, 2021 · by demotrendsblog 

Sunna Símonardóttir writes about her research on parenting and gender based on the example of Iceland.

Studies typically point to the Nordic countries as examples of countries that have placed a strong emphasis on gender equality in the construction of their family policies, and that have achieved high fertility rates. This Nordic ideal of gender equality brought with it the vision of shared parenthood, in effect that we should strive for a society characterised by couples where both parents/partners are active in the labour market, and both take care of their children.

Iceland enjoys a reputation as one of the most gender equal countries in the world. The female labour force participation in Iceland is almost comparable to that of males. This contributes to putting Iceland on top of the Global Gender Gap Index, compiled by the World Economic Forum, a position the country has held for a decade. The country has also received much attention for an innovative approach to parental leave where fathers have enjoyed a non-transferable parental leave quota since 2000.

The ideal still not achieved?


Nevertheless, whilst the state has actively attempted to involve fathers, my findings suggest that the general discourse equates motherhood with parenthood and promotes an ideology of intensive mothering, which emphasises women´s innate character as primary nurturers (Símonardóttir, 2016; Gíslason & Símonardóttir, 2018; Símonardóttir & Gíslason, 2018). How parenting culture impacts fertility decisions is an important, but somewhat overlooked area of fertility research.

Sharon Hays´s (1996) analysis of the ideology of intensive mothering has been very influential for research on parenting. Many scholars have picked up on Hay’s concept of intensive mothering to describe the contemporary parenting experience in Western countries (Elvin-Nowak & Thomsson, 2001; Lee et al., 2014). They recognised the paradox that this intensive, expert-led type of mothering coincides with women’s increased participation in the labour force (Kanieski, 2010).

Embedded in the cultural script of intensive mothering is a considerable expansion of mothering but this expansion has also been linked to broader ideological shifts in our perception of children as social capital to be invested in (Vandenbeld Giles, 2014) and neoliberal ideas about mothers as managers of risk through informed decision making (Murphy, 2003).

The theory of attachment was originally developed by British psychologist, psychiatrist, and psychoanalyst John Bowlby. The main tenet of the theory is that an intense and constant emotional and physical attachment between mother and child is needed for the healthy development of the child (Bowlby, 1969, Bowlby, 1973, Bowlby, 1980). My study on attachment theory discourse present in educational materials for Icelandic parents has shown that these materials incorporate classic ideas about the primacy of the mother and the intensification of motherhood. At the same time, little effort has been made to incorporate fathers into the discourse or to include them as meaningful agents when it comes to attachment and bonding or to promote a culture of shared parenthood (Símonardóttir, 2016). Although most of the educational materials simply address mothers directly, some effort has been made to introduce a more inclusive, gender-neutral language of ‘caregivers’ or ‘parents’. However, still, more often than not the language reverts to the ‘mother’ language. Fathers are simply not expected to fully inhabit the role of caregiver in the same way as mothers are.

Breastfeeding and maternal self-identity


The focus on exclusive breastfeeding in Iceland is also an important factor when it comes to parenting ideals and the lived experiences of parenting. The prevalence of breastfeeding is traditionally very high in the Scandinavian countries where we have witnessed an upward trend towards higher breastfeeding rates and duration. Almost all Icelandic mothers initiate breastfeeding. Both policy and practice are in line with the World Health Organisation recommendations.

My study on the experiences of Icelandic mothers who had struggled with breastfeeding or been unable to breastfeed reveals how closely linked their self-identity as mothers is with being able to breastfeed. It also shows how often they have to account for their infant feeding practices to friends, family and even strangers. Mothers who are unable to breastfeed often feel that their mothering capabilities and devotion to their child are being ranked and compared, especially by other mothers who judge them both consciously and unconsciously (Símonardóttir, 2016b). This substantial focus on exclusive breastfeeding and the prevalence of attachment theory discourses – and overall adherence to the ideology of intensive mothering – indicate that there are competing discourses at play. Powerful biomedical discourses proclaim that motherhood should be regarded as natural and outside social formations. At the same time, feminist or other gender egalitarian discourses have been unsuccessful in addressing and providing parents with counter discourses that challenge the highly gendered elements of this discourse and its link to idealised versions of motherhood.

Fertility in Iceland


The fertility rate in Iceland has been among the highest in Europe, even among the other Nordic countries. Now there are clear signs that this is changing. In 2020, the total fertility rate was measured at 1.7 children for every Icelandic woman, a figure that has not been lower since records began (Statistics Iceland, 2021).

The average age of first-time mothers has also been steadily going up in recent decades. The relatively recent drop in fertility in Iceland, therefore, presents an ideal case study for understanding how and why couples and individuals decide to have fewer children than before. As previously stated, structural factors influencing fertility have been deemed positive in the Icelandic context; family policies in Iceland, including paid parental leave for both parents, and affordable quality day-care for children.

Faircloth (2013) has noted how intensive motherhood has been imported from the US and UK to other cultural settings where its interpretation and representation can be very different. In France, as Badinter (2012) and Faircloth (2013) have shown, where there is rich feminist history and historic recognition of women’s identities beyond motherhood, intensive mothering is seen as a threat to the feminist cause and women’s liberty.

A theoretical gap is present in the literature when it comes to the context of Icelandic fertility (Jónsson, 2018). Therefore, I believe that it would be particularly important to examine the parenting culture of the Nordic countries and the coexistence of shared parenting and intensive mothering narratives whilst critically engaging with the pull towards intensive mothering within the context of Nordic feminism. This enhanced focus on parenting culture could help to integrate feminist perspectives into fertility explanations, providing a valuable understanding of how shifting opportunity structures for women and men influence fertility and how gendered parenting ideologies and circumstances affect decisions regarding the timing and number of children.


Sunna Símonardóttir is a postdoctoral researcher at the University of Iceland. She completed her PhD in Sociology at the University of Iceland in 2017 and has published widely on parenting and gender. This blog post is based on her PhD thesis. In her current project she uses qualitative methods to examine fertility intentions and behaviour in Iceland.

Wednesday, May 26, 2021

Hurricane Seasons Since 1967

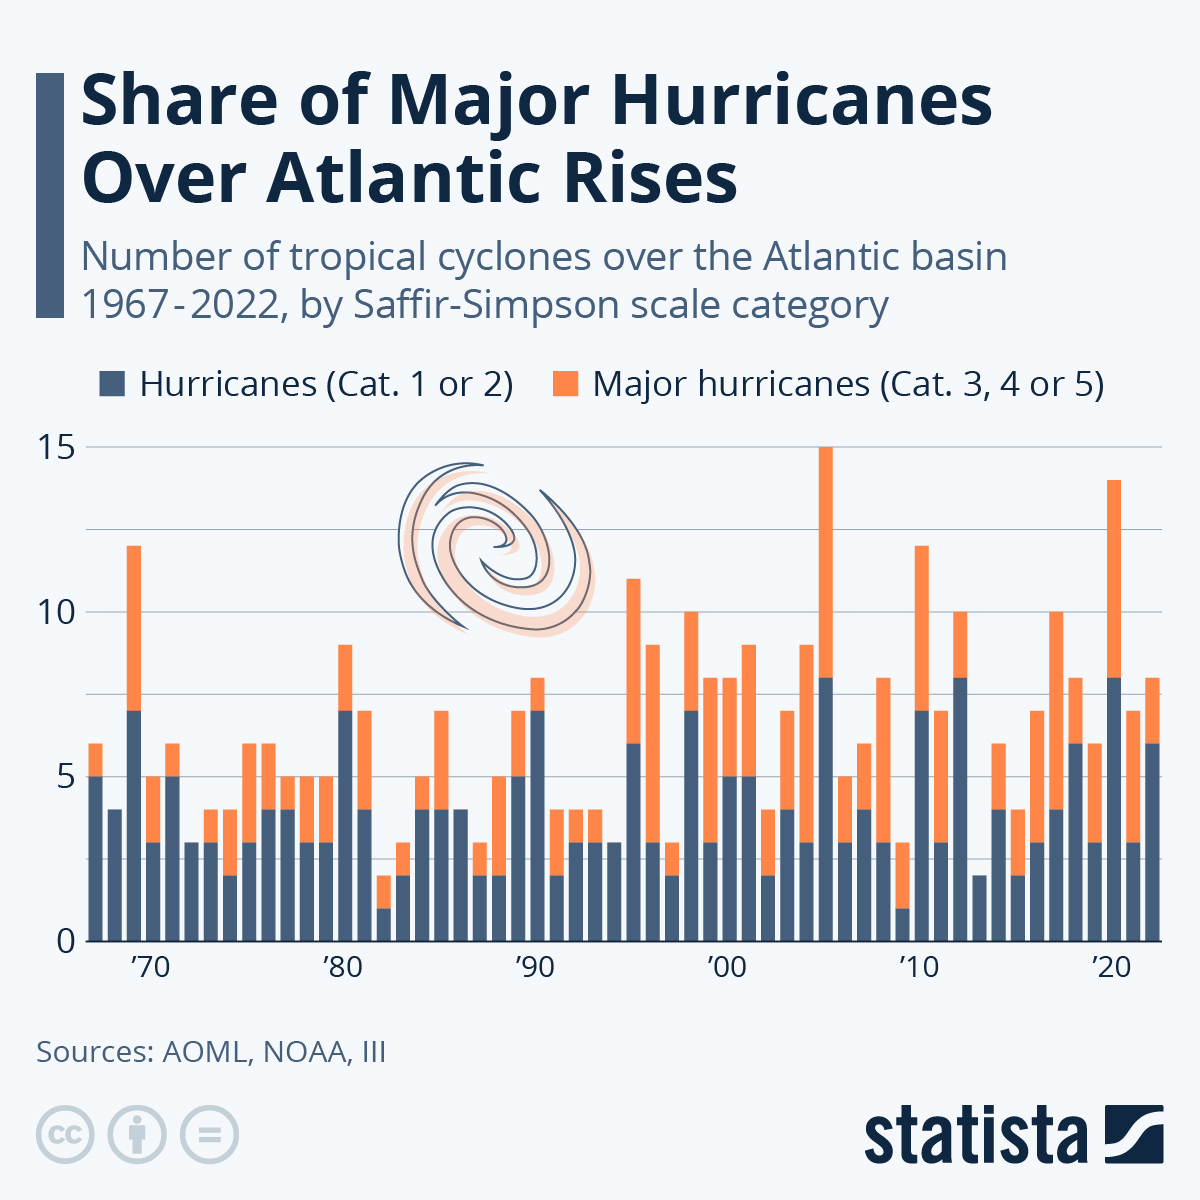
The National Oceanic and Atmospheric Administration predicted an active Atlantic hurricane season for 2021 on Thursday. NOAA said that it expects six to ten hurricanes to occur during the year, with three to five of those likely to become major hurricanes of Category 3 or above on the Saffir-Simpson scale.

The 2020 season was already an extremely busy one for hurricanes, as our chart shows. A total of 14 hurricanes formed over the Atlantic basin - the most since 2005, the year of Hurricane Katrina. Six of those were major hurricanes, including Hurricane Laura, which made landfall in Louisiana in August, and Hurricanes Eta and Iota, which caused devastation in Central America in November.

Once more, NOAA ran out of alphabetically ordered storm names and had to resort to the Greek alphabet as early as September 18. NOAA names all tropical storms over the Atlantic even though only some turn into hurricanes. In 2020, there where a whopping 30 named storms, a new record which created nine greek alphabet names and led the discontinuation of the Greek alphabet auxiliary list. Because the names of storms that cause major damage are typically retired, repeated use of Greek letters charted a quick path for them to become obsolete - like already happened in the case of Eta and Iota.

2019, on the other hand, was a rather subdued hurricane season, but shows another interesting trend. Half of the six hurricanes that occurred that year were major hurricanes - a trend that started in the late 1990s. The number of hurricanes in categories 3-5 on the Saffir-Simpson scale has increased from on average of around 1.6 per year in the 1970s and 1980s to an average of 3.1-3.8 per year in the 2000s and 2010s. Climate change has been identified as a reason why stronger hurricanes occur.

More evidence that hurricane seasons are changing can be deferred from the timing of named storms. 2020's first storm - Arthur - was named on May 15 after forming near the Bahamas. This made 2020 the sixth consecutive year that a named storm formed before the start of the official season on June 1.

2005, when Hurricane Katrina struck New Orleans, was the worst hurricane seasons since 1851, records from the National Oceanographic & Meteorological Laboratory at NOAA show. Hurricane Katrina was just one of seven major hurricanes observed in the Atlantic basin that year, making almost half of all tropical cyclones in 2005 major hurricanes. 2005 was the year with most hurricanes in the Atlantic (15), followed by 2020 (14), 2010 (12, including Hurricane Sandy) and 1969 (also 12).Infographic: Unpredictable Danger: Hurricane Seasons Since 1967 | Statista

Friday, January 1, 2021

What the Freemasons Taught the World About the Power of Secrecy

BY JOHN DICKIE

Freemasonry is the world’s most famous secret society. Its secrecy, indeed, made it into one of history’s most contagious ideas—and thus its history offers a striking lesson in the power of mystery.

The Freemasons trace their foundation to London in 1717. The Craft, as members call it, was based on a fraternal bond created by ritual and symbol. Its rules prescribed formal equality between all members, whatever their race, creed, or class. The aim was moral education: building better men, just as the stonemasons of old had built cathedrals and castles. Crucially, however, all of this was to be conducted in seclusion from the outside world, and it involved learning secrets and swearing to keep them.

Whatever secrets the Masons were guarding, they made for a bewitching recruitment tool. Who could resist the promise to join an élite in possession of occult truths? Within a couple of decades, the mystique of Freemasonry made it a worldwide phenomenon: there were Lodges everywhere from Amsterdam to Aleppo, from Charleston to Calcutta. The Craft spread on the currents of an earlier era of globalization: empire and commerce, warfare and intellectual exchange.

Its founders quickly discovered that they could not control their creation. Within the group, Masons disagreed passionately about arcane rites and procedures, splitting into rival branches based on their beliefs. They also fissured on issues of race and gender. Were women worthy to be admitted to the great mysteries? Were Jewish or Black people? Externally, the Masonic brand was borrowed and bastardized. If you had a secret, then organizing yourself like the Freemasons seemed a good way to keep it. Groups as varied as the Ku Klux Klan (to conceal the identity of white supremacist terrorists), the Sicilian mafia (crime), and the Mormon Church (bigamy) all incorporated the furtive strands of the Masonic DNA.

Perhaps unsurprisingly, suspicion has followed the Brothers’ every step. The Pope excommunicated them very early on, seeing them as covert heretics; any Catholic who joins the Masons is still putting his soul in peril, according to the Vatican. In the aftermath of the French Revolution, a refugee priest in London by the name of the Abbé Barruel wrote Memoirs Illustrating the History of Jacobinism, a five-volume analysis of the Revolution’s causes that blamed everything on an evil scheme hatched within the Lodges. Barruel, in short, was the world’s first conspiracy theorist. Since then, the Freemasons have been blamed for the “murder” of Mozart, the outbreak of the Russian Revolution and a cover-up at the inquiry into the sinking of the Titanic—among a host of other nefarious deeds.

Conspiracy thinking drove Mussolini, Hitler and Franco to crush the Craft. Today, Freemasonry is banned in China, and everywhere in the Muslim world except Lebanon and Morocco. The Charter of Hamas describes Freemasonry as a “network of spies” created by the Jews to “destroy societies and promote the Zionist cause.”

Freemasonry’s secrecy, which gives these feverish imaginings free play, is like the water at the bottom of a well. The men who built the well know how deep it is. The rest of us can only peer down and wonder what might lurk below, while the dark surface mirrors back our fears.

Ask the Freemasons today about secrecy, and you will receive a pat response. “We are not a secret society,” they will say, ”we are a society with secrets.” A committee deep in the bowels of some Grand Lodge or other evidently thought that this formula would put the issue to rest. But, of course, even moderately skeptical non-Masons will still wonder. What secrets? What are they hiding? A whole exposé genre claims to provide the answers that the Masons seem reluctant to hand over.

Yet the Masons’ notorious secrets have never actually been all that secret. The first exposé dates back to 1730. Today a couple of minutes on Google is all it takes to find out everything you might want to know.

Strip away all the protocol, and we find that Masonic secrecy is multifaceted: it is both more and less than what the Google results will tell.

During his initiation rites, a Mason learns many secrets: such as the strange handshake that vouches for his Masonic status. (Masons call it the “grip.”) The symbols whose real meanings Masons learn are also secret. Just to make sure, new Masons also have to swear secret, blood-freezing oaths not to betray the secrets they have learned: “Under no less a penalty… than that of having my throat cut across, my tongue torn out by the root, and my body buried in the sand of the sea at low water mark.”

So Masonic rituals consist of secrets, wrapped in secrets, wrapped in secrets. Once the wrapping is removed, what is revealed are moral principles of utterly disarming banality. Be a nice fellow. Learn more about the world. Remember that death puts things in perspective. The great secrets of Freemasonry are all motherhood and apple pie.

Is that really all there is to it? Even many early Craftsmen were underwhelmed, and formed new versions of the brotherhood to protect proper secrets: like a cure for old age, or the formula for turning base metal into gold. Others sought to fill the secrecy void with utopian politics: both the Illuminati of Bavaria and the Charcoal Burners of Italy were variants of Masonry that offered initiation into a revolutionary plan.

They were all missing the point. Masonic secrecy is not a way of hiding anything at all. It is the wrapping, and not what it contains, that is key. Secrecy is a way of enveloping bonds of fellowship in solemnity and sacredness. Born during the Enlightenment, when the grip of religious orthodoxy on private and public life was beginning to be relaxed, Freemasonry offered a passage to a more secular world. It was a half-way house: its secrecy made it like a religion, without containing any dangerous theological ideas.

The first Freemasons could hardly have predicted the global shaggy dog story of success and notoriety that they would generate. The lesson of their fascinating history is simple: make yourself misunderstood.

Thursday, October 22, 2020

gender inequalities

Thursday, September 24, 2020

territorial segregation in Poland

Зоны без ЛГБТ. 

Зачем их создают города в Польше и что там происходит


Люси Эш Би-би-си

АВТОР ФОТО, GETTY IMAGES

Десятки небольших городов Польши некоторое время назад объявили себя зоной, "свободной от идеологии ЛГБТ". Враждебность политиков по отношению к вопросу о правах геев достигла высшей точки накала, настроениям более либеральной части польского общества противопоставляются традиционные религиозные ценности. Проживающие в этих краях геи вынуждены выбирать - эмигрировать, не высовываться … или бороться с притеснением.

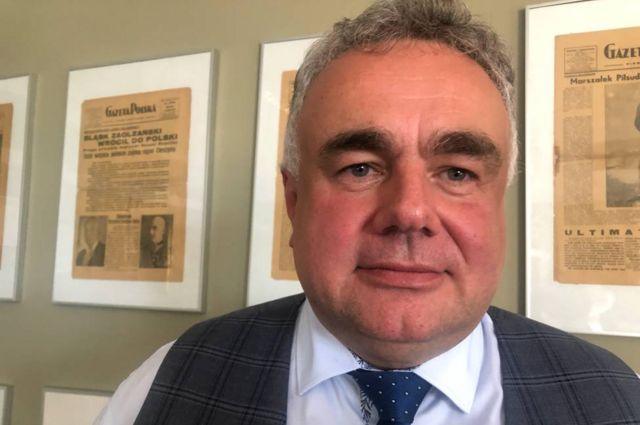
Редактор журнала Томаш Сакиевич пригласил меня в свой офис в Варшаве. К моему удивлению, он берет мою руку, которую я, как и положено, только что протерла санитайзером, и целует ее как польский кавалер XVIII века.

Затем он протягивает мне стикер, который бесплатно прилагается к каждому номеру его еженедельника - правой Gazeta Polska. На стикере радужный флаг перечеркнут черным крестом. "Мы раздали уже 70 тысяч таких, - говорит Сакиевич. - И люди поздравили нас, потомы что мы, поляки, любим свободу".

АВТОР ФОТО, GETTY IMAGES

Около 100 городов и регионов по всей Польше - почти треть страны - приняли резолюции, объявляющие их свободными от ЛГБТ. Эти резолюции, скорее, символичны и не имеют законной силы, но они стали новым оружием во все более ожесточенной войне культур Польши.

Сакиевич говорит мне, что люди должны быть вольны сами выбирать, с кем им заниматься сексом, и с гордостью подчеркивает, что во многом Польша - прогрессивная страна. Здесь гомосексуальность перестала считаться уголовным преступлением еще в 1932 году, на десятилетия раньше, чем это произошло в большинстве европейских стран.

Но он против того, что он сам называет "агрессивной идеологией, пропагандирующей гомосексуальность". Он также считает, что борьба за права геев - это концепция, импортированная из США и Западной Европы и представляющая угрозу традиционным гетеросексуальным польским семьям.

Сегодня Сакиевичу за 50, он вырос в Польше, которая находилась под контролем Советского Союза. Власти решали за людей, что им думать, препятствовали влиянию Церкви и были нетерпимы к диссидентам. Как ни странно, но именно в этом же самом Сакиевич теперь обвиняет кампанию ЛГБТ.

Томаш Сакиевич

"Коммунисты размахивали красными флагами и говорили людям, что они борются за бедных, за рабочих, за крестьян, - говорит он. - Сегодня активисты держат радужные флаги и говорят, что сражаются за права сексуальных меньшинств. Ни тогда, ни сейчас это не было и не является правдой. И мы, как свидетели советских времен, просто обязаны предостеречь других о том, насколько могут быть опасны подобные идеи".

Таких же ультраправых взглядов придерживаются высокопоставленные политики и представители очень влиятельной католической церкви Польши. В одной из предвыборных речей в рамках кампании переизбрания на пост президента Анджей Дуда назвал продвижение прав ЛГБТ-сообщества идеологией "более разрушительной, чем коммунизм". Архиепископ Кракова недавно предостерег от распространяющейся "нео-марксистской радужной чумы".

В условиях санкционированной государством гомофобии и в основном враждебно настроенной прессы есть опасность, что польские геи будут снова вынуждены затаиться, особенно в маленьких городах.

Свидник, расположенный в паре часов езды к юго-востоку от Варшавы, стал первым городом, принявшим резолюцию против ЛГБТ-идеологии.

Барт Сташевски в Свиднике

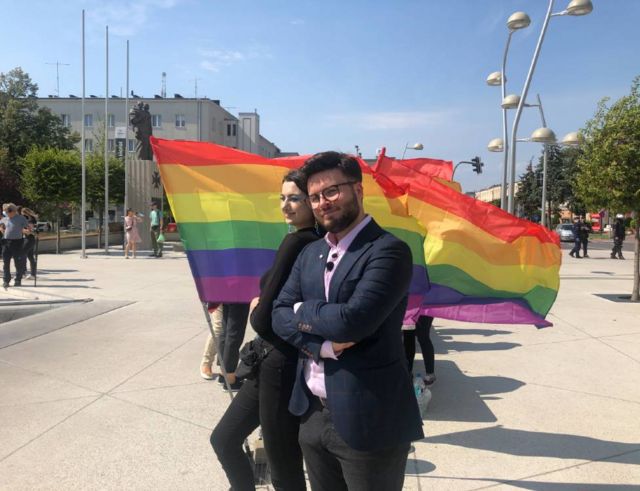
Я приехала в Свидник субботним утром, шестеро ЛГБТ-активистов раздавали на центральной площади листовки, наклейки с надписью "любовь есть любовь" и пончики, присыпанные разноцветным драже. Один из представителей сообщества Барт Сташевски организовал необычный, по его словам, тур по востоку Польши, призванный показать людям, что геи - обычные граждане.

"Мы радужные разрушители легенд. Мы не агрессивны. Мы никого не провоцируем ни нашими шариками, ни нашими флагами, ни пончиками", - добавляет он.

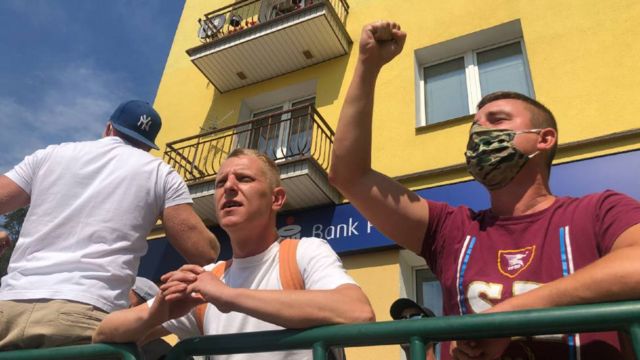
Но на другой стороне улицы группа из примерно 30 молодых людей громко кричит. "Свидник - без радужной пропаганды", - выкрикивают они, пытаясь перекричать музыку, несущуюся из колонок гей-активистов.

Один из них, с бритой головой, говорит мне, что ему не нравится посыл ЛГБТ-группы. "Они не хотят вписываться в наше общество. И мы не хотим их в этом городе", - говорит он.

"Они ослабляют нацию, - говорит другой. - И это и есть цель врагов Польши. Война - это больше не танки и не ракеты. Страны разрушают, создавая хаос. Именно это и пытаются сделать эти геи".

Две группы разделяет длинная шеренга полицейских в касках и пуленепробиваемых жилетах. Им жарко на горячем солнце.

"Честно говоря, я рад, что полиция здесь, - говорит Сташевски. - Мы чувствуем себя в большей безопасности". По его словам, многие геи, лесбиянки, бисексуалы и трансгендеры в последнее время эмигрировали, чтобы избежать преследования.

Город Тухув, основанный в Средние века, с населением 6500 человек тоже объявил себя зоной, свободной от ЛГБТ. В городском парке я встречаю подростка-гомосексуала. Филип (имя изменено) переехал сюда из более крупного и либерального города. Его родители без проблем приняли его сексуальную ориентацию.

В Тухуве Филипу тоже ни разу не приходилось бояться за свою безопасность, но это не значит, что в этой части Польши (100 км от Кракова) легко быть геем.

"Однажды мы с моим другом держались за руки, и некоторые люди выкрикивали в наш адрес всякие оскорбления", - рассказывает он. По его словам, чтобы жить спокойно, геи в Тухуве должны быть невидимыми. Ему самому до сих пор удавалось избегать плохих ситуаций только потому, что он домосед и проводит большую часть своего времени, играя в видеоигры за компьютером.

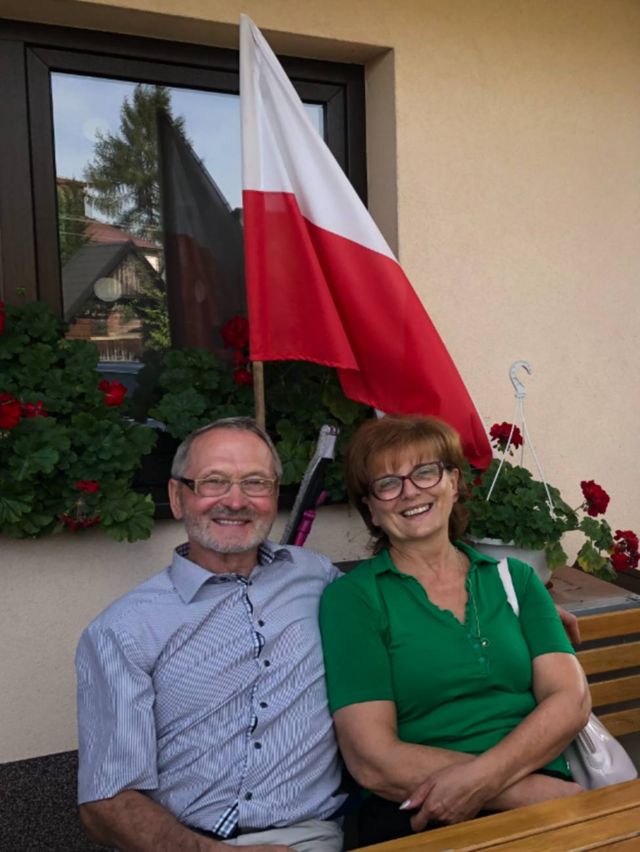
На воскресной мессе в великолепной церкви Благословенной Девы Марии в стиле барокко, возведенной на холме, откуда открывается вид на город, я встретила Гражину Карас. Она - оплот местной общины, занимается сбором денег на различные благотворительные проекты, открыла "горячую линию" для местной молодежи.

Позднее, за чашкой кофе, она рассказывает мне, что полностью поддерживает резолюцию города о "зоне без ЛГБТ". Ее также беспокоят рекомендации ВОЗ в отношении сексуального образования, которые она считает пагубными.

Разного рода пристрастия безудержно распространились в Тухуве, говорит Гражина, но ее в основном беспокоит не алкоголь или наркотики, а интернет и мастурбация.

Казимеж и Гражина Карас


"Наши молодые люди в ужасе от того, что это делают, и хотят остановиться. Но не могут, они не знают, что делать. Я отправляю их к сексологу в церковную клинику", - говорит она.

В этом месте в разговор вмешивается ее муж Казимеж и говорит, что гомосексуальность - это болезнь, которая поддается лечению.

"Но для этого нужно желание, - говорит он. - Это не приговор и не означает, что нужно оставаться гомосексуалом до конца жизни. Что-то с этим сделать можно". Он рекомендует американскую книгу под названием "Каминг-аут гетеросексуала".

Уровень рождаемости в Польше сейчас находится на самой низкой отметке со времен Второй мировой войны, и госпожу Карас очень беспокоит вопрос демографии. "Гомосексуальные сообщества не могут гарантировать укрепление нашего отечества", - говорит она мне.

В ходе кампании переизбрания в июне этого года президент Дуда подписал "Семейную Хартию", в которой пообещал препятствовать заключению браков между гомосексуальными парами и усыновлению ими детей, а также запретить обсуждение темы ЛГБТ в школах.

Гжегож Немьец, местный алтарник, ставший депутатом городского совета и проголосовавший за резолюцию против ЛГБТ-идеолгии, говорит, что его беспокоит вопрос сексуального образования, он хочет, чтобы дети росли в "нормальных семьях". По его словам, никто в горсовете Тухува не выступил против резолюции, хотя трое воздержались от голосования.

Но в августе комиссар Европейского Союза по вопросам равноправия возмутился, заявив, что это противоречит ценностям ЕС и основным правам человека. За этим последовало редкое наказание: Тухув и еще пять городов были лишены финансирования в рамках программ европейских городов-побратимов.

Гжегож Немьец

Немьец говорит мне, что был очень удивлен таким решением, но рад, что министр юстиции Польши компенсировал Тухуву потери, выписав городской казне чек на сумму, в три раза превышающую сумму, невыплаченную ЕС.

"Евросоюзу придется прислушаться к нашему правительству, - говорит он. - Польша встает с колен, и мы больше не будем жить по указке немцев или французов".

Но на прошлой неделе Урсула фон дер Ляйен, глава Еврокомисии, сделала бескомпромиссное заявление.

"Быть собой - это не идеология. Это идентичность человека", - сказала она, выступая перед аплодирующим парламентом в Брюсселе.

"Я хочу сказать предельно ясно: зоны, свободные от ЛГБТ - это зоны, свободные от человечности. И им нет места в нашем союзе".


Магдалена Маршавек [исключит Польшу из ЕС?]

В муниципалитете Тухува мэр города Магдалена Маршавек говорит мне, что ее пост не позволил ей голосовать ни за, ни против резолюции, но, по ее словам, она не против геев и была в ужасе, когда начала получать послания ненависти со всего мира.

Тогда она опубликовала в "Фейсбуке" длинный пост, в котором пожаловалась, что Тухув стал пешкой в чужой игре.

"Я хочу, чтобы люди поняли, что все это делается не ради нас, нашей жизни, наших обрядов. Это политические партии, Евросоюз и организации ЛГБТ используют Тухув для продвижения своих интересов", - говорит она.

Некоторые польские политики выступили в защиту прав геев. На церемонию инаугурации президента Дуды десять женщин-парламентариев надели яркую одежду и маски с радужным принтом. У некоторых в руках были копии конституции, этим они хотели продемонстрировать, что, по их мнению, президент нарушил основной закон страны.

Но активисты ЛГБТ считают, что либеральные политики их подвели, так как не предприняли никаких конкретных действий. Они говорят, что мирные кампании против гомофобии уже ни к чему ни приведут. По мнению активистки небинарных меньшинств Малгожаты Шутович, известной как Маргот, время раздачи стикеров и пончиков прошло.

Маргот

При рождении Маргот звали Михал. Она является основательницей радикального феминистского квир-сообщества под названием Stop Bzdurom ("Прекратите нонсенс"). В июне этого года несколько его участиц вступили в конфликт с водителем грузовика, принадлежавшего консервативной благотворительной организации Fundacja Pro, известной своей кампанией против абортов.

Грузовики этой организации с прикрепленными громкоговорителями ездят по городам Польши с сообщениями, в которых ставится знак равенства между гомосексуальностью, сексуальным образованием и педофилией. "Мы не хотим, чтобы наши дети сомневались в своей идентичности", - говорит представитель организации Анна Щербата.

"Мы хотим, чтобы они росли счастливыми и здоровыми, и чтобы никто над ними не надругался", - добавляет она.

"По сути, идея, которую они распространяют через свои громкоговорители, заключается в том, что геи насилуют детей", - говорит Маргот, которая только недавно вышла из тюрьмы.

После вмешательства международной общественности ее отпустили под залог, но ей все еще грозит 7 лет тюрьмы, если ее признают виновной в избиении людей и нанесении материального ущерба. Маргот настаивает, что лишь пыталась помешать водителю грузовика, который снимал ее с соратницами на телефон. "Мне очень хотелось его избить, но он был в три или четыре раза крупнее меня", - смеется она.

"Я хочу показать моей общине, что мы больше не должны жить в страхе. Мы долгие годы просили хотя бы минимальной законной защиты, если не от дискриминации, то хотя бы от физического насилия", - добавляет Маргот.

Когда я спрашиваю, можно ли считать, что она выступает за применение физической силы, настроение Маргот резко меняется, и она отвечает мне набором ругательств.

"Люди, которые не испытали на себе жизнь ЛГБТ-сообщества в этой стране, не должны нас судить, - говорит она зло. - И не надо удивляться, если нас в конце концов вынудят взять ситуацию в свои руки".


Но и ультраконсерваторы тоже рвутся в бой. Крайне правая организация "Вся польская молодежь" поклялась "забить радужных подонков", они в ярости от того, что радужные флаги появляются на статуях Иисуса Христа и Девы Марии.

"Я только что прочитал в "Твиттере" пост одного из гей-активистов о том, что время мирной борьбы подошло к концу, - говорит Матеуш Маржох, протестующий у здания университета в Варшаве. - Ну что ж, тогда пусть знают, что если они решили прейти к действиям, наша сторона не побежит прятаться. Мы встретим их лицом к лицу. И это будет болезненно".