Showing posts with label инвалид. Show all posts

Tuesday, January 28, 2025

140

По меньшей мере 140 жителей Алтайского края вернулись из зоны боевых действий в Украине без конечностей или частей тела. Об этом говорится в грантовой заявке регионального клуба инвалидов, внимание на которую обратили внимание Сибирь.Реалии.

Клуб инвалидов "Инваспорт" в рамках проекта "Инклюзивная программа "СВОи в спорте" планировал провести мероприятия по развитию волейбола сидя и керлинга на инвалидных колясках, в том числе, среди участников вторжения в Украину.

  • В заявке отмечается, что в регионе наблюдается низкая доступность адаптивного спорта. Стоимость проекта оценивалась 2,8 млн рублей, 2,3 млн из которых должен был составить президентский грант, около 500 тысяч - софинасирование клуба. Фонд президентских грантов отклонил заявку. Сколько военных в России получили тяжелые травмы и инвалидность после войны — неизвестно. По данным Минтруда на 2023 год, больше половины участников войны против Украины, которых признали инвалидами, имеют ампутации.
  • Ранее Сибирь.Реалии рассказали, как участники войны в Украине вынуждены обращаться в надзорные органы, чтобы добиться получения протеза.
ссылка

Tuesday, September 10, 2024

Disability-free grandparenthood in Italy: changes between 1998 and 2016

September 9, 2024 Margherita Moretti, Elisa Cisotto and Alessandra De Rose 

In Italy, grandparents are a fundamental source of care for children, and families are the main source of support for older individuals. Margherita Moretti, Elisa Cisotto and Alessandra De Rose study disability-free grandparenthood in Italy, its evolution between 1998 and 2016, and the drivers of the changes observed.


In the 20th century, Europe underwent significant demographic changes, including increased life expectancy and lower birth rates, leading to rapid population aging. Living longer means that different generations overlap for more years. However, lower and delayed fertility often result in people assuming family roles, such as grandparenthood, at older ages. As the transition to grandparenthood occurs later in life, the health status of grandparents becomes a crucial factor. Their health can strongly influence both the duration and quality of intergenerational relationships, determining whether grandparents are net providers or recipients of care (Grundy, 2005). This dynamic can affect family interactions and adult children’s outcomes, including labour force participation and fertility decisions (Moussa 2019, Rutigliano 2020). Gender differences also play a role, with women typically becoming grandparents earlier and living longer than men, but often experiencing poorer health.

Grandparents’ health in Italy


Italy is characterized by low fertility rates and high survival (Billari e Tomassini 2021), combined with a strong family-focused welfare system that emphasizes robust support networks among family members throughout life (Dykstra and Fokkema 2011). Furthermore, public care provision for children and older individuals is often inadequate, leading Italian families to rely heavily on grandparents for childcare. Conversely, grandparents themselves depend on family support when they are in need of care, often placing a significant burden on young adults, especially women.

The average age at grandparenthood in Italy increased by three years between 1998 and 2016, both for men (59 to 62) and women (54 to 57; Cisotto et al. 2022). How has this affected the evolution of disability-free grandparenthood (DFGP)?

DFGP, originally proposed by Margolis and Wright (2017), indicates the average numbers of years lived as a disability-free grandparent, and it results from the combination of three different age-specific sets of risks: mortality, disability and grandparenthood. In a recent paper (Moretti, Cisotto and De Rose 2024) we estimated DFGP for Italians aged 65 and over between 1998 and 2016, focusing on gender differences and the drivers of change.
In 1998, Italian men aged 65 had a life expectancy of about 16 years, half of which were spent as healthy grandfathers. For women, the figures were about 20 years and 10 years, respectively. By 2016, life expectancy at age 65 had increased by over three years for men and by two and a half years for women. DFGP also increased to over 10 years for men and 12 years for women. In short, grandparents lived more disability-free years of overlap with their grandchildren in 2016 than 18 years before.

Despite longer life expectancy and DFGP, however, the proportion of life spent as grandparents after age 65 decreased for men, from 70% to 65%, and the gender gap in DFGP increased, with women enjoying nearly two more years of disability-free grandparenthood than men. In relative terms, in 2016, women had a higher proportion of their life expectancy at age 65 as grandmothers than men had as grandfathers (almost 70% for women and 65% for men). However, women spent a smaller share of their grandparent years free from disability (80% vs. 85% for men). Indeed, Italian women report more years of disability than men (Moretti & Strozza, 2022), both in general and in their years as grandmothers.

Drivers of changes in disability-free grandparenthood


Improvements in health and longer survival were the main reasons for increased DFGP over time (Figure 2). For men, however, the decrease in the prevalence of grandparents at younger ages, due to reduced and delayed grandparenthood, slowed the increase in grandparenthood years, and this is reflected in the smaller increase in disability-free grandparent years. For women, at younger ages (65 to 79), reduced mortality was the main reason for the increase in DFGP. At older ages, improvements in population health (lower disability prevalence) and a relatively constant prevalence of grandmothers were the most important factors. For men, instead, the changes in DFGP are explained almost totally by the lengthening of life. The decrease in the prevalence of grandfathers at younger ages (65 to 74), partially offsets the gains from reduced mortality and disability risks over the three decades (Figures 3 and 4).

Conclusions


These findings highlight the complex interplay between the factors that determine the evolution of healthy grandparenthood. They also show that policies aimed at improving the health and well-being of older adults also affect others, their relatives in particular, by modifying the likelihood that older family members will be net providers or receivers of care.

References

  • Billari, F.C. and Tomassini, C. (2021). Rapporto sulla popolazione: L’Italia e le sfide della demografia. Bologna: Società editrice il Mulino, Spa.
  • Cisotto, E., Meli, E., and Cavrini, G. (2022). Grandparents in Italy: Trends and changes in the demography of grandparenthood from 1998 to 2016. Genus 78(1): 10. doi:10.1186/s41118-022-00153-x.
  • Dykstra, P.A. and Fokkema, T. (2011). Relationships between parents and their adult children: A West European typology of late-life families. Ageing and Society 31(4): 545–569. doi:10.1017/S0144686X10001108.
  • Grundy, E. (2005). Reciprocity in relationships: Socio-economic and health influences on intergenerational exchanges between Third Age parents and their adult children in Great Britain. The British Journal of Sociology 56(2): 233–255. doi:10.1111/j.1468-4446.2005.00057.x.
  • Margolis, R. and Wright, L. (2017). Healthy grandparenthood: How long is it, and how has it changed? Demography 54(6): 2073–2099. doi:10.1007/s13524-017-0620-0.
  • Moretti, M., Cisotto, E., & De Rose, A. (2024). Uncovering disability-free grandparenthood in Italy between 1998 and 2016 using gender-specific decomposition. Demographic Research, 50, 1247–1264.
  • Moretti, M. and Strozza, C. (2022). Gender and educational inequalities in disability-free life expectancy among older adults living in Italian regions. Demographic Research 47(29): 919–934. doi:10.4054/DemRes.2022.47.2
  • Moussa, M.M. (2019). The relationship between elder care-giving and labour force participation in the context of policies addressing population ageing: A review of empirical studies published between 2006 and 2016. Ageing and Society 39(6):1281–1310. doi:10.1017/S0144686X18000053.
  • Rutigliano, R. (2020). Counting on potential grandparents? Adult children’s entry into parenthood across European countries. Demography 57(4): 1393–1414. doi:10.1007/s13524-020-00890-8.

Thursday, December 8, 2022

migration estimated

Отъезд большого числа россиян из страны в 2022 году в сочетании со спадом инвестиций может привести к максимальному падению ВВП с кризисного 2009 года. Об этом говорится в прогнозе главного экономиста Альфа-банка Наталии Орловой и экономиста Ирины Ростовцевой.

ВВП России, по их мнению, может сократиться в 2023-м сразу на 6,5%. Это заметно больше, чем ожидают правительство, ЦБ и МВФ. Альфа-банк видит угрозы потребительскому спросу, наблюдает отток частного капитала и уверен, что нынешний кризис отличается от всех предыдущих

До этого самое серьезное сокращение экономики России с начала 2000-х годов было зафиксировано по итогам 2009 года на фоне мирового финансового кризиса. Тогда ВВП России падал на 7,8%.

Сейчас оптимизм некоторых экспертов по поводу 2023 года опирается на уверенность в сильном рынке труда и бюджетном стимулировании, которые могут поддержать потребление, пишут Орлова и Ростовцева. Но нельзя недооценивать миграцию: с учетом уехавших в феврале-марте 2022 года речь может идти об отъезде примерно 1,5% рабочей силы в России.

При этом вместе с людьми «уезжает» частный капитал. На это указывает, например, рост российских вкладов на счетах банков за пределами России: если до начала 2022 года россияне хранили меньше $30 млрд за пределами России, то с февраля эта сумма увеличилась более чем в два раза, до $66 млрд, по состоянию на сентябрь. Это может указывать на физическое сокращение рынка потребителей в России. Причем уезжают из России, по-видимому, представители среднего класса, а это особенно негативно скажется на потреблении премиальных товаров. «В целом мы не ожидаем, что частное потребление восстановится в 2023 году и прогнозируем его снижение на 2% в будущем году», — написали эксперты.

Инвестиции в основной капитал в 2023 году могут сократиться на 10% год к году, в том числе из-за санкций. Инфляция резко снизится в апреле 2023-го, но до конца года ускорится до 6%, это может побудить ЦБ снизить ключевую ставку до 6% годовых.

Wednesday, August 25, 2021

The Most Successful Paralympic Nations

With the Summer Olympics having drawn to a close on 8 August, the next major multi-discipline international sporting event is due to get started this week - the Paralympics. Meaning the 'parallel olympics', the Games are a meeting of the world's top athletes that have some form of disability and have taken place since 1960.

As our infographic shows, like the Olympics the United States has been the dominant force here too with a total of 2,175 medals the most overall victories. Great Britain is currently in second place with 1,789 while Germany makes up the top 3 with 1,443. The opening ceremony will take place on 24 August while the first competitions will be started the following day, including medals being awarded in the swimming, cycling and wheelchair fencing.Infographic: The Most Successful Paralympic Nations | Statistaобщий зачёт Олимпиады — РФ еа 5-м месте, Китай на 2-м

Friday, August 13, 2021

miracles do not happen

Китай ужесточает регулирование частного бизнеса. Рынок заволновался

12 августа 2021

В этом году Китай отмечает 100-летие Коммунистической партии

Китайское правительство обнародовало пятилетний план, предусматривающий более жесткое регулирование большей части экономики страны.

План из 10 пунктов, рассчитанный до конца 2025 года, вечером в среду опубликовали Государственный совет Китая и Центральный комитет Коммунистической партии.

Согласно этому документу, вскоре появятся новые правила, охватывающие такие области как национальная безопасность, технологии и монополии во второй по величине экономике мира.

Последние годы внимание официального Пекина все больше привлекают технологическая и образовательная отрасли.

Обвал на биржах


В июле этого года акции китайских компаний, котирующихся в США, уже опускались до самой низкой отметки с 2008 года: индекс Nasdaq Golden Dragon China, на котором котируются акции 98 компаний, зарегистрированных в США, за две торговые сессии упал почти на 15%.

Спад начался после серии репрессивных, по мнению инвесторов, мер, принятых правительством Китая против компаний в сфере технологий и образования.

Пекин провел масштабную реформу сектора частного репетиторства (этот рынок оценивается в 120 млр долларов), в соответствии с которым все учебные заведения, предлагающие обучение по школьной программе, будут зарегистрированы как некоммерческие организации.

В новых правилах также сказано: "Учебным заведениям, занимающимся предметными учебными программами, не разрешается публиковать финансирование; зарегистрированные на бирже компании не должны инвестировать в эти учебные заведения, а участие иностранного капитала в таких учебных заведениях запрещено".

Китайские власти также взялись за онлайн-сервисы, от приложений для доставки еды до стриминговых платформ.

В конце июля Государственная администрация Китая по регулированию рынка обнародовала новые правила, направленные на улучшение условий занятости работников доставки: работники служб доставки должны как минимум получать минимальную заработную плату, более качественное профессиональное обучение и сокращенную нагрузку.

Акции Tencent обвалились на бирже в Гонконге после того, как Пекин приказал технологическому гиганту прекратить эксклюзивные сделки по лицензированию музыки с крупными звукозаписывающими компаниями по всему миру.

Регуляторы объяснили свое решение доминирующим положением компании на рынке музыкального стриминга.

Государственное регулирование


В документе упоминается и председатель Мао: Китай празднует 100-летие Коммунистической партии страны.

В нем говорится, что для важных областей, таких как наука и технологические инновации, культура и образование, государственное регулирование будет усилено, а китайское правительство собирается бороться с монополиями и "верховенством закона иностранного происхождения".

Новые правила коснутся и цифровой экономики Китая, включая интернет-финансы, искусственный интеллект, обработку "больших данных" и облачные вычисления.

Рынок заволновался, что в ближайшие годы Пекин продолжит ужесточать регулирование технологических и частных образовательных компаний.

Пекин уже начал антимонопольные расследования в отношении некоторых из крупнейших технологических компаний страны.

В феврале этого года в стране заработали новые антимонопольные правила.

В частности, правила не позволяют электронным торговым площадкам заставлять поставщиков заключать с ними эксклюзивные контракты.

Государственная администрация по регулированию рынка Китая таким образом пытается прекратить фиксацию цен, хищническое ценообразование и невыгодные торговые условия.

Также введены правила против ограничения технологий и использования данных и алгоритмов для манипулирования рынком.

Новые правила также будут применяться к компаниям, занимающимся финансовыми технологиями и платежами.

Рекордный штраф


В апреле технологический гигант Alibaba получил рекордный штраф в 2,8 млрд долларов по результатам расследования, показавшего, что компания годами злоупотребляла своим доминирующим положением на рынке. Это 4% от выручки компании за 2019 год.

Давление на Alibaba усилилось в октябре прошлого года после того, как соучредитель Джек Ма раскритиковал регулирующие органы, заявив, что они сдерживают инновации.

Вскоре после этого выступления китайские регуляторы запретили вывод на рынок акций Ant Group, дочерней компании Alibaba и крупнейшего оператора электронных платежей в Китае.

Правда, некоторые комментаторы тогда отмечали, что по поводу работы подразделения Ant Group в сфере потребительского финансирования у властей существуют вполне оправданные опасения.

Борьба с монополиями


Alibaba - не единственная китайская компания, на которую положили глаз китайские регуляторы.

Весной этого года Государственная администрация по регулированию рынка Китая заявила, что оштрафовало 12 компаний за 10 сделок, нарушающих антимонопольные правила.

В их числе - Tencent, Baidu и Didi Chuxing, которые входят в число крупнейших технологических компаний страны.

В июле некоторые из крупнейших онлайн-платформ страны - Kuaishou, инструмент обмена сообщениями Tencent QQ, Taobao и Weibo - получили приказ удалить неприемлемый детский контент.

В рамках реформы образовательных организаций в ходе недавней проверки один человек и шесть учебных заведений были наказаны за то, что предлагали нелицензированное внеклассное дополнительное обучение, которое нарушало правила. Об этом в понедельник сообщила муниципальная комиссия по образованию Пекина.


Рыночная стоимость Ant Group накануне несостоявшегося IPO оценивалась в 150 млрд долларов

Таким образом правительство ответило на изменения в форме деятельности репетиторских фирм, которые те предприняли после июльских заявлений официального Пекина.

На этой неделе китайская банковская и страховая служба ужесточила регулирование деятельности онлайн-страховых компаний.

Комиссия по регулированию банковской и страховой деятельности Китая предписала фирмам прекратить ненадлежащие маркетинг и ценообразование, пригрозив им суровым наказанием.


Ждать ли в РФ китайских мигрантов? Или их ждать в США?

Wednesday, April 21, 2021

Individuals with depression express more distorted thinking on social media


Depression is a leading cause of disability worldwide [утверждение глубоко сомнительное, зато в открытом доступе, отлично от некоторых], but is often underdiagnosed and undertreated. Cognitive-behavioral therapy holds that individuals with depression exhibit distorted modes of thinking, that is, cognitive distortions, that can negatively affect their emotions and motivation. Here, we show that the language of individuals with a self-reported diagnosis of depression on social media is characterized by higher levels of distorted thinking compared with a random sample. This effect is specific to the distorted nature of the expression and cannot be explained by the presence of specific topics, sentiments, or first-person pronouns. This study identifies online language patterns that are indicative of depression-related distorted thinking. We caution that any future applications of this research should carefully consider ethical and data privacy issues.

CategoryDefinitionExamples
CatastrophizingExaggerating the importance of negative events‘The evening will be a disaster’
Dichotomous reasoningThinking that an inherently continuous situation can fall into only two categories‘No one will ever like me’
Disqualifying the positiveUnreasonably discounting positive experiences‘OK but my grade was not that good’
Emotional reasoningThinking that something is true on the basis of how one feels, ignoring the evidence to the contrary‘My grades are good but it still feels like I will fail’
Fortune-tellingMaking predictions, usually negative ones, about the future‘Whatever I try I will not be successful’
Labelling and mislabellingLabelling yourself or others while discounting evidence that could lead to less disastrous conclusions‘I am a total loser’
Magnification and minimizationMagnifying negative aspects or minimizing positive aspects‘My good grades are really not important’
Mental filteringPaying too much attention to negative details instead of the whole picture‘If I only worked harder, I would be more successful’
MindreadingBelieving you know what others are thinking‘Everyone believes I am a failure’
OvergeneralizingMaking sweeping negative conclusions on the basis of a few examples‘Nobody ever cares for me’
PersonalizingBelieving others are behaving negatively because of oneself, without considering more plausible or external explanations for behaviour‘Everyone thinks I am a loser for calling her’
Should statementsHaving a fixed idea on how you and/or others should behave‘I have to to do this or I will not make it to the weekend’

Cohort of individuals with depression


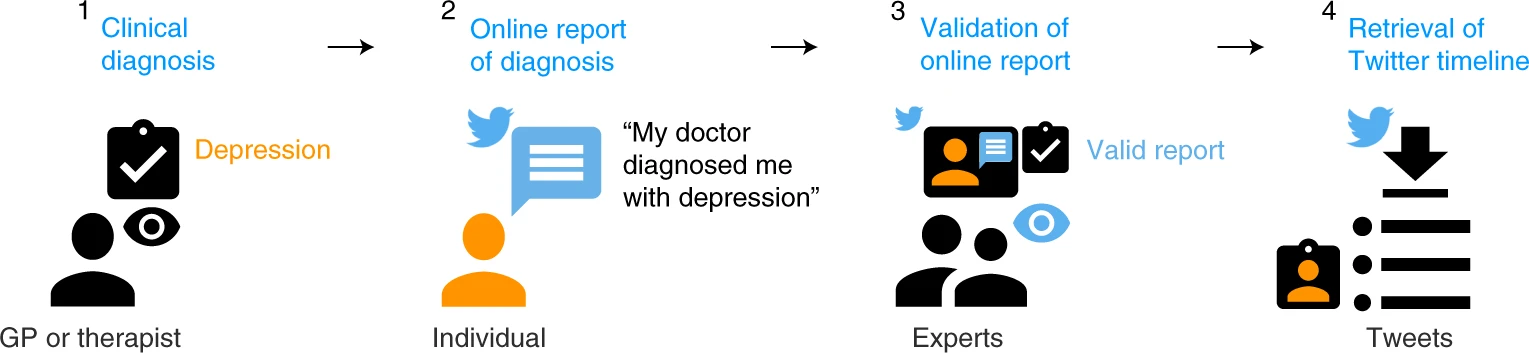
We identified a cohort of individuals with depression who (1) received a clinical diagnosis of depression and (2) explicitly reported this diagnosis on social media using a variant of the statement ‘I was diagnosed with depression by my doctor’. (3) A team of experts rated each statement to ensure that the statement actually reports a personal, clinical diagnosis of depression, after which (4) the individual’s timeline (all tweets up to the limit allowed by the Twitter data service: the 3,200 most recent tweets) was downloaded and added to our analysis cohort. Twitter, tweet, retweet, and the Twitter logo are trademarks of Twitter, Inc. or its affiliates.


Sunday, April 11, 2021

abled photo


на фотке интересно наличие лэйбака USAID, фотка сделана 1 апреля, но не шутка ни разу. Севастопольский парк.

Tuesday, May 5, 2020

Let COVID-19 expand awareness of disability tech

The pandemic’s disruption shows how much academia could learn from the disability community.


by Ashley Shew

Disabled people including myself have long campaigned for accommodations to help us live our lives. The COVID-19 pandemic shows that these are not as impractical as we have always been told. Supermarkets, restaurants, and pharmacies (even outside cities) can deliver; remote working, medicine, and education are possible for many; and social lives can be rewarding without requiring us to leave home.

All around me, I see academic colleagues adopting disability-led hacks and long-sought accommodations. I wish everyone had thought about these workarounds — and about disabled people at all — earlier. When lockdowns end, we must not forget these lessons, not least because the pandemic will disable people, and the impacts will be felt most by the most vulnerable parts of society.

Academia is paying for its ableism. At many universities, in-person research with human participants and in laboratories has been curtailed. If these projects had considered disabilities, they might be better off: disabled academics already plan in short increments, with built-in flexibility.

In 2014, I returned to my job as an assistant professor, newly multiply-disabled — a hard-of-hearing amputee battered by chemotherapy, and more. I felt out of place. I could no longer access many spaces, including most of my colleagues’ offices, and I sought the camaraderie of other disabled faculty members, staff, and students. My disabled comrades and I recognize the diversity of disabilities: congenital and acquired; ranging from cognitive to sensory, mobility, and more; apparent and not. Many of us pursue research that emphasizes how disabled people are the best experts on the technologies and structures that meet our needs.

One of my projects examines accounts of disabled people’s lived experiences with technologies, and how they differ from those of the scientists and engineers behind the tech. I planned my work intending to recruit disabled students among my researchers. Most of the studies can be done remotely, even from the bed, and on a funky, asynchronous timetable as needed. Last year, when I had lung surgery, my group shifted gears without worry. And because of its disability-led design, my team’s project is pandemic-proof.

Another project, to gauge the experiences of students in civil-engineering classes, was designed to include participants with a range of disabilities. So we obtained approval for flexibility in communication format: we conduct our interviews by text, e-mail, Zoom, and other means. Because we planned for disabled people to lead and participate in the research, we’re well prepared for the current situation — or for any other.

Many disabled people are also adept at managing our energy, and forgiving ourselves for not always meeting conventional metrics of ‘productivity’. My non-disabled colleagues are now struggling to adjust, but my team appreciates that ‘clocks should bend to our bodies’, not the other way around. Some disabled people call this concept Crip Time, reclaiming a derogatory term in pride (much like ‘queer’ for many LGBT+ people).

The disability community creates and lobbies for technologies and infrastructure that work better for all. Deaf and disabled people fought hard for things such as captioning on television, which has since become ubiquitous in sports bars and airports and can now be appreciated by people streaming media while those they live with rest or work.

The bitter irony is that, at the moment when non-disabled — or not-yet-disabled — people are beginning to normalize these disability hacks and hard-won infrastructure, society’s disregard for disabled people is clear. We are dying of COVID-19 in greater numbers than are non-disabled people, in rehabilitation facilities, state institutions (including prisons), group homes, and care homes.

Many accommodations demanded under COVID-19 were implemented within weeks, including the ability to work from home, to have flexible schedules, to get what we need without excessive and demeaning documentation, to share and celebrate creative adaptation, to work with the knowledge that all schedules can change. These are all things that disabled and chronically ill people have wanted for a very long time. I hope that when we’ve flattened the curve and saved as many people as possible, we don’t return to a world in which disabled people are ignored (especially when COVID-19 will probably produce more of us).

So start making changes that should have been standard all along. Plan creatively and accessibly to allow more work offsite, and to include people whose clocks aren’t steady. Welcome suggestions from disabled colleagues and students about how to make the environment work best for their neurotype and schedule. Be ready to take criticism: too often, work is set up as dictated by convention, rather than by calling on relevant experiences and possibility.

Make your teaching and scholarly materials multi-modal: produce formats that work for people with different physical conditions and ways of reading and communicating, sharing, and contributing. Think about multiple ways to allow participation in your funding, reviewing, research, and engagement. Let’s see an end to patronizing objectification and assumptions about what we want and need: include disabled people in boards, teams, and studies, and learn from us. We have had to become masters of invention. The pandemic has made the value of that clearer than ever.

Nature 581, 9 (2020)
doi: 10.1038/d41586-020-01312-w

Sunday, February 9, 2020

disabled.ru

Распределение инвалидов и показателя уровня инвалидности по полу и возрасту в 2015 году, РФ

картинка тыцабельна — тогда много лучше видно

Tuesday, January 21, 2020

Explaining disability trends in the United States, 1963-2015

Published on N-IUSSP.ORG January 20, 2020

Jona Schellekens

Using the world’s longest running survey of health data, the National Health Interview Survey, Jona Schellekens shows that the decrease in mortality from cardiovascular disease in the US postponed the decline in disability from the 1970s to the 1980s, whereas better education explains the long-term downtrend in disability that started in the 1980s.

Mortality and disability


In the absence of health surveys, we know very little about trends in disability before the 1960s. When health surveys become available, we can see that disability trends follow those in mortality with a lag. After a period of decline, mortality rates in the United States (and other Western countries) stagnated in the 1960s, then started falling again in the 1970s, mostly as the result of decreasing mortality from cardiovascular disease. However, disability prevalence did not start to decline until the 1980s (Crimmins et al. 2016).

Determinants of trends in disability


Medical interventions are one possible explanation for the decline in disability. However, although medical technology may reduce disabilities (Cutler 2005), medical interventions may also raise their prevalence by prolonging the average duration of certain diseases (Gruenberg 1977). While mortality from major debilitating diseases, such as cardiovascular diseases, has declined, their prevalence appears to have increased. Heart disease is a leading cause of disability. Another main disabling condition is hypertension, a major risk factor for stroke.

Education is strongly associated with many health-related behaviors, access to health care, and ability to navigate the healthcare system. A low level of education is also associated with psychosocial factors, such as depression, social isolation, stress, and loss of control, which may affect health. Thus, an increasingly educated elderly population is another possible explanation for the decline in disability (Freedman and Martin 1999).

Data and variables


The US National Health Interview Survey is the world’s longest running survey of health data, dating back to 1957. Annual microdata have been preserved from 1963 to the present (King 2011).¹However, the design of the question on disability has changed over time. To cope with this problem, in a recent study I added variables indicating change in question design to the statistical analysis (Schellekens, 2019). Moreover, in certain years, all respondents above age 85 are grouped together. For this reason, I limited the analysis to a sample of 1,453,543 respondents aged 50-84.

The outcome variable in the analysis was the probability of reporting any limitation of activity. Figure 1 presents trends in the annual percentages of women and men concerned. It shows a steep rise around 1973 and a sudden drop around 1997. Among men, an additional sudden drop occurs around 1982. The timing of these discontinuities suggests that they are associated with the expansion of Medicare in 1973 and with changes in question design in 1982 and 1997.²That of 1997, in particular, makes the decline in disability appear to be much more dramatic than it really was. By adding variables indicating the three discontinuities to the statistical analysis, I was able to estimate how disability trends would have evolved if question design and coverage of Medicare had been the same as they are today.

In addition to the three indicator variables that correct the survey data for discontinuities, I used two variables to explain trends in the probability of a respondent reporting any limitation of activity: (1) mortality rates from cardiovascular disease, as a proxy for medical interventions; and (2) years of education, as reported by the respondent.

What would have happened if …


A simple way to show the effect of change in an explanatory variable on the annual percentage reporting any limitation of activity is to estimate how the percentage evolves if an explanatory variable is held constant. I thus estimated trends in disability, first under constant cardiovascular mortality rates, and then under constant conditions of educational attainment.

I present the results only for men, because those for women are very similar. The American population has aged. Thus, other things being equal, we expect an increase in disability prevalence. To take aging into account, Figure 2 presents the results for men at age 60. The solid line shows the trends obtained after correcting the data for discontinuities caused by the changes in question design and the expansion of Medicare. It confirms that the percentage reporting any limitation of activity started to decline in the 1980s.

Figure 2 also shows what would have happened to men aged 60, if the two explanatory variables had remained constant, without changes in question design or in the coverage of Medicare. If cardiovascular mortality had not decreased, then disability prevalence would already have started to decline in the 1970s (red line). The hypothesis that gains in longevity are associated with longer periods of morbidity is consistent with this scenario. If, in addition to constant cardiovascular mortality, there had been no improvement in educational attainment, then there would not have been a clear downward trend in the annual percentage of men reporting any limitation of activity (blue line). Thus, my analysis shows that the decline in disability is associated with an increasingly educated elderly population.

Conclusion


Trends in cardiovascular mortality and educational attainment together account for all major trends in disability at ages 50-84 from 1963 to 2015, leaving limited room for other explanations. I chose to present results for men aged 60 only. This choice was arbitrary. However, my conclusions are indifferent to the choice of the exact age between 50 and 84.

My results provide support for the argument that disability will stop declining in the near future if better education is indeed the major explanation for this trend. The level of education will not continue to rise forever. As the rise draws to a halt, my analysis predicts that disability rates will stagnate. It is possible that we have already reached this stage, as the percentage disabled has not shown a clear trend in the last decade.

References

  • Crimmins, E. M., Zhang, Y., & Saito, Y. (2016). Trends over 4 Decades in Disability-free Life Expectancy in the United States. American Journal of Public Health 106(7), 1287-1293.
  • Cutler, D. M. (2005). Intensive Medical Technology and the Reduction in Disability. Pp. 161-179 in Analyses in the Economics of Aging, edited by David A. Wise. Chicago: University of Chicago Press.
  • Freedman, V. A., & Martin, L. G. (1999). The Role of Education in Explaining and Forecasting Trends in Functional Limitations among Older Americans. Demography 36(4), 461-473.
  • Gruenberg, E. M. (1977). The Failure of Success. The Milbank Memorial Fund Quarterly: Health and Society 55, 3-24.
  • King, M. L. (2011). A Half Century of Health Data for the U.S. Population: The Integrated Health Interview Series. Historical Methods 44(2), 87-93.
  • Schellekens, J. (2019). Explaining Disability Trends in the United States, 1963-2015. Population and Development Review. https://doi.org/10.1111/padr.12292

Footnotes

¹ Minnesota Population Center and State Health Access Data Assistance Center (2016). Integrated Health Interview Series: Version 6.21 [dataset]. Minneapolis, MN: IPUMS.
² Medicare is the federal health insurance program for people who are 65 or older. The 1972 Social Security Amendments expanded Medicare to provide coverage, beginning July 1, 1973, to disabled persons receiving cash benefits for 24 months under the social security program.

Tuesday, April 10, 2018

access to disability

Disability symbols МОСКВА, 9 апреля. /ТАСС/. Правительство утвердило перечень заболеваний, при которых может быть установлена бессрочно, до достижения ребенком 18 лет и даже заочно. Соответствующий документ опубликован в понедельник на сайте правительства.

"Подписанным постановлением в правила внесены изменения, направленные на совершенствование процедуры медико-социальной экспертизы (МСЭ) в целях определения случаев, когда инвалидность устанавливается бессрочно при первичном обращении и когда инвалидность может быть установлена при заочном освидетельствовании", - говорится в сообщении.

Также предусмотрена возможность внесения изменений в индивидуальную программу реабилитации или абилитации инвалида без пересмотра группы инвалидности или срока, на который она установлена.

Расширен перечень заболеваний, дефектов, необратимых морфологических изменений, нарушений функций органов и систем организма. Всего в перечень внесено 58 заболеваний. На основании скорректированного перечня специалисты МСЭ уже при первичном освидетельствовании смогут устанавливать инвалидность без указания срока переосвидетельствования, заочно или до достижения 18 лет.

"Таким образом, будет исключена возможность определения срока установления инвалидности по усмотрению специалиста МСЭ", - говорится в пояснительной записке к документу.

Решение о заочном освидетельствовании может быть принято не только при тяжелом состоянии пациента, но и при проживании граждан в отдаленных и труднодоступных местностях. Также у граждан появляется возможность обращаться в бюро МСЭ для установления инвалидности самостоятельно даже при отсутствии направления на МСЭ.

Подробнее см ТАСС

Wednesday, October 2, 2013

common sadism

common sadism
клетчатый кусочег на этой фотке моё пузо, серое вверху -- стенка лифта, ниже её рифлёный пол, немного видно белое колесо инвалидной коляски, из-под него торчит мой ботинок (чорный), то-есть, я какбе висю над матерью сидящей в коляске; чорное -- её пальто
в такой интересной конфигурации внутри кабинки лифт застрял
к счастью, ненадолго, минут черех 10 нас вытащили, дальше прикольнеее:
common sadism
приехали мы с сбербанку продлевать доверенность, поскольку банк признаёт только свою, для оформления которой надо лично явиться, либо нотариальную, стоимостью 7 тыс руб, что пенсионеру пожы зневлом
ну, а в сбербанке юзер френдли всё устроено, тут уж не поспоришь
common sadism
говорю им: выносите стол -- бум писать
-- вынос стола правилами не предусмотрен, то-есть, предусмотрен невынос
сэрцэ успокоили выдачей платинки, на коленке написали

мораль: живи быстро, умри мала.дым
упг: поставил на ФБ банк друзей -- убрали моментально