Showing posts with label Индия. Show all posts

Friday, September 15, 2023

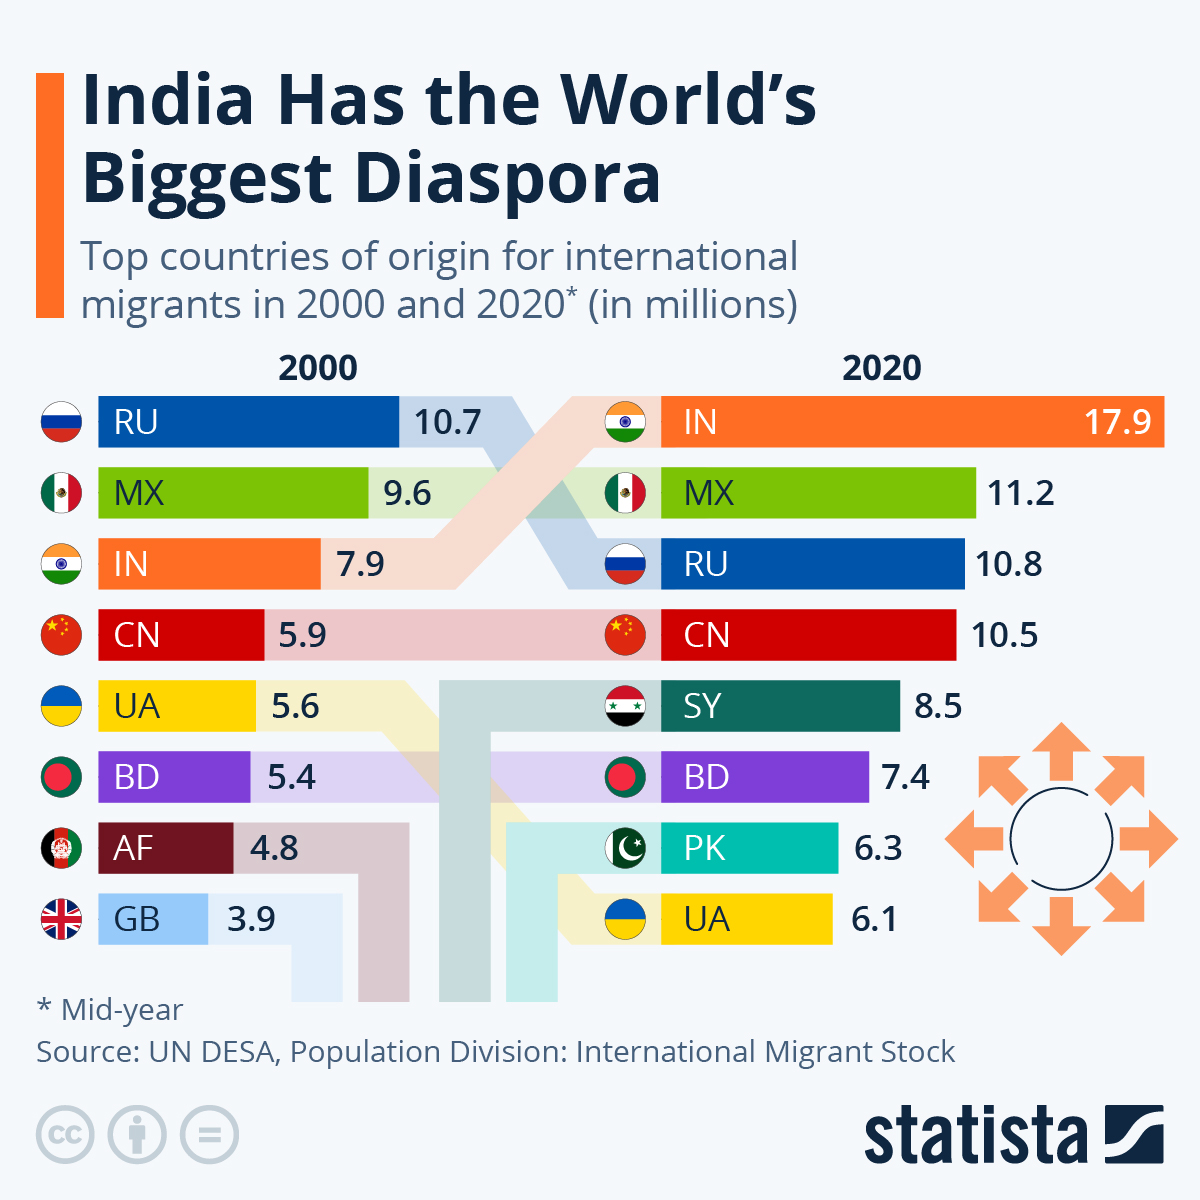
India Has the World's Biggest Diaspora

India had the most people living abroad of any country worldwide in 2020, according to the UN’s latest data published in the World Migration Report 2022. Just under 17.9 million born in the country were recorded as living overseas as of the mid-year. Mexico and Russia, also large countries with vast populations, came in second and third place with 11.2 million and 10.8 million living abroad, respectively.

This chart shows how India overtook Mexico and Russia between 2000 and 2020, with an incredible 10 million more Indians now living abroad than 20 years ago.

According to the report, in terms of the countries that Indians are relocating to, the nearby Gulf nations rank particularly highly, with the United Arab Emirates the favored location (3,471,300 recorded Indian migrants in 2020) and Saudi Arabia placing third (2,502,337). This is largely due to job prospects there. However, the United States also continued to attract millions of people, ranking second (2,723,764).

There were a total of 281 million international migrants recorded worldwide in 2020, up from 173 million in 2000 and 221 million in 2010. The 2020 figure equated to a world average of roughly 3.6 percent of people living outside of their country of origin.India Has the World's Biggest Diaspora

Saturday, August 26, 2023

BRICS countries: life expectancy at birth from 2000 to 2021

Globally, average life expectancy from birth has risen from 67.6 years in 2000 to 72.75 years in 2020. Of the BRICS countries, life expectancy in Brazil and China has been above the global average during this time, while India's and South Africa's have consistently been below, and Russia's was below until 2017. Life expectancy from birth has risen in all five BRICS countries over these two decades, although there was a drop of almost three years in South Africa between 2000 and 2005, due to the prevalence of HIV/AIDS, and a slight drop of almost half a year in Russia from 2000 to 2003, due to the prevalence of unhealthy lifestyles and alcohol/substance abuse.BRICS countries: life expectancy at birth from 2000 to 2021

Sunday, April 23, 2023

Why and where are deaths under-reported in India?

April 17, 2023 Krishna Kumar and Nandita Saikia

The outbreak of the Covid-19 pandemic highlighted the importance of accurately counting deaths, classifying them by age, sex, place of residence and cause. Although formally mandatory since 1969, death registration is still deficient in India, especially among certain groups, as Krishna Kumar and Nandita Saikia illustrate.


Introduction


The Covid-19 pandemic has once again highlighted the importance of accurately counting deaths, and of classifying them by age, sex, place of residence and cause, so that health officials and decision-makers can identify health threats and high-risk populations (Sakia et al., 2023; Sankoh et al., 2020).

India, the second most populated country of the world, enacted its Registration of Birth and Death (RBD) act in 1969, mandating universal registration within 21 days of a birth or death. Today, however, things are still far from perfect. For instance, in 2020, there were around 5.6 million and 4.6 million deaths, respectively, among Indian males and females according to United Nations estimates (United Nations, 2022), but the Office of Registrar General of India (2022) “missed” some 6% of female deaths in that year.

This calls for an understanding of the determinants of death registration in India. This is the topic of our recent study (Saikia et al., 2023) based on 84,390 individuals interviewed during the National Family Health Survey, 2019-21 (NFHS-5) (IIPS & ICF, 2021). Note, however, that we relied on interviewees’ reports of family deaths and their registration in the previous year, without checking death certificates: errors of various types are therefore possible. Besides, part of the data collection took place in the post-Covid period. Due to the government compensation scheme for Covid-related deaths, higher-than-normal death registration is likely to have occurred.

Death registration level varies by place of residence, region, state and district


Between 2019 and 2021, according to our sample data, slightly less than 71% of deaths were registered, on average, with higher rates in urban than in rural areas (83% vs 66%, respectively). In the latter, most adults are employed in informal sectors such as farming, construction work and fishing, which seldom provide social security (e.g. survivor’s pension). Low registration levels may reflect a lack of motivation, few incentives and poor access to death registration services.

Death registration coverage varies geographically, and is particularly low in the Northeast (64%), East (57%), and Central (56%) Indian regions (Figure 1).

Death registration level vary by demographic and socioeconomic characteristics


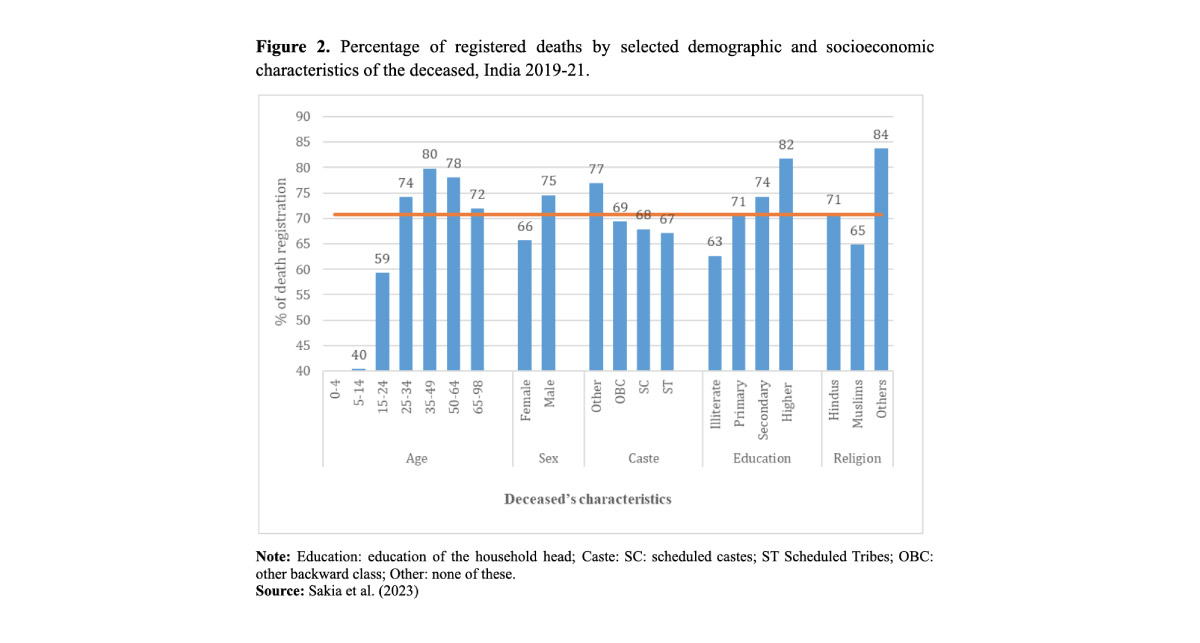
Registration levels are higher for deaths at older ages, e.g. about 78% at 50-64 years, and 72% at 65-98 years (Figures 2 and 3). Conversely, they are very low for children: merely 35% at 0-4 years. Sex differences are large: around 74% of male deaths are registered versus 66% of female deaths. This difference is linked, among other things, to two factors:
1) a lower proportion of women employed in the formal sector (see above) and
2) a higher proportion of accidental deaths among males. These are usually subject to police investigation, which increases the likelihood of registration (Adair et al., 2021).

Death registration was lower:


1) among the low-educated: 63% and 71% when the household head was, respectively, illiterate or had just primary education,
2) among Muslims (65%) than Hindus (71%),
3) among scheduled castes (or STs: 67%) than other castes (77%),
4) among poorer households (52% in the first income quintile; 87% in the fifth).

Conclusion


Death registration levels vary considerably by sex, age, place of residence and regions in India, and are influenced by socioeconomic variables. Periodic awareness programs may therefore be needed among vulnerable subgroups and in disadvantaged districts. Providing financial assistance for funeral rites, education loans to orphans, and social security to the deceased’s family members after reporting a death to a civil authority would probably prove helpful in increasing death registration coverage.

References

  • Adair T, Gamage USH, Mikkelsen L, Joshi R. 2021. Are there sex differences in completeness of death registration and quality of cause of death statistics? Results from a global analysis. BMJ Glob Health. 6(10):e006660. doi:10.1136/bmjgh-2021-006660
  • International Institute for Population Sciences (IIPS) and ICF 2021. National Family Health Survey (NFHS-5), 2019-21. IIPS: Mumbai, India.
  • Niti Aayog – SDG India Index. 2021.; 2021.
  • Saikia N, Kumar K, Das B. 2023. Death registration coverage 2019–2021, India. Bulletin of the World Health Organization. Feb 1; 101(2):102-10. doi: http://dx.doi.org/10.2471/BLT.22.288889
  • Sankoh O, Dickson KE, Faniran S, et al. 2020. Births and deaths must be registered in Africa. Lancet Glob Health. 8(1):e33-e34. doi:10.1016/S2214-109X(19)30442-5.
  • Setel PW, Macfarlane SB, Szreter S, et al. 2007. A scandal of invisibility: making everyone count by counting everyone. The Lancet. 370(9598):1569-1577. doi:10.1016/S0140-6736(07)61307-5
  • United Nations. Department of Economic and Social Affairs, Population Division 2022. World Population Prospect. 2022.

Source fugure 1: https://figshare.com/articles/figure/Death_Registration_Level_by_Sex/21724049

Monday, February 6, 2023

Reproductive burden and women’s employment in India

January 30, 2023 Chhavi Tiwari and Srinivas Goli

Low and declining female labour force participation in India has been a puzzle and a key policy question in the recent past. Chhavi Tiwari and Srinivas Goli argue that it depends on a particularly strong motherhood penalty. India needs more effective work–family reconciliation policies if female economic activity is to be sustained.

India’s female labour-force participation (FLFP) is low and has declined over time. It was just 20% in 2019, down from 25% in 2011 and 32% in 2005 (ILO, 2022). This has negative consequences both at the individual level (e.g., for women’s autonomy and households’ wellbeing) and at the macro level, as it slows down economic growth and cancels out the potential advantages of India’s current favourable age structure (the demographic “window of opportunity”; James & Goli, 2016; Goli et al., 2021).

Lack of appropriate data has made it difficult for researchers to understand the complex dynamics of the labour market, and to solve the puzzle of the low and declining female participation. In a recent article (Tiwari, Goli and Rammohan 2022), we used a panel dataset covering seven years to better investigate the issue. We focused, in particular, on the number of children “at home”, aged 0-14 years, because caring responsibilities tend to fall disproportionately on women, in India as elsewhere (Francavilla and Giannelli, 2011).

How do children influence women’s labour force participation?


FLFP in India has traditionally been higher among the poor, because women work out of necessity to contribute to household income. Things may be changing, however, as FLFP did not increase in this group between 2004–05 and 2011–12 (Figure 1). Conversely, it increased among non-poor women by 8%, reaching 28.1% in 2011–12. Across fertility levels, FLFP increased among childless women especially, from 19.6% to 35.5%, but much less among women with three or more children.

Children’s influence on FLFP can be better understood by relating women’s transition into and out of the labour market to their fertility transition. Having, and remaining at, a small number of children leads to greater labour market participation, as shown in Figure 1, with more women entering than leaving the labour market, both among the poor and the non-poor (Figure 2).
In our scientific article (Tiwari, Goli and Rammohan 2022), we estimated the net effect of the reproductive burden on labour market participation. Each (subsequent) child reduces the probability of working, but the effect is strongest for high parities, from the third child onwards. Note that this is not merely an association: there seems to be a truly causal effect of reproductive burden on labour market outcomes.

In the same analysis, we also found that living in larger household positively affects labour market participation among women with a large progeny, because other family members (especially elder women) can take care of young children. We also found that the motherhood penalty is highest for women belonging to Scheduled Castes / Scheduled Tribes (SC/ST) and for women with no formal education.

Conclusion


In India, women’s entry into, or exit from, the labor market is sensitive to changes in the number of their offspring, which suggests the need for stronger work-family reconciliation policies. India’s 2017 Maternity (Amendment) Bill tried to address this problem, by increasing the length of paid maternity leave for working women from 12 weeks to 26 weeks. However, its effects are limited, because this provision only covers mothers who work in the formal labour market, while approximately 84% of the female labour force is in the informal sector, with no access to maternity leave provisions (Williams, 2017).

Several policies to sustain and improve women’s labour supply and reduce the motherhood penalty, are already in place. These include the Anganwadi set up under the Integrated Child Development Services programme launched in 1975, that provide free services such as basic health care and pre-school activities for children in rural areas (Maity, 2006). Such initiatives need to be expanded and extended to urban areas, where declining labor supply has been a concern among economists.

The question of paternity leaves must also be addressed, to promote gender balance in childcare responsibility. In short, India needs stronger and better “work-family” policies, to enable women to reconcile the tension between maternity/childcare and employment.

Foot note


1 These are people who live in “absolute poverty” (below the so-called Tendulkar poverty line), which is based on (purchasing-power-adjusted) monthly per-capita consumption expenditure, and varies across states (Desai et al., 2010).

References

  • Desai, S. B., Dubey, A., Joshi, B. L., Sen, M., Shariff, A., & Vanneman, R. (2010). Human development in India. New York: Oxford University.
  • Francavilla, F., & Giannelli, G. C. (2011). Does family planning help the employment of women? The case of India. Journal of Asian Economics, 22(5), 412–426.
  • Goli, S., James, K. S., Singh, D., Srinivasan, V., Mishra, R., Rana, M. J., & Reddy, U. S. (2021). Economic returns of family planning and fertility decline in India, 1991–2061. Journal of Demographic Economics, 1–33. https://doi.org/10.1017/dem.2021.3.
  • International Labour Organization (ILO), ILOSTAT database. Data as of June 2022. https://data.worldbank.org/indicator/SL.TLF.CACT.FE.ZS?locations=IN
  • James, K. S., & Goli, S. (2016). Demographic changes in India: Is the country prepared for the challenge. Brown J. World Aff., 23, 169.
  • Maity, B. (2016). Interstate Differences in the Performance of” Anganwadi” Centres under ICDS.
  • Tiwari, C., Goli, S., & Rammohan, A. (2022). Reproductive burden and its impact on female labor market outcomes in India: Evidence from longitudinal analyses. Population Research and Policy Review, 1–37. https://doi.org/10.1007/s11113-022-09730-6.
  • Williams, C. C. (2017). Reclassifying economies by the degree and intensity of informalization: The implications for India. In Critical perspectives on work and employment in globalizing India (pp. 113–129). Springer, Singapore.

Tuesday, January 17, 2023

China’s first population fall since 1961 creates ‘bleaker’ outlook for country

Shift occurring nearly a decade ahead of forecasts heightens concerns over demographic time bomb

 
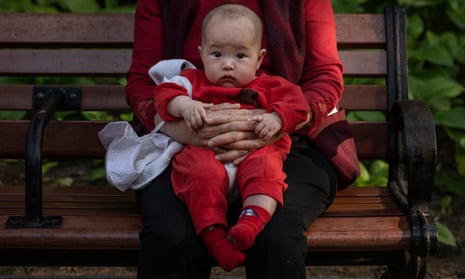
A woman holds a baby at a local park in Beijing, China. China’s population has shrunk for the first time since 1961.

Helen Davidson in Taipei and agencies Tue 17 Jan 2023

China has entered an “era of negative population growth”, after figures revealed a historic drop in the number of people for the first time since 1961.

The country had 1.41175 billion people at the end of 2022, compared with 1.41260 billion a year earlier, the National Bureau of Statistics said on Tuesday, a drop of 850,000. It marked the beginning of what is expected to be a long period of population decline, despite major government efforts to reverse the trend.

Speaking on the eve of the data’s release, Cai Fang, vice-chairman of the Agriculture and Rural Affairs Committee of the National People’s Congress, said China’s population had reached its peak in 2022, much earlier than expected. “Experts in the fields of population and economics have predicted that by 2022 or no later than 2023, my country will enter an era of negative population growth,” Cai said.

China’s government has for several years been scrambling to encourage people to have more children, and stave off the looming demographic crisis caused by an ageing population. New policies have sought to ease the financial and social burdens of child rearing, or to actively incentivise having children via subsidies and tax breaks. Some provinces or cities have announced cash payments to parents who have a second or third child. Last week the city of Shenzhen announced financial incentives that translate into a total of 37,500 yuan ($5,550) for a three-child family.

However after decades of a one-child policy that punitively discouraged having multiple children, and rising costs of modern living, resistance remains among couples.

At a press conference on Tuesday, Kang Yi, head of the National Bureau of Statistics, said China’s overall labor supply still exceeded demand, and people should not worry about the population decline.

China is on track to be overtaken by India as the world’s most populous nation.

Last year’s birthrate was 6.77 births per 1,000 people, down from a rate of 7.52 births in 2021, marking the lowest birthrate on record. In real numbers, there were more than one million fewer registered births in 2022 than the previous year’s total of 10.62 million.

The country also logged its highest death rate since 1976, registering 7.37 deaths per 1,000 people compared with a rate of 7.18 deaths in 2021.

Cai said China’s social policies needed to be adjusted, including aged care and pensions, a national financial burden which would worsen in the future and impact China’s economic growth.

Online, some Chinese people were unsurprised by the announcement, saying the social pressures which were driving the low birthrate still remained.

“Housing prices, welfare, education, healthcare – reasons why people can’t afford to have children,” said one commenter on Weibo.

“Now who dares to have children, housing prices are so expensive, no one wants to get married and even fall in love, let alone have children,” said another.

“Not talking about raising social security, only talking about raising the fertility rate, it’s all just crap.”

On Tuesday China’s government also announced the GDP had grown 3% in 2022. That figure would mark one of the slowest periods of growth in decades, but was still higher than predicted, prompting some scepticism among analysts given the incredibly stringent zero-Covid658шг restrictions in place during the fourth quarter.

China’s stringent zero-Covid policies that were in place for three years before an abrupt reversal which has overwhelmed medical facilities, have caused further damage to the country’s bleak demographic outlook, population experts have said.

Yi Fuxian, an obstetrics and gynaecology researcher at the University of Wisconsin-Madison and expert on China’s population changes, said the decline in population was occurring almost a decade earlier than the country’s government and the United Nations had projected.

“Meaning that China’s real demographic crisis is beyond imagination and that all of China’s past economic, social, defence, and foreign policies were based on faulty demographic data,” Yi said on Twitter.

“China’s demographic and economic outlook is much bleaker than expected. China will have to undergo a strategic contraction and adjust its social, economic, defence, and foreign policies. China will improve relations with the West.”

India faces deepening demographic divide as it prepares to overtake China as the world’s most populous country

Thursday, January 12, 2023

Labour force participation among older adults in India


India’s economic sector faces a reckoning with its ageing population. Aparajita Chattopadhyay and David E. Bloom‘s analysis, based on the Longitudinal Aging Study in India (LASI), indicates that health is the main determinant of working into old age, making healthy aging a priority for the future of the country.

India’s population is getting older. Adults aged 60 years and above will outnumber children under 10 years of age by 2030, and will likely reach some 340 million (about 20% of the population) by 2050. India must therefore start to face the economic and health issues that accompany population ageing: among these, monitoring and possibly increasing labour market participation at mature ages. Unfortunately, until recently, due to the paucity of nationally representative data for the 60+ population, little was known about the work characteristics and the determinants of work among older adults in India: only that it is mainly in the informal labour market, with low social security coverage and low female participation.

Work characteristics of older adults in India


To learn more about this population subgroup, the Longitudinal Aging Study in India (LASI) was launched in 2017, interviewing over 73,000 respondents aged 45 and above, and their spouses regardless of age. Questions were asked about health, healthcare access and utilization, work status, family and social support, social insurance coverage, retirement pension, and economic situation across 36 states and union territories of India (IIPS 2020). In a recently published paper, we analysed these data (except for the State of Sikkim), and found several interesting results (Chattopadhyay et al., 2022). For instance, only some 36% of older adults (here defined as those aged 60 years and over) are engaged in income-generating activities (50% if they are men), 38% have worked in the past but then stopped, and the remaining 26% have never worked (almost 50% if they are women).

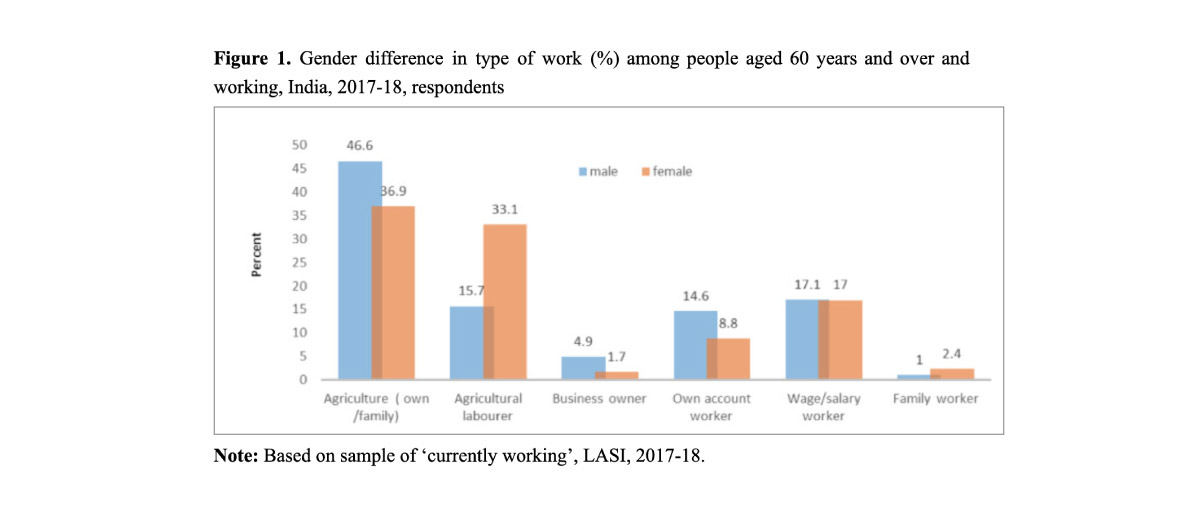
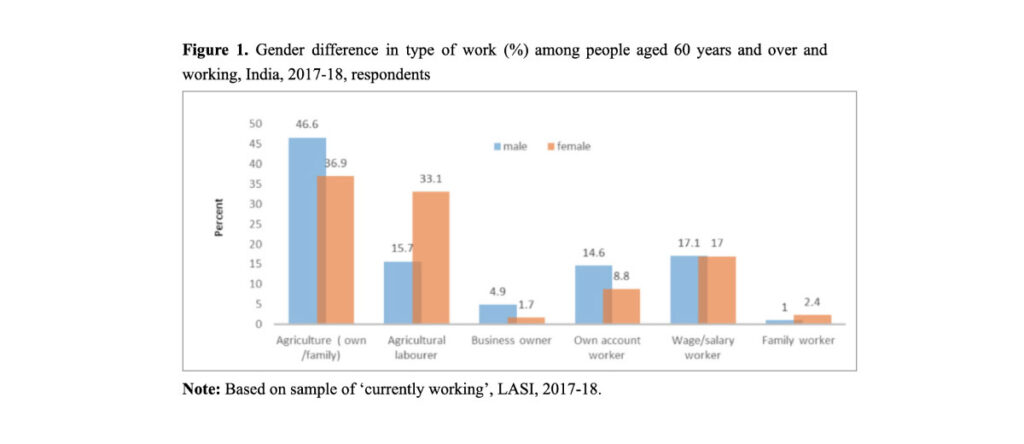
Among older adults who are working, a mere 5% have full-time jobs, and only 25% have documentary evidence of their current work, indicating a predominance of the informal sector in the Indian economy. Approximately 33% of older women are agricultural labourers, as opposed to 16% of older men, while in all the types of work that indicate “ownership of wealth” (i.e., farm owner, own business, own-account worker), men prevail (Figure 1) (Chattopadhyay et al., 2022).
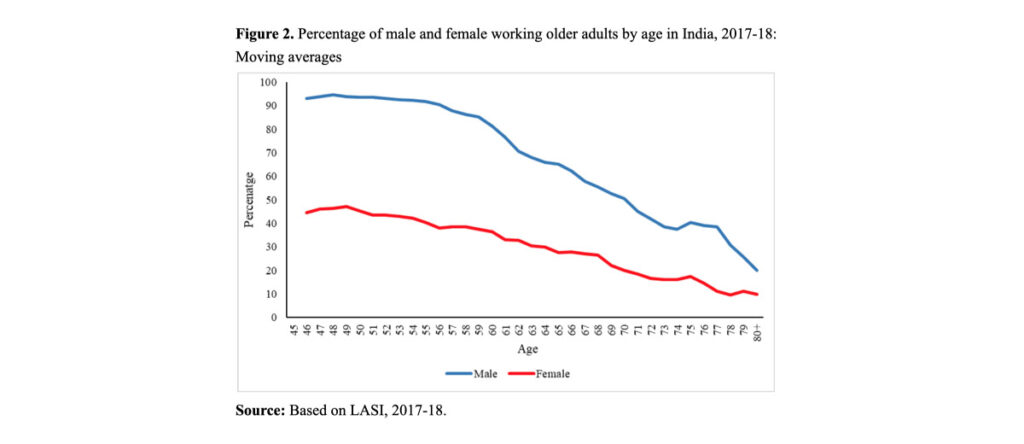
Pension coverage is rare: it benefits only about 12% of older men and 3% of older women, among those who are working or worked previously. Contrary to the popular belief that workforce participation starts to decline beyond age 60, LASI data reveal that this happens much earlier in India, especially for women (Figure 2).
Gender, wealth, education, and work


In India, women are less likely to work than men, in part for health reasons (Chattopadhyay & Roy, 2005) but most importantly because they are traditionally in charge of household chores. Contrary to expectations, female work participation is lower among educated women and in urban areas: this may indicate lack of opportunities (Vyas, 2020), mismatch between workers’ skills and job requirements, and increased family (female) responsibilities in urban areas, where support from kin and neighbours is rarer.
 
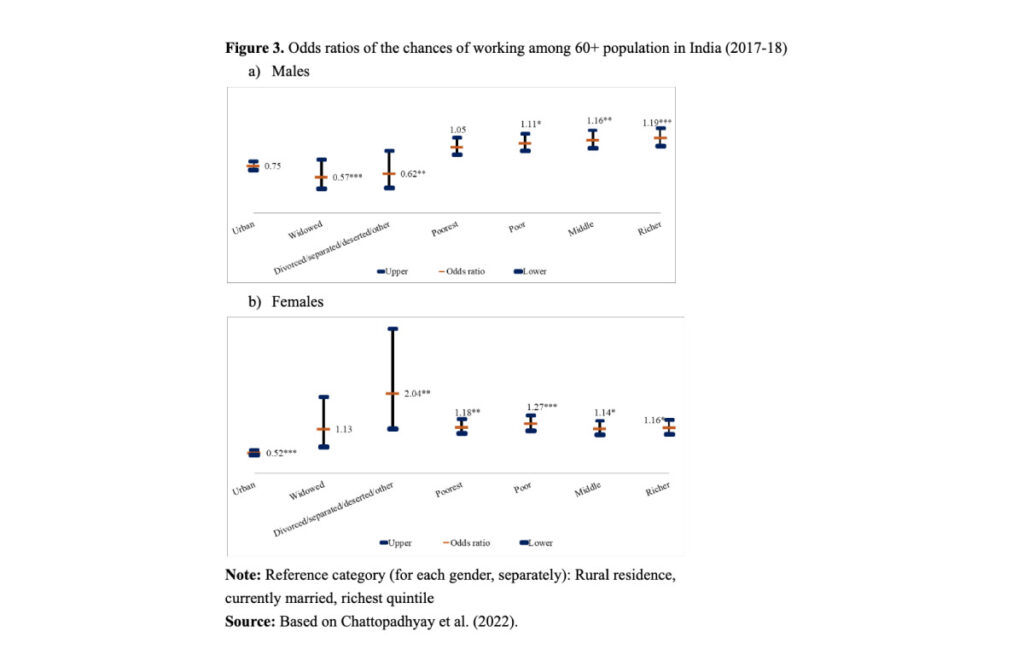
However, poor, rural, and divorced/separated/deserted older women are significantly more likely to work than men in similar conditions, evidently because their economic conditions are less favourable (Figure 3).

Labour force participation among Indian older adults is lowest among the richest and the poorest, but for different reasons. The former, mainly engaged in white collar, well-paid jobs in their adult years, benefit from better pension/health insurance coverage and do not need to work. The latter, instead, must frequently stop working because of poor health.
Family, residence, health and work


Older adults who live with their (adult) children are less likely to work beyond age 60. This is largely because they are either in need of care from close kin or, if they are healthy, they provide care themselves, to their grandchildren: about 25% provide childcare, as compared to a mere 10% of older adults who do not live with their children (IIPS, 2020).

In general, rural older adults are more likely to work than their urban counterparts (Figure 3), due in part to the opportunity to engage in farming and allied activities, and in part to the lack of social security benefits, as their past earnings were low and insufficient to generate significant savings or pension contributions.

Health is a stronger predictor of work status in rural than in urban areas. Rural older adults with chronic ailments are 43% less likely to work than their healthy rural counterparts, whereas urban older adults with chronic ailments are “only” 31% less likely to work than their healthy urban counterparts. This may be due to the rural population’s limited access to health facilities, resulting in untreated ailments that prevent older adults from engaging in agricultural and other labour-intensive work. In urban settings, better access to health services and medication may lessen the effect of health on work participation at older ages (Jana & Chattopadhyay, 2022).

Conclusions


A key question when considering older adult employment in India is whether work in old age indicates deprivation. The answer is mixed. The affirmative response corresponds to the engagement of older Indian adults in part-time jobs, in agriculture and in the informal sector with relatively lower income. In addition, with educational attainment, familial support, and better social security coverage, people are generally less likely to work in old age, indicating that financial insecurity may be the reason why Indian older adults continue to work.
However, it should also be noted that healthy older Indians are likely to work beyond the age of 60, possibly indicating a desire to remain active in the labour market.

Elder employment has positive effects on youth employment, on the wellbeing of older workers, and on economies and societies in multiplicative ways (Jasmin & Rahman, 2021). This practice is in tune with the healthy and active aging initiative promoted by the World Health Organization, and it should therefore be encouraged. India’s 1999 National Policy for Older Persons made positive steps in this direction, but the time has probably come to renew and relaunch that programme.

Acknowledgements


We thank Arunika Agarwal, Research Associate, Harvard T.H Chan School of Public health and Priya Maurya, PhD scholar of IIPS for their useful comments, and the funders of the Longitudinal Aging Study in India (LASI), i.e. Ministry of Health and Family Welfare, India and National Institute on Aging, US.

References

  • Chattopadhyay, A., Khan, J., Bloom, D. E., Sinha, D., Nayak, I., Gupta, S., Lee, J., & Perianayagam, A. (2022). Insights into Labor Force Participation among Older Adults: Evidence from the Longitudinal Ageing Study in India. Journal of Population Ageing, 15(1), 39–59. https://doi.org/10.1007/s12062-022-09357-7
  • Chattopadhyay, A., & Roy, T. K. (2005). Does retirement affect healthy ageing? A study of two groups of pensioners in Mumbai, India. Asia-Pacific Population Journal, 20(1), 89–115. https://doi.org/10.18356/0ef4333e-en
  • International Institute for Population Sciences (IIPS), National Programme for, Health Care of Elderly (NPHCE), MoHFW, & Public Health (HSPH) and the University of Southern California (USC). (2020). Longitudinal Aging Study in India (LASI) Wave 1, 2017-18, India Report. International Institute for Population Sciences, Mumbai. https://www.iipsindia.ac.in/lasi/
  • Jana, A., & Chattopadhyay, A. (2022). Prevalence and potential determinants of chronic disease among elderly in India: Rural-urban perspectives. PLOS ONE, 17(3), e0264937. https://doi.org/10.1371/journal.pone.0264937
  • Jasmin, A. F., & Abdur Rahman, A. (2021). Does Elderly Employment Reduce Job Opportunities for Youth? [Brief]. World Bank. https://openknowledge.worldbank.org/handle/10986/36170
  • Vyas, M. (2020). Impact of Lockdown on Labour in India. The Indian Journal of Labour Economics, 63(1), 73–77. https://doi.org/10.1007/s41027-020-00259-w
Thursday, December 8, 2022

Event, memory, metaphor

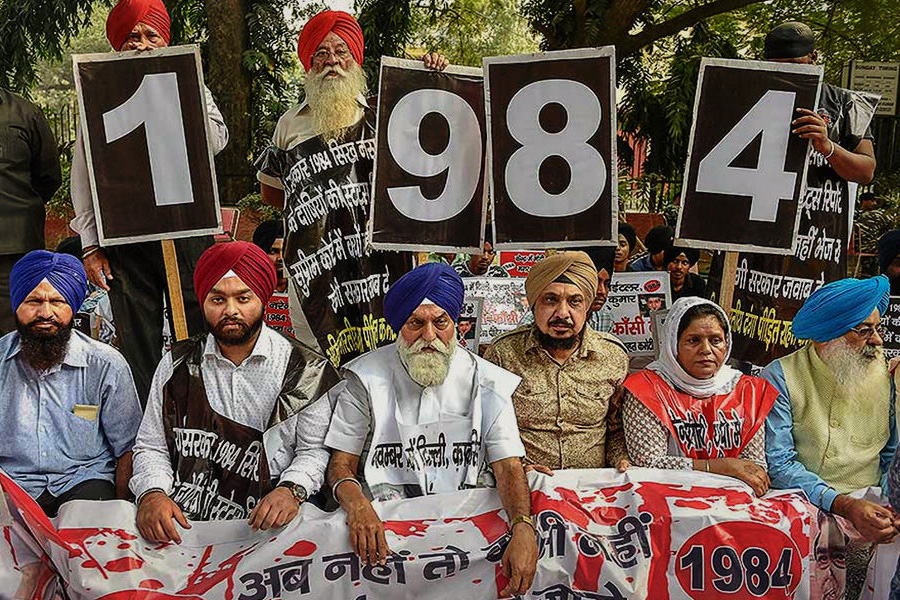
The 1984 anti-Sikh pogroms in India

Posted by Staff on November 23, 2022


Recording memories of the trauma of 1984, ethnographic research, witnessing, documenting, and archiving can be a powerful way to challenge dominant and singular narratives that erase the voices of survivors.


Author


Reeju Ray, Associate Professor, Jindal School of Journalism & Communication, O.P. Jindal Global University, Sonipat, Haryana, India.

Summary


In this essay, Jaspreet Singh’s novel Helium is read as a historical text alongside government reports of the pogroms, media reports of the event, and oral ethnographies of survivors of 1984. Helium offers an understanding of how the memory archive challenges continued impunity of perpetrators of state violence.

Impunity is embedded in the state’s judicial processes, in a lack of public accountability, in forgetting, and in repetition. The survivors present a profound challenge to impunity by their refusal to accept the logic of badla [что это?] or revenge.

Published in: Sikh Formations

To read the full article, please click here.

Tuesday, November 29, 2022

Child survival in India

Hindus now catching up with Muslims

November 28, 2022 Dibyasree Ganguly and Srinivas Goli

Until recently, child survival in India was lower among Muslims than among Hindus, despite the lower average socio-economic status of the former. Dibyasree Ganguly and Srinivas Goli note that this was due to a compositional effect (more Scheduled Castes and Scheduled Tribes among Hindus) and that the gap has now virtually disappeared.


Despite being socially and economically disadvantaged (e.g., in terms of education and wealth), for decades, Muslims in India experienced lower child mortality than Hindus. This “paradox”, long discussed in the specialized literature (e.g. Bhalotra et al., 2010; Guillot & Allendorf, 2010), has been attributed to various socio-economic and religion-specific cultural factors, such as better sanitation practices and a higher percentage urban among Muslims, and son preference among Hindus. However, we argue below that this is, at best, only part of the explanation.
This child-mortality gap between Hindus and Muslims has shrunk over time, and is barely noticeable today (IIPS & ORC Macro, 1995; IIPS & ICF, 2017).

Why are Hindus catching up with Muslims?


In 1992-93, under-5 (or child) survival was markedly lower among Hindus than among Muslims and other religions (Figure 1). Over time, however, as child survival improved for all religions, Hindus (in blue) progressively caught up with other groups, and notably with Muslims (in brown), from whom they were virtually indistinguishable by 2015-16.

Part of the explanation must be sought in the caste system, a hierarchical social division of Indian society. People affiliated to lower caste groups such as Scheduled Castes (SCs) and Scheduled Tribes (STs) have historically been oppressed, and forced to live in socio-economically and geographically marginalized locations. Not surprisingly, child mortality is higher among lower caste children (Dommaraju et al., 2008).
Fortunately, under-five mortality has declined markedly among all Indian groups and castes in the past 30 years or so, and within-group differences have declined very strongly (Figure 2). The trend has been more favourable for Hindus than for Muslims, both within the General castes (also called Upper or Other castes) and within in the others (SCs/STs). Hindus lagged behind in 1992-93, but their situation is now comparable (SCs/STs) or even better (General castes) than that of Muslims.
However, the structural composition of the two religious groups is markedly different. Among Hindus, SCs/STs represent a large and increasing share of the population (39% at the end of the period). Conversely, among Muslims they represent a mere 6%. The two factors (differential mortality by caste and different structural caste composition of the two religious groups) explain both the initial difference in child mortality between Hindus and Muslims, and its evolution over time.
Maternal and child health programmes have played a key role in improving in child survival in India, especially among SCs/STs, and, for structural reasons, this has benefited Hindus in particular (Goli et al. 2020; Ganguly, Goli, & Rammohan 2022).

A few key maternal and child health indicators, for instance, while evolving favourably for all groups, have progressed most notably for SCs/STs, especially among the Hindus, whose internal differences in this respect have considerably shrunk. For instance, the gap between SC/STs and other castes in the share of pregnant women receiving at least four antenatal visits declined from 12.6% to 3.3% among Hindus between 1992 and 2021, but not among Muslims. During the same period, the caste-wise gap in births in a health facility fell more than three-fold among Hindus, but much less so among Muslims, and the same holds for full child immunization (Table 1).

To conclude


Progress in socio-economic and demographic factors, and in maternal and child health care utilization in India, especially after the launch of the Reproductive and Child Health programme in the mid-1990s, has been the driving force in closing the gap between Hindu and Muslim child survival. From a policy perspective, two important conclusions emerge.
First, in comparing child survival across different socio-economic or religious groups, the structural composition of these groups, e.g. in terms of castes, must be taken into account. Second, both socio-economic and maternal and child health care policies play a key role not only in improving standards of living on average, but also in closing the gaps across subpopulations.

References

  • Bhalotra, S., Valente, C., & Soest, A. V. (2010). The puzzle of Muslim advantage in child survival in India. Journal of Health Economics, 29(2): 191–204.
  • Dommaraju, P., Agadjanian, V., & Yabiku, S. (2008). The pervasive and persistent influence of caste on child mortality in India. Population Research and Policy Review, 27(4): 477–495.
  • Ganguly, D., Goli, S., & Rammohan, A. (2022). Explaining the diminishing of Muslim advantage in child survival in India. Genus, 78(1): 1–42.
  • Goli, S, Moradhvaj, James KS, Singh D, Srinivasan V. Road to family planning and RMNCHN related SDGs: Tracing the role of public health spending in India (2020.) Glob Public Health. Apr;16(4): 546–562.
  • Guillot, M., & Allendorf, K. (2010). Hindu-Muslim differentials in child mortality in India. Genus, 66(2).
  • International Institute for Population Sciences (IIPS) and ORC Macro. (1995). National Family Health Survey (NFHS-1), 1992–1993, IIPS, Mumbai, India.
  • International Institute for Population Sciences (IIPS) and ICF. (2017). National Family Health Survey (NFHS-4), 2015–2016, IIPS, Mumbai, India.

Friday, November 4, 2022

The educational hypogamy puzzle in India

October 31, 2022 Koyel Sarkar

Status exchange is a leading factor behind the rising share of educational hypogamy marriages in India (women marrying less educated men), says Koyel Sarkar. Lower caste women aspire to upward mobility by caste, while higher caste women look for husbands with good employment status. Men with these desirable characteristics may “qualify for the job”, even if their educational level is low.


Background


As the gender educational gap shrinks, homogamy, i.e. a woman marrying an equally educated husband, eventually takes over hypergamy (a woman marrying a higher educated husband) (Kalmijn and Flap 2001). Hypogamy (marrying a less educated husband), on the other hand, is a distinguishing feature of western societies, where the gender gaps have reversed and women have become more educated than men (Van Bavel 2012).

In India, female education has increased at a faster rate than men’s over recent decades: according to DHS estimates (2019–21), “no education” among women decreased from more than 54% in 1971 to less than 12% in 2003, and in the same period “secondary education” increased from 26% to 76%. However, women are still less educated than men: literacy rates, for instance, were 71.5% for females and 84.3% for males in the 2019–21 DHS Indian survey.

It is therefore surprising to observe that hypogamy has increased from 5% to 35% over four decades of marriage cohorts (Figure 1). How can this be explained?

Theoretical background


Relatively little is known about couple formation in India, and the question arises as to whether the “status-exchange” theory applies. According to this theory, individuals lacking a characteristic that they consider desirable tend to marry partners with precisely that characteristic – and as this quest for “improvement through marriage” applies to both genders, status exchange takes place, each partner bringing to the couple something that the other partner lacks and deems valuable (Davis 1941). In India, increasing educational hypogamy, particularly among the lower caste groups, and an overall rise in caste exogamy (Ahuja 2016; Sarkar and Rizzi 2020; Sarkar 2022) suggest that status exchange mechanisms could be the potential driver.

Caste, education and occupation


Caste is a unique, very ancient feature of the Indian society. Although formally abolished in 1947, in practice it continues to operate, especially in rural settings and for certain social practices, such as marriage. The system is very complex, with thousands of castes and sub-castes, characterized by endogamy and social hierarchy (Ahuja 2016).

For our purposes, let us just focus on four large groups:

1) general castes, i.e. all those not listed below. These are relatively affluent and at the top of this reduced hierarchy
2) the less privileged caste groups, which can be broken down into three categories, in decreasing hierarchical order:
2.a) other backward classes (OBC),
2.b) scheduled castes (SC), and
2.c) scheduled tribes (ST).

Female education in India seems to play a peculiar role. It is not of great help to women in the labour market, where their participation is limited and irregular, even when they do have some education (Chatterjee 2018). Instead, in the marriage market, educated women are preferred because of their greater abilities in caring for children and managing household health. Thus, trading higher educational status for upward caste mobility seems to be a profitable strategy, especially for women from lower castes. Women who belong to higher caste groups, on the other hand, have little incentive to marry a higher caste husband: in their case, a better-employed or a financially secure husband may be more attractive.

For men, given that the caste system is traditionally patrilineal, a highly educated wife is desirable, irrespective of her caste
Empirical data indeed show a positive correlation across marriage cohorts: greater proportions of women marrying low-educated husbands coincides with husbands belonging to higher castes, (Figure 2, left panel) and holding more prestigious (and better paid) jobs (Figure 2, right panel).

The general preference for all education-caste-occupation subgroups is to marry within the same caste. However, the odds of marrying a higher-caste husband are highest for educational hypogamy (Figure 3; ORs: 1.3**, secondary axis). Additionally, when all husband-wife caste pairs are considered for each caste-wise assorted group, the highest odds are for caste hypergamous pairs: among the ST (ORs: 2.5**), SC (ORs: 2.0**), and OBC (ORs: 2.0***), women “marrying up” to general caste husbands. In addition, higher caste women who “marry down” both by education and caste are actually “marrying up” by occupation, when the pairs are further decomposed by partner’s occupation (Sarkar 2022).

Conclusions


Socio-economic status exchange by caste, education, and occupation seems to be at work in the Indian marriage market, and it may explain the increase in educational hypogamy. Education-caste exchange applies to lower caste women while education-occupation exchange applies to higher caste women. As such, the social and/or economic incentives are specific to the caste rank to which the women belong.

Status exchanges in Indian marriages are blurring the traditionally rigid caste boundaries, thanks to women’s higher educational achievements. Unfortunately, however, the factors behind these exchanges run counter to the expectation that education leads to empowerment. Despite often being better educated than their partners, Indian women seek economic advantages through their prospective husbands rather than engaging in the labor market themselves. This is a consequence of the conservative norms that discourage Indian women from working. Secondly, the desire for upward social mobility by caste shows that social inequalities are not necessarily diminishing, and that they still play an important part in the workings of the marriage market.
 

References

  • Ahuja, A. and Ostermann, S.L. (2016). Crossing caste boundaries in the modern Indian marriage market. Studies in Comparative International Development. 51(3): 365–387. Doi:10.1007/s12116-015-9178-2.
  • Chatterjee, E., Desai, S., and Vanneman, R. (2018). Indian paradox: Rising education, declining women’s employment. Demographic Research 38(31): 855–871.doi:10.4054/DemRes.2018.38.31.
  • Davis, K. (1941). Intermarriage in caste societies. American Anthropologist 43(3): 376–395. Doi:10.1525/aa.1941.43.3.02a00030.
  • Kalmijn, M. and Flap, H. (2001). Assortative meeting and mating: Unintended consequences of organized settings for partner choices. Social Forces 79(4): 1289–1312. Doi:10.1353/sof.2001.0044.
  • Sarkar, K. and Rizzi, E.L. (2020). Love marriage in India. Démographie et sociétés. Louvain la Neuve, Université Catholique de Louvain. (Document de travail 14).
  • Sarkar, K. (2022). Can status exchanges explain educational hypogamy in India?. Demographic Research, 46(28), 809-848. Doi:10.4054/DemRes.2022.46.28.Van Bavel, J. (2012). The reversal of gender inequality in education, union formation and fertility in Europe. Vienna Yearbook of Population Research 10: 127–154. doi:10.1553/populationyearbook2012s127.

Friday, October 28, 2022

How to make India's National Family Health Survey more gender-sensitive

India's five rounds of the National Family Health Survey (NFHS) have provided large datasets with which to monitor progress on household sanitation, health and nutrition of women and children, and even the empowerment status of women. Whether these data accurately represent the condition and position of women in India is questionable.

The NFHS records data about couples and specifically on women's household decision making, mobility, use of a bank account and mobile phone, home or land ownership, and barriers to medical treatment, all of which are considered empowerment indicators for women. Each couple receives one survey. In a stereotypical patriarchal society where the man is usually head of the household, most respondents are men. A couple's record therefore often misses the women's point of view. The latest survey, NFHS-5, misses to a large extent woman's outcomes, and this might reflect women's voices in society generally.

In reality, data collected by the survey generate evidence for policy making only from men's perspectives. Hilary Graham argues that the survey method treats all individuals as being equal, and the subjectivity involved in framing questions for a survey might not fit a woman's answer to the question.

Gender perspective should be considered early in the survey system, from composing questions and designing survey tools to sensitising the administrators and data entry operators to analyse data about women. Creating an encouraging environment for women to respond to the survey is the prerequisite for women's participation in the survey. The complete set of NFHS questionnaires needs to be evaluated from a gender perspective.

Identifying gender-specific or differentiated data from the available data sources is difficult because of the limited policy space, poor coordination, and restricted resources, all of which are barriers to the development of additional gender data. Monitoring progress towards the Sustainable Development Goals will be difficult without gender-segregated differential data. Timely and accurate information about the status of women and girls is crucial for determining whether they are gaining from the activities designed to realise the 2030 agenda, particularly those activities that directly target gender equality.

Wednesday, August 31, 2022

Sex-selective abortion in India: an ongoing problem


In India, the percentage of male births has increased since the mid-1980s. Claus Pörtner ties the continuously growing use of prenatal sex selection to India’s falling fertility among highly-educated women. He shows how sex selection substantially lengthens birth intervals, which, in turn, is responsible for a significant downward bias in the total fertility rate compared to predicted cohort fertility. Less-educated women still have relatively high fertility and short birth intervals when they have no sons, negatively affecting girls’ survival chances.


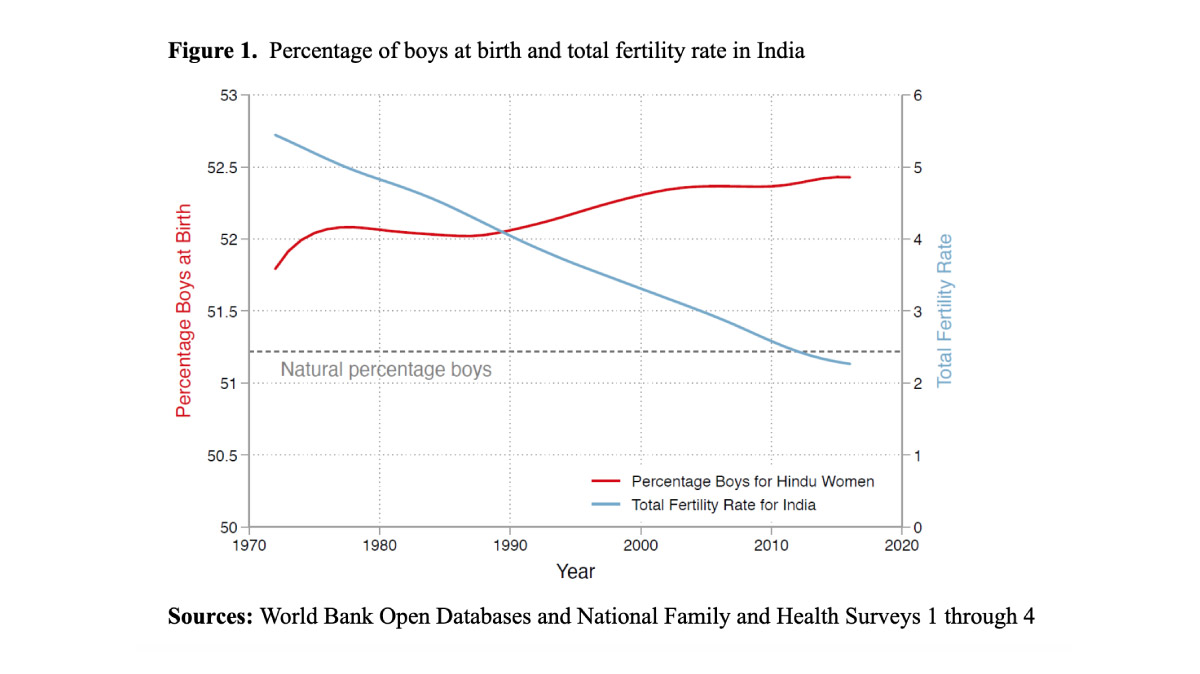
With the introduction of ultrasound in the mid-1980s, use of sex-selective abortion spread rapidly in India, as shown by the steadily increasing percentage of boys in Figure 1. However, access to pre-natal sex determination does not necessarily lead to sex selection. Rather, in India, the practice is driven by the combination of declining fertility (also shown in Figure 1) and the particular Hindu preference for a son. However, once that son is secured, there is no clear son preference for subsequent births (Jayachandran, 2017; Pörtner, 2015). If a family is willing to have up to six children, there is a 99% probability of achieving the goal of one son. But if the desire is for one son and a maximum of two children, about 25 percent of families must use sex selection to achieve both targets.

Three critical aspects


As striking as these overall numbers are, they obscure three critical aspects of the changes in India:
• first, the massive differences in use of sex-selective abortion across education levels that followed the availability of pre-natal sex determination;
• second, significant differences in use of sex selection by parity;
• third, the increase in birth intervals brought about by sex selection, which, in turn, has led to substantial overestimation of the rate of fertility decline in India.

In a recent paper, I use data from India from 1972 to 2016 to examine how fertility, sex ratio, and birth spacing changed by education level with the spread of sex selection (Pörtner, 2022). The data comes from the first four National Family and Health Surveys. I focus on Hindu women because Hindus constitute about 80% of India’s population and have shown stronger son preference and higher use of sex selection than Muslims.

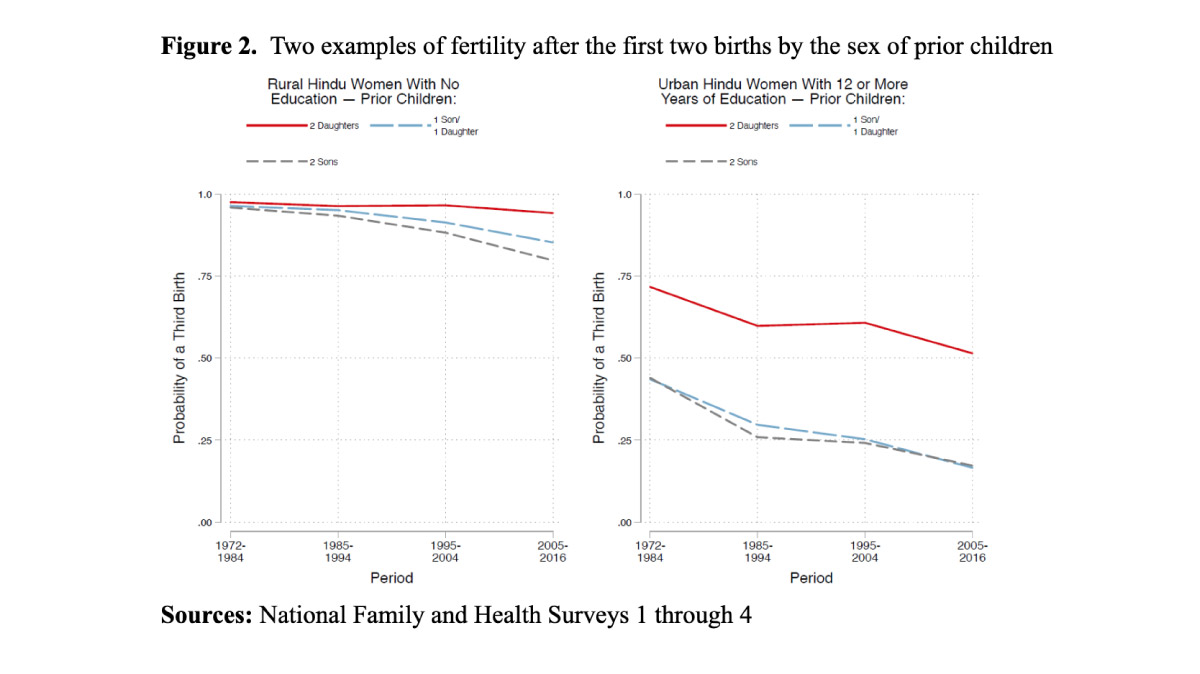
To illustrate some of the results, Figures 2 to 4 show the probability of a third birth, the percentage of boys among third births, and the 75th percentile birth intervals after the second child for rural women with no education and urban women with 12 or more years of education. These two groups represent the extremes in India and exemplify the divergent behaviors in response to son preference. Currently, the two groups constitute approximately 15% and 20% of the female Hindu population, respectively. The graphs for the other groups are available in Pörtner (2022). The analyses cover four periods: 1972–1984, 1985–1994, 1995–2004, and 2005–2016.

Fertility is falling, but son preference still affects the likelihood of a subsequent birth


First, consistent with declining overall fertility, the likelihood of a subsequent birth has decreased over time for all parities. However, the probability of having another child remained higher for women without sons than for women with one or more sons, showing that son preference remains strong in India.

Consistent with these general trends, both groups of women shown in Figure 2 are less likely to have a third child, but are more likely to do so if they already have two daughters than if they have one or two sons. However, more than 75% of rural women with no education still have a third birth whatever the sex of their prior children. This contrasts with highly educated urban women, among whom less than 20% have a third child if they already have a boy, while more than 50% have a third child if they have only daughters.

The use of sex selection is not declining


Second, despite predictions that sex selection will eventually decline in India, there is no clear evidence to support this idea. The most likely users of sex selection—more highly educated women with no sons—continue to show substantial male-biased births. More worryingly, increasingly male-biased births among less-educated mothers suggest that sex selection is spreading as the fertility of this group declines.

The highly educated urban women in Figure 3 illustrate how the percentage of boys at birth increased for mothers with no sons as access to sex selection spread. For this group, we are fast approaching a situation where 80% of third births are boys, reflecting the fact that, as desired fertility declines, more and more women use sex selection to secure a boy before they stop childbearing.
The situation is very different for rural women with no education. Their fertility is still high, and the chance of having a son without sex selection is correspondingly high. Hence, there is still no evidence of sex selection for this group, although this might change in the future as fertility declines further.

Modest increases in birth intervals, except with sex selection


Based on the percentage of boys at birth, we can split Hindu births into two broad groups. The first group, without evidence of sex selection, includes births to highly educated mothers with at least one son and all less-educated mothers whether or not they have a son. The second, with evidence of sex selection, includes births to more highly educated mothers with no sons.
For births where sex selection is not used, median birth intervals have increased relatively little—by only three to six months over the four decades—compared to around 3.5 months per decadein other countries with declining fertility (Casterline & Odden, 2016). Despite the absence of sex selection, there is still strong evidence of son preference, as illustrated by the shorter birth intervals when rural women with no education have only daughters than when they have at least one son.

What is more, a remarkably high proportion of birth intervals are still very short. Except among the most educated women, 25% or more have their second child within 24 months of their first, and a similar proportion have their third child within 24 months of their second. These intervals are substantially below the WHO recommended 24 months between pregnancies, resulting in significantly higher child mortality risk, especially for less-educated mothers (Bocquier et al., 2021; Pörtner, 2022).

The story is very different when sex selection is used. Highly educated mothers with no sons have substantial lengthening of birth intervals, further evidence of very significant use of sex-selective abortion. For example, among highly educated urban mothers with only daughters, the 75th percentile birth interval length is now nearly 70 months, a 21-month increase over four decades. Strikingly, more than 70% of this increase occurred in the first decade after the introduction of sex selection. Therefore, some mothers with no sons now have longer birth intervals than those with sons, reversing India’s traditional spacing pattern.

Spread of sex selection led to overestimation of fertility decline


One of the unappreciated effects of the rapid expansion of sex selection and the associated increases in birth intervals is that it makes the TFR a downward-biased estimate of cohort fertility (Bongaarts, 1999; Hotz et al., 1997; Nı́ Bhrolcháin, 2011). That is precisely what appears to have happened in India. The period fertility rate substantially overestimated the speed of cohort fertility decline in the 1990s and early 2000s, as spacing increased with the spread of sex selection. For example, the TFR for urban women with 12 or more years of education went from 2.1 to around 1.6 with the introduction of ultrasound sex determination, but predicted cohort fertility declined only from 2.3 to 2.1. Although the two fertility measures have recently partly converged, predicted cohort fertility is still 10-20% higher than the period fertility rate.

These results paint a less rosy picture of India’s prospects for a continued reduction in population growth than generally accepted. With predicted cohort fertility still substantially higher than the period fertility rate, India’s TFR will likely stabilize or even increase as birth intervals lengthen more slowly. Perversely, the more successful our attempts at combatting sex selection, the greater the likelihood of an increase in the TFR. This increase stems partly from the shortening of birth intervals if sex-selective abortions are unavailable and partly from families needing more births to have at least one son.

References

Sunday, May 29, 2022

new old profession

альджазира
“Gangubai Kathiawadi"

Верховный суд Индии признал занятие проституцией профессией


В Индии занятие проституцией официально признали профессией. Таким образом Верховный суд страны постановил, что секс-работники обладают всеми правами, гарантированными конституцией, в том числе правом на юридическую защиту. Об этом со ссылкой на газету Asian Age пишет ТАСС

Решение суда обязывает сотрудников полиции воздерживаться от жестокости и насилия в отношении секс-работников и их детей. Также документ требует, чтобы СМИ обеспечивали конфиденциальность этих людей и не разглашали их персональные данные.

По мнению Верховного суда, работники секс-индустрии испытывают «всю тяжесть социальной несправедливости, связанной с их работой, устраняются на обочину общества, лишаются своего права на достойную жизнь и возможности обеспечить такое же право своим детям».

Что важно знать:

На данный момент занятие проституцией в Индии легализовано. По оценкам экспертов, в этой сфере работают около двух миллионов женщин. [а мужчин? чото гендерный перекос]

Monday, April 5, 2021

Indian marriage

1,5 миллиона индийских девочек каждый год насильственно выдают замуж за мужчин вдвое старше их, хотя это противозаконно [противозаконно, видимо, насильственно, но причом тогда вдвое старше, такого закона нет 100пудово]. Многие девочки при переезде к мужу теряют доступ к интернету и связь с родными, рожают слишком рано, из-за чего даже умирают. Пандемия только усугубила ситуацию с детскими браками и свела многолетнюю борьбу с ними к нулю [каким образом? тема пандемии не раз крыта]. Мы поговорили о происходящем в Индии с индианкой Дилной Раяз, которой удалось избежать принудительного замужества, и узнали, как правозащитные организации борются за права девочек:

«На последнем курсе Дилна заболела желтухой и вернулась домой, чтобы восстановиться и подготовиться к экзаменам на следующий год. Родителей это не устроило: они начали настаивать на том, чтобы дочь бросила учебу и вышла замуж. Дилну посадили под домашний арест, забрали телефон и стали добиваться согласия на брак. Когда девушка протестовала особо рьяно, отец брал ремень или бамбуковую палку и бил ее по спине. Так продолжалось три года»

Читать полностью

@snobru

Saturday, January 9, 2021

excess female child mortality

Published on N-IUSSP.ORG November 5, 2018

Counting excess under-5 female mortality in Indian districts


Christophe Z. Guilmoto, Nandita Saikia


Excess female mortality resulting from gender discrimination in the postnatal period was still common in India at the beginning of the century. Yet, little attention has been paid so far to its distinctive spatial patterns, that point to the presence of a large territory in north central India where high fertility, relative underdevelopment and staunch son preference combine to give rise to high levels of excess female mortality among girls below five. Christophe Z. Guilmoto and Nandita Saikia fill this gap.

The literature on “missing women” in Asia tends to focus on the female deficit due to prenatal sex selection and underplays the role of postnatal sex selection. One reason is that there is a sort of fascination with the idea that modern technologies can be used to implement ancient patriarchal forms of bias against girls and women.

Another reason is more technical. It is easy to evidence skewed sex ratios at birth with basic birth data, whereas signs of postnatal discrimination are far more blurred, at least ever since deliberate selective infanticide has disappeared from China and India. This is primarily due to the absence in many countries of reliable civil registration data that would otherwise allow for easy computation of mortality rates by age and sex. In addition, the very concept of “excess female mortality” and the way to calculate it are still debated, since existing series demonstrate that, in “normal conditions” (i.e., without discrimination), the expected male-female mortality ratio varies greatly by age and overall mortality level.

As a result, estimates usually require the use of heavy statistical machinery and lead to a single estimate of excess female deaths for an entire country (Alkema et al. 2014; Bongaarts and Guilmoto 2015; Costa et al. 2017). However, a single number cannot adequately reflect the situation of a country as diverse as India, where history and geography have shaped very different regional gender systems.

Estimating excess under-five female mortality


This consideration led us to focus on the existing demographic datasets describing India’s 640-odd districts. Among these, an often neglected source is the decadal census, and in particular the detailed, district-level fertility tables of its 2011 edition, which detail the number of newborns by sex and mother’s age (Fertility Series data F1, F5 and F9; Guilmoto et at 2018). We decided to test the strength of the classical Brass method, in which the proportion of surviving children by mother’s age can be used for estimating past infant and child mortality, taking into account age at childbearing, which varies by district. Under-five mortality is an ideal measure, since earlier studies have shown that most of the excess female mortality is concentrated during the first years of life, a period during which girls have a distinct biological mortality advantage over boys.

The procedures involved quite a few stages:¹ here, let us focus on the results. We found that the average level of excess mortality in girls aged 0–4 in 2000–2005 was no less than 18.5 per 1000 live births, translating into an average of 239,000 excess deaths of young girls per year. Around 22% of the overall female under-5 mortality is therefore due to gender bias. Incidentally, India narrowly missed Millennium Development Goal 4 on child mortality (about 2 units per 1000 live births). This implies that without excess female mortality, India’s Millennium Development Goal of reducing under five mortality (both sexes combined) from 125 per 1000 live births in 1990 to 42 by 2015 could have easily been achieved.

A map of gender discrimination


The situation at district level is depicted in Figure 1. What emerges, in particular, is the strong spatial patterning of excess female mortality on the Ganga River Basin in North central India. There is a large cluster of almost 60 adjacent districts in Madhya Pradesh, Uttar Pradesh, and Rajasthan where excess female mortality exceeds 30 per 1000 live births. In contrast, gender discrimination is much lower, even if not totally absent, in many states in the South and East of the country.

Beyond their unique geography around the Hindi belt, the districts where postnatal discrimination towards girls takes the heaviest toll in India tend to be rural, agricultural districts, characterized by high population density, high fertility, low social development and high son preference. On the contrary, excess female mortality weakens with increasing female education and the substantial presence of Muslim and tribal populations.

To understand the dynamics of gender bias, it is worth underlining that this map does not coincide at all with the more prosperous districts to the West of the country, from Punjab to Maharashtra, where prenatal sex selection is rife. Son preference and large families go hand in hand with excess female mortality. In contrast, the rapid fertility decline in Western India where the preference for male offspring remains pervasive has been accompanied by a skewed sex ratio at birth visible since the 1990s.

Conclusions


Excess female mortality resulting from gender discrimination in the postnatal period is a rarely studied phenomenon, and this, in our opinion, confers a special interest to our study and to Figure 1. It also reveals the distinct contours of the old discriminatory gender regime, characterized by high fertility and strong discrimination towards young girls. As the regional estimates of excess deaths of girls demonstrate, any intervention to reduce the discrimination against girls in food and health care allocation should therefore target in priority the regions of Bihar and Uttar Pradesh where poverty, low social development, and patriarchal institutions persist and investment in girls is limited.

The transition from postnatal to prenatal sex selection across districts is likely to extend soon to the large states of North India featuring on our map, where fertility is currently declining rapidly and economic progress is reaching even remote rural districts. This does not bode well for the future of the sex ratio at birth in India, and reinforces the need to address directly the issue of gender discrimination in addition to encouraging social and economic development that benefits Indian women.

References

  • Alkema L, Chao F, You D, Pedersen J, Sawyer CC. (2014) National, regional, and global sex ratios of infant, child, and under-5 mortality and identification of countries with outlying ratios: a systematic assessment. The Lancet Global Health. September 30;2(9):e521-30.
  • Bongaarts J, Guilmoto CZ. (2015) How many more missing women? Excess female mortality and prenatal sex selection, 1970–2050. Population and Development Review. June 1;41(2):241-69.
  • Costa JC, da Silva IC, Victora CG. (2017) Gender bias in under-five mortality in low/middle-income countries. BMJ Global Health. July 1;2(2):e000350.
  • Guilmoto CZ, Saikia N, Tamrakar V, Bora J (2018). Excess under-5 female mortality across India: a spatial analysis using 2011 census data. Lancet Global Health.

Foot notes


¹ We first obtained a series of under-five mortality rates by sex and district. We then used a set of existing life-tables drawn from countries with no gender bias to model the relationship between the sex ratio of under-five mortality and overall child mortality. Finally, we applied these standardized mortality sex ratios to our mortality estimates to derive excess under-5 female mortality for each district of India, and then converted this information into absolute numbers of excess female deaths. For more details, see Guilmoto et al. (2018).

Tuesday, September 29, 2020

We are recruiting

Saturday, July 25, 2020

Which Countries Are Deploying Coronavirus Tracing Apps?

России нет, потому что приложение было только в Москве, которая, как известно не...


The list of countries that are developing or that have released coronavirus tracing apps is extensive and according to tracking by the MIT Technology Review, close to 50 governments are currently implementing it. The technology was quickly seen as a potential way to limit the spread of the pandemic by identifying and notifying people who came into contact with carriers of Covid-19. Even though tracing apps have shown promise, they are highly controversial due to privacy concerns. The extent to which the apps collect user data varies considerably by country with China's system harvesting everything from citizens' identity, location and online payment history to Germany's Corona-Warn App which complies with Berlin's strict laws on privacy.

Despite the concerns, experts have said that the apps can indeed prove crticial in improving contact tracing and identifying chains of infection. The technology does have other weaknesses apart from privacy and one glaring one is that an app needs a large userbase. In Germany, it was initially stated that 60 percent of the population needed to install the Corona-Warn App but that figure was later dismissed by Health Minister Jens Spahn who said he would be satisfied if a few million users downloaded it. So far, 14 million Germans have installed the app and the coronavirus situation in the country remains largely under control, with some localized outbreaks contained in recent weeks.

Another weakness that has to be mentioned is that states are developing apps individually which means they are not compatible between countries. For example, if a German traveler departing Paris and arriving in Cologne tests positive for the virus at a German facility, no warning will be sent through the French contact tracing system to his or her contacts back in the capital. That may leave travelers with no option other than to install several apps (or to just stay at home if possible).

The patchwork individual approach to developing contact tracing apps is also evident within the borders of the United States where their introduction has been plagued with problems. There is no single app in development for the whole country - the decision to use one rests with public health authorities in different states. Apple and Google announced on April 10 that they are building contact tracing technology into their operating systems (Germany's app is based on their technology) but by mid-July, only four U.S. states said they will participate in the project. That's according to website 9 to 5 Mac who are tracking the situation at state level.
Infographic: Which Countries Are Deploying Coronavirus Tracing Apps? | Statista 

Sunday, May 31, 2020

Sir Waldemar Mordechai Wolff Haffkine, he invented anti-cholera and bubonic plague vaccines

Waldemar Haffkine 1964 stamp of India В контексте современной борьбы с новым инфекционным заболеванием, вызванным коронавирусом и охватившим весь мир, важно обратиться к опыту людей, спасших в свое время мир от чумы и холеры. Особенно вдохновляет исторический пример бактериолога Владимира Хавкина, у которого в 2020 г. сразу две памятные даты — 160 лет со дня рождения и 90 лет со дня ухода. Выросший в России, ученик и коллега великих ученых — И.И.Мечникова, Л.Пастера и Р.Коха, Хавкин приехал в Индию в 1893 г. при поддержке британской колониальной администрации, чтобы проверить эффективность вакцины против холеры, которую создал, работая в лаборатории Пастера в Париже, и провел в Индии более 20 лет (с перерывами). «Он спас жизнь миллионам» — так обычно пишут о Владимире Хавкине. И это правда, хотя он был не медиком, а зоологом, ставшим бактериологом. Хавкин верил в профилактику и сосредоточил свои исследования на разработке и производстве вакцин против чумы и холеры, которые тестировал прежде всего на себе. Статья, основанная на документах, хранящихся в личном архиве В.Хавкина в библиотеке Еврейского университета в Иерусалиме, посвящена неизвестным страницам жизни выдающегося бактериолога и филантропа, который имел много врагов и недоброжелателей и которому пришлось выдержать немало жизненных испытаний.

Сегодня мир вновь кардинально меняется под воздействием самых разных вирусов— биологических, идеологических, национальных. Может быть, и в России, которую Хавкин всегда считал своей родиной [он из Одессы, здрассьте], стоит вспомнить о его наследии и его уроках— нравственных и научных.

В Бердянске вспомнили о своём славном земляке и в 2005 г. установили бюст Владимира Ароновича у входа в главный корпус Бердянского педагогического института. Это – здание бывшей мужской гимназии, в которой начал свой долгий и непростой путь наш соотечественник, великий филантроп, национальный герой Индии («спаситель Индии»), кавалер Великобритании.

Saturday, January 25, 2020

The World's Largest Human Migration Is About To Begin

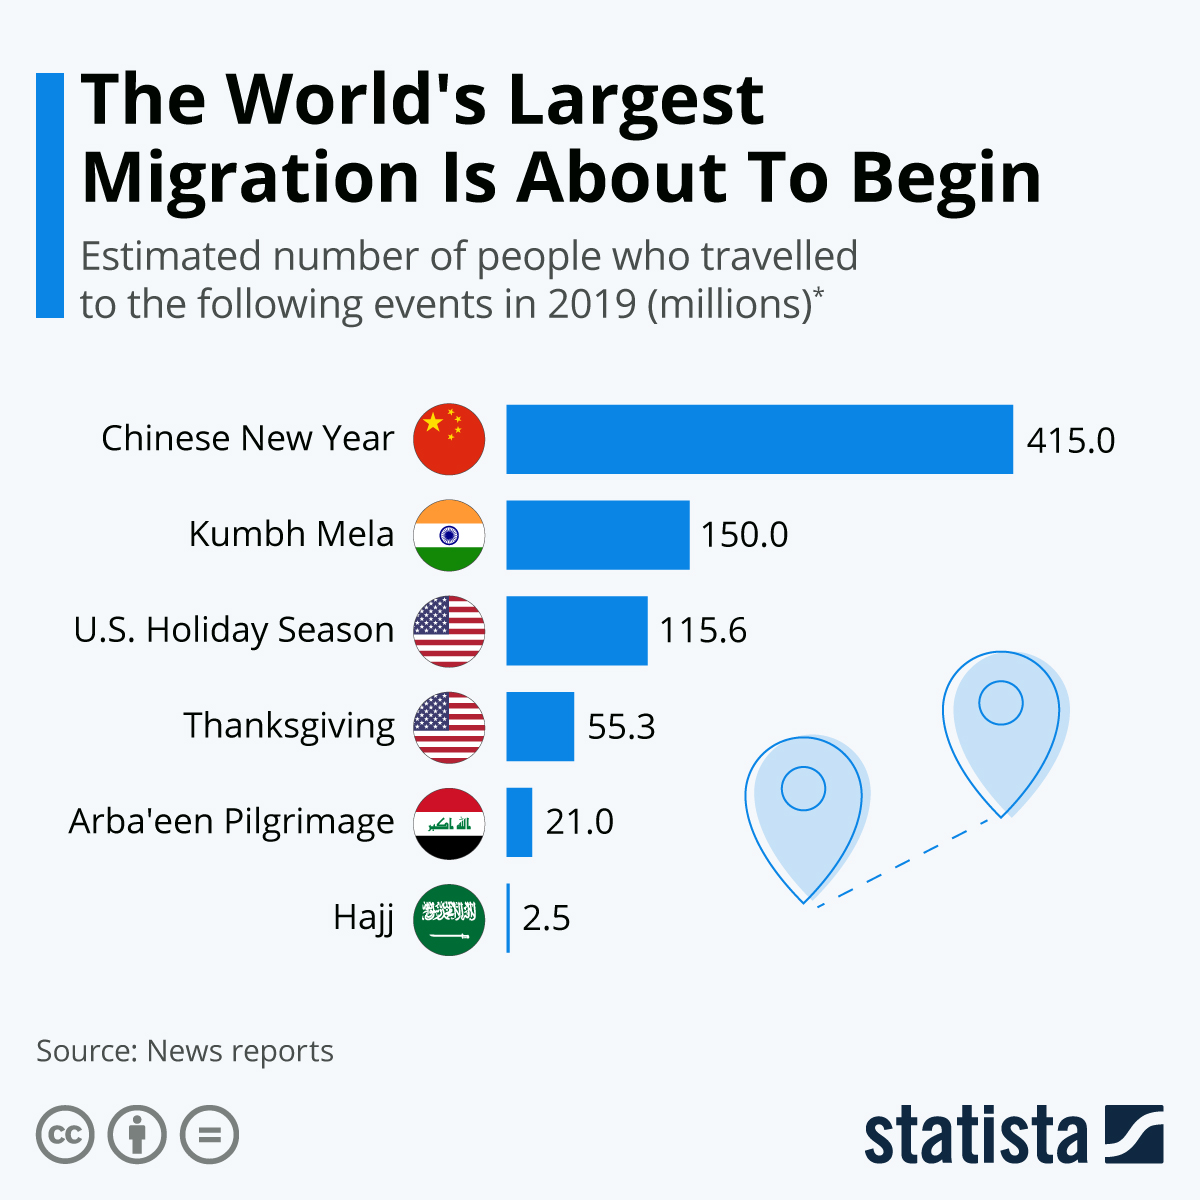
This Saturday, China is going to celebrate its new year, kicking off one of the planet's great migrations. Also known as Spring Festival or Lunar New Year, the event sees hundreds of millions of people leave their cities in order to visit their families in more rural parts of the country. In fact, practically all of China takes holiday at once, making the new year the biggest human event on earth. In 2019 the number who welcomed The Year of the Pig was approximately 415 million, according to the Chinese government.

Comparing China's largest annual migration with North America's two biggest movements of people is a good way to gauge its sheer size. An estimated 115.6 million Americans were on the move for Christmas and New Year in 2019 while 55.3 million people travelled during the Thanksgiving period. China's new year is still more than seven times bigger than Thanksgiving, though its massive population makes a big difference of course. Known as "chunyun", the annual new year migration in China also easily surpasses the world's biggest pilgrimages in scale with Arba'een and the Hajj not even coming close.
Infographic: The World's Largest Human Migration Is About To Begin | Statista