Showing posts with label жильё. Show all posts

Monday, September 2, 2024

us mortgage

Ипотека в США стала ещё доступнее, чем в России. 


Несмотря на постоянно растущие цены на недвижимость ежемесячный платёж в августе за дом средней площадью 230 квадратов упал до $2587 (237 тысяч рублей), это минимум с февраля этого года и даже меньше, чем в прошлом году, отмечают аналитики. Снижение платежей по ипотеке вызвано падением ставок в банках: сейчас они опустились до 6,5% годовых.

В крупных городах России средняя площадь жилья составляет 50 квадратов. По американским меркам, ипотечный платёж за такую недвижимость должен составлять $560, или 50 тысяч рублей. Но из-за рекордных ставок в российских банках платёж в регионах превышает 100 тысяч рублей в месяц, а в Москве может достигать 1 млн рублей.

🔵 Bloomberg

Tuesday, July 30, 2024

squere prices


Цены на первичку в Москве упадут до 250 тысяч за квадрат к 2026 году из-за отмены льготной ипотеки, уверены аналитики НРА.

🔵 Bloomberg

Sunday, April 9, 2023

real estate prices

тыцаб е льно

Как изменились цены на недвижимость в разных странах мира за период с 2010 года


Удивительно, но реальные (с поправкой на инфляцию) цены на недвижимость в России за период с 2010 по 2022 гг. снизились на 33%! И это самое сильное снижение среди всех вошедших в исследование стран (а их больше 50).

Странно и противоречит наблюдаемой действительности? На самом деле - нет. Во-первых, цены в Москве действительно растут быстро, но Россия гораздо больше, чем Москва. Во-вторых, даже в Москве как в 2010 можно было взять "двушку на окраине" за 150-200 тысяч долларов (5-6 миллионов рублей по тому курсу!), так и сейчас она стоит те же 150-200 тысяч долларов (12-15 млн по нынешнему курсу). А долларовую инфляцию никто не отменял

А вот в Исландии, к примеру, жильё правда подорожало (в реальных величинах): более, чем вдвое, за прошедшие 12 лет! В Эстонии и Новой Зеландии оно прибавило по 97%, в Чили - 95%, в Турции - 91%

Thursday, September 2, 2021

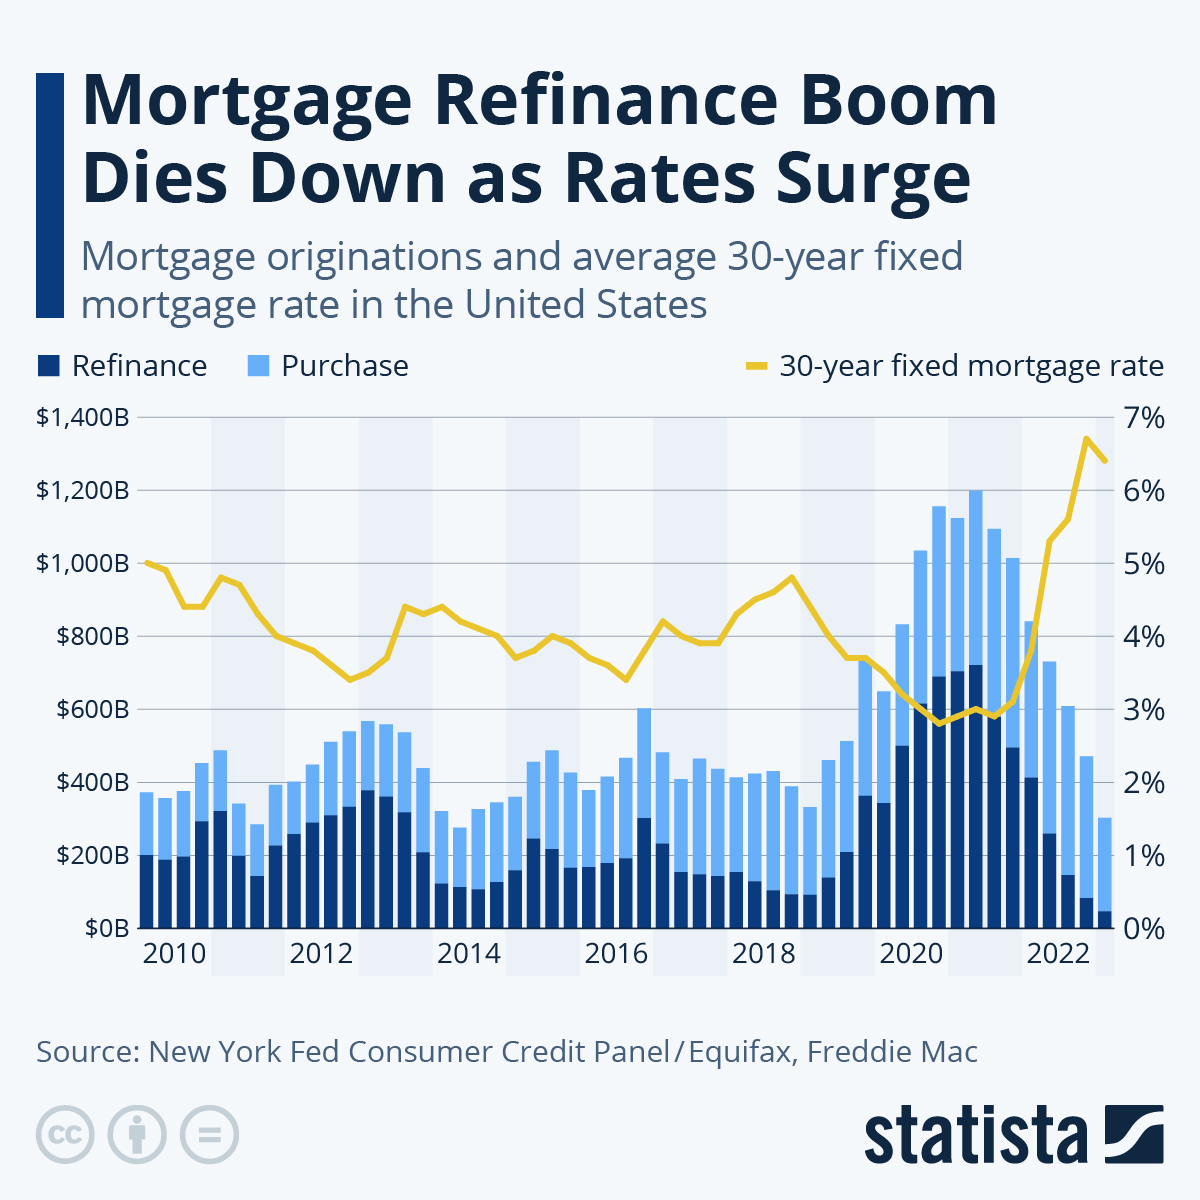
High Prices & Low Rates Drive Mortgage Refinance Boom

A combination of historically low mortgage rates and soaring home prices has led to a surge in mortgage refinances in the United States. According to Equifax data published by the New York Federal Reserve, mortgage originations nearly hit $1.2 trillion in Q4 2020, with refinances accounting for roughly 60 percent of that total. The refinance boom became even more apparent in early 2021, as existing homeowners refinancing their debt accounted for a whopping 70 percent of $1.3 trillion in mortgage originations in the first three months of the year according to Freddie Mac.

Homeowners are best situated to take advantage of the current market environment because they stand to profit from high house prices as well as low rates, while prospective buyers will see the positive effect of low mortgage rates at least partly canceled out by high home prices. Many homeowners even decide to take some cash when refinancing their mortgage, taking full advantage of their home equity. According to Freddie Mac, home owners cashed out $150 billion refinancing their mortgages last year, marking the highest volume since 2007.

As the following chart shows, mortgage refinances in Q4 2020 and Q1 2021 even surpassed the level seen during the refinance boom of 2003, albeit only in nominal terms. It also needs to be noted that back in 2003, only 30 percent of mortgage originations went to borrowers with excellent credit scores, while such super-prime borrowers accounted for more than 70 percent of origination volumein the past twelve months, making the current boom less worrisome than the 2003 refinance frenzy, which contributed to the financial crisis of 2008.Infographic: High Prices & Low Rates Drive Mortgage Refinance Boom | Statista

Wednesday, February 3, 2021

Mortgage Basica

глава департамента финансовой стабильности регулятора Елизавета Данилова
Глава департамента ЦБ предложила продлить льготную ипотеку не во всех регионах


3 февраля 2021, 08:44

Центробанк выступает за постепенное закрытие программы льготной ипотеки под 6,5%, сохранив данный проект только в отдельных регионах. Об этом заявила в среду, 3 февраля, глава департамента финансовой стабильности регулятора Елизавета Данилова.

«Льготная программа должна постепенно сворачиваться, чтобы не приводить к избыточным рискам. Важно следить за динамикой цен на жилье — они в последние годы довольно быстро росли, отчасти на фоне роста ипотеки, отчасти из-за недостаточного предложения жилья», — рассказала Данилова в интервью «РИА Новости».

Она отметила, что льготная ипотека теряет свой социально направленный характер, так как в крупных городах зафиксирован резкий инвестиционный спрос на жилье.

Как следствие, по ее словам, не достигается изначальная цель данной программы — «сделать жилье доступным широким слоям населения», пишет «Газета.ру».

«Изначально цель программы — развивать жилищное строительство и в других регионах. Поэтому, я думаю, программу можно продлить таргетированно на те регионы, где отмечается более сложная ситуация на рынке жилья и где такая программа будет необходима», — добавила Данилова.

Президент России Владимир Путин 21 января также указал, что в ряде регионов возникли дисбалансы на рынке жилья на фоне льготной ипотеки. По его словам, стоимость на недвижимость существенно растет, при этом доступных вариантов квартир для удовлетворения спроса не хватает.

Программа субсидирования процентных ставок по ипотеке до 6,5% была запущена в апреле 2020 года и должна была завершиться 1 ноября 2020 года. В конце октября премьер-министр России Михаил Мишустин продлил эту программу до 1 июля 2021 года.

Tuesday, November 3, 2020

homelessness in Australia

винник, дай денег
Published on N-IUSSP.ORG November 2, 2020

How many people experience homelessness in Australia?


James O’Donnell

Homelessness is damaging to individuals and society – and an exceedingly difficult phenomenon for researchers and policymakers to measure and analyze. In this article, James O’Donnell describes a new approach to estimating annual homelessness. Demonstrating the approach with existing data from Australia, the results point to the wide impact of homelessness and housing deprivation in society.

Most estimates of homelessness are based on point-in-time counts, such as the night or consecutive nights of a homelessness count. These are important because they provide critical information on the daily need for housing and homelessness services such as crisis accommodation. However, because homelessness is often experienced temporarily or episodically (Culhane et al. 2007; Link et al. 1995), more people experience it than are ever captured at a single point‑in-time.

Capturing the effects of these dynamics is difficult. Administrative data collected from homelessness service providers is an important source of longitudinal information (Culhane et al. 2007), but only capture data on those who come into contact with services. Household surveys sometimes ask retrospective questions about past episodes of homelessness, from which estimates of annual and lifetime rates of homelessness have been calculated (Chamberlain and Johnson 2015). However, these surveys invariably miss the potentially large population who are experiencing homelessness at the time of the survey. Thus, we do not really know how many people experience homelessness in any given year.

Estimating the currently homeless


In new research, I propose a method for estimating the size of the population missed in retrospective household surveys (O’Donnell 2020). Inspired by Capture‑Recapture techniques, the approach sets out to establish a relationship between the population whose homelessness over a 12 month period is ‘observed’ in a household survey to the population whose homelessness episodes are ‘unobserved’.

Observed episodes are those that conclude in the 12 months prior to a household survey, making individuals eligible for selection into the survey sample (barring death, imprisonment or emigration). Unobserved episodes are those that are ongoing at the time of the survey, making individuals ineligible for sample selection (see Figure 1). Dividing the number of unobserved episodes by the observed episodes gives what I call the k ratio.

fig 1 (should appear here https://www.niussp.org/wp-content/uploads/2020/11/fig_1_niussp.jpg)

There are in fact a set of k ratios specific to the duration of homelessness episodes. To understand their rationale, take the example of an individual who is homeless for one month in the year. This person will have a one-in-12 chance on being homeless on an average day. Under a certain set of assumptions (e.g. homelessness occurs uniformly throughout the year), this could also be taken to be the probability of the episode occurring at the time of a survey and therefore being unobserved. Dividing it by its complementary probability of the episode being observed (i.e. 11‑in‑12) gives a k ratio specific to episodes lasting one month. Calculating ratios for each duration and multiplying them by the number of observed homelessness episodes gives an estimate of the non‑sampled population experiencing homelessness at the time of the survey.

Applying the approach using Australian data


I use retrospective data from Australia’s General Social Survey (GSS) 2014 to operationalize the approach (ABS 2015). The GSS was a survey representing almost all private households in Australia. A homelessness module in the survey asked responding adults (aged 15 years and over) several questions about past experiences of homelessness, including the timing and duration of their most recent episode.

Respondents were recorded as having experienced homelessness when they reported not having a permanent place to live for reasons outside of their personal control and choice. Living circumstances included those often described as ‘literal’ and ‘hidden’ homelessness. Literal homelessness includes people sleeping rough on the streets and in makeshift dwellings (e.g. tents, cars, abandoned buildings, and train stations) and people staying in homeless shelters. Hidden homelessness or ‘housing exclusion’ includes people staying with family and friends (e.g. ‘couch surfing’) or in caravans/mobile homes, motels, hostels, and boarding/rooming houses.

A microsimulation model was used to account for several aspects in calculating the k ratios. Ratios were calculated by simulating homeless episode start and end dates and survey sample selection dates for a synthetic population. Episodes that overlapped selection dates were considered unobserved, while episodes that finished in the prior 12 months were observed. Microsimulation allows for the incorporation of auxiliary data on seasonal variation in the onset of homelessness, the size of the population who experience long-term homelessness, or the occurrence of multiple homelessness episodes. It also takes account of people who die or otherwise move out of the sample frame (e.g. due to imprisonment and migration).

Annual estimates of homelessness


According to the GSS, 351,000 adults experienced a completed episode of literal or hidden homelessness in Australia in the 12 months to 30 June 2014. On top of this, I estimate that 148,400 adults were experiencing homelessness at the time of the survey and a further 8,900 episodes may have been otherwise missed (e.g. due to people dying before the survey). Thus, 508,300 adults or 2.7 per cent of the Australian population were estimated to have experienced homelessness in the 2013-14 financial year.

The impact of homelessness and housing deprivation in society is considerably larger than existing measures suggest. The population who experience homelessness over a one-year period is predicted to be 3.4 times larger than the number counted on any single night. Further, only one-in-five homeless people are predicted to seek help from housing and homelessness services, suggesting that administrative data from such services substantially understate the scale of the problem.

The experience of homelessness is more diverse than commonly measured. Of the 508,300 adults who experienced homelessness in 2013-14, only 52,300 people (0.28 percent of the population) experienced literal homelessness on the streets or in a homeless shelter. Approximately 90 percent of episodes involved at least one period of staying with family or friends. And while 25 percent of episodes are predicted to last 12 months or longer, approximately 20 percent last less than two weeks. As shown in Figure 2, this contrasts strongly with point‑in‑time counts which tend to overrepresent long-term homelessness.

fig 2 (should appear here https://www.niussp.org/wp-content/uploads/2020/11/fig_2_niussp.jpg)

Implications


Estimating homelessness is difficult and the results are imprecise. In addition to sampling and non-sampling error, estimates in this article are the product of how homelessness is defined and how data are collected and measured in Australia. Nevertheless, two key implications have broader application. Firstly, homelessness and housing deprivation impact a larger and more diverse population than conventional measures suggest, highlighting the position of literal homelessness within a much larger dynamic of housing and financial disadvantage and deprivation.

Secondly, much of the burden for preventing and responding to homelessness falls on interpersonal support networks. While staying with family and friends is often not considered a form of homelessness, it appears to be the most common arrangement for people without their own permanent home and is likely to be an important staging and landing point for people entering and exiting the street and sheltered homelessness (O’Donnell 2019).

Such implications highlight the importance of public policy in rectifying housing market deficiencies and providing a safety net when interpersonal supports fail or no longer exist. They also underscore the value of annual estimates, not just to measure the scale of homelessness, but also to reveal something of its nature and experience.

References

  • ABS (2015). General Social Survey: Summary Results, Australia, 2014. Cat no. 4159.0. Canberra: Australian Bureau of Statistics.
  • Chamberlain, C. and Johnson, G. (2015). How many Australians have slept rough? Australian Journal of Social Issues, 50(4), 439-456.
  • Culhane, D.P., Metraux, S., Park, J.M., Schretzman, M., and Valente, J. (2007). Testing a typology of family homelessness based on patterns of public shelter utilization in four U.S. jurisdictions: Implication for policy and program planning. Housing Policy Debate, 18(1), 1‑28.
  • Link, B.G., Phelan, J., Bresnahan, M., Stueve, A., Moore, R.E., and Susser, E. (1995). Lifetime and Five-Year Prevalence of Homelessness in the United States: New Evidence on an Old Debate. American Journal of Orthopsychiatry 65(3), 347-354.
  • O’Donnell, J. (2020). Estimating annual rates of homelessness. Demographic Research, 43(1), 1-34.
  • O’Donnell, J. (2019). Does social housing reduce homelessness? A multistate analysis of housing and homelessness pathways. Housing Studies, DOI: 10.1080/02673037.2018.1549318, 1-27.

Friday, September 11, 2020

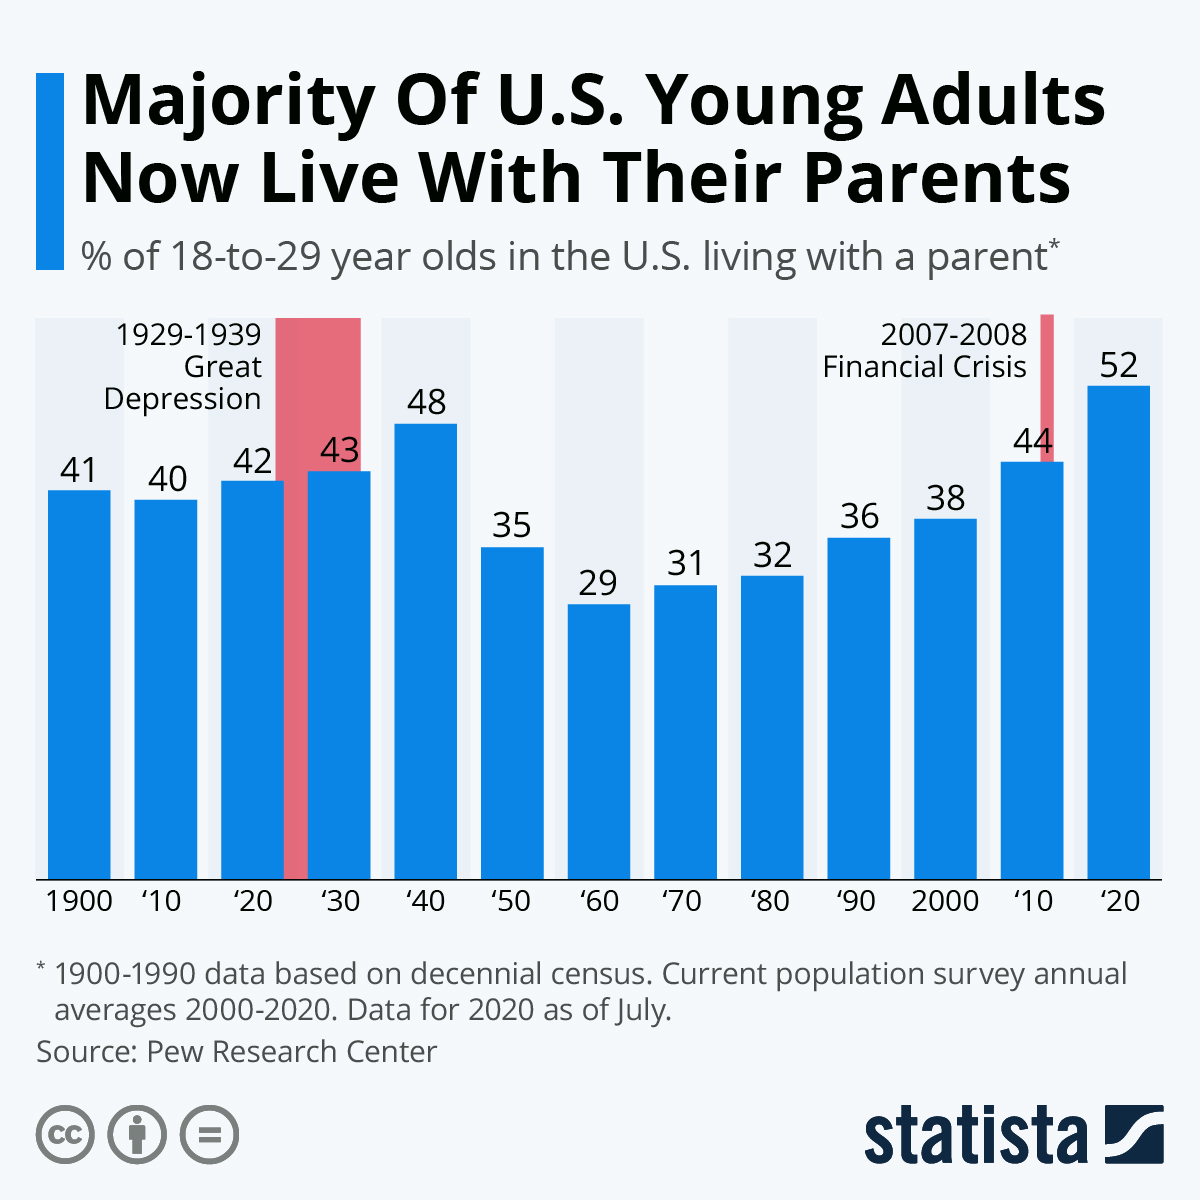
Majority Live With Their Parents

The devastating economic impact of the pandemic in the United States is pushing increasing numbers of young people to move back in with their parents. A recently released Pew Research Center analysis has found that a majority of 52 percent of Americans aged between 18 and 29 now live with a parent, the highest share recorded since the Great Depression era. That figure looked set to rise even further as an estimated 30 to 40 million people across the U.S. were thought to be at risk of eviction. Now that the Centers for Disease Control and Prevention has moved to provide tenants with protection until the end of this year, the likelihood of a catastophic homelessness crisis has subsided, temporarily at least.

The share of young adults currently living with their parents is higher than any previous measurement recorded in surveys and decennial censuses. The highest historical value was previous recorded in the 1940 census towards the end of the end of the Great Depression when 48 percent of young adults lived with a parent. The share reached its lowest point in 1960 at 29 percent but it has grown steadily ever since, hitting 49 percent by February 2020. The Pew Research Center states that the number of 18-29 year olds living with a parent increased by 2.6 million since February and the total number stood at 26.6 million in July.Infographic: Majority Of U.S. Young Adults Now Live With Their Parents | Statista

Tuesday, July 14, 2020

housing answer

Люди как люди. Любят деньги, но ведь это всегда было… Человечество любит деньги, из чего бы те ни были сделаны, из кожи ли, из бумаги ли, из бронзы или из золота. Ну, легкомысленны… ну, что ж… и милосердие иногда стучится в их сердца… обыкновенные люди… в общем, напоминают прежних… квартирный вопрос только испортил их


Путин заявил о возможности решить жилищный вопрос в РФ

18:59 13.07.2020 (обновлено: 00:31 14.07.2020)


МОСКВА, 13 июл – РИА Новости. У российских властей есть исторический шанс впервые за всю историю страны кардинально решить жилищный вопрос, заявил Владимир Путин на видеосовещании совета по стратегическому развитию и нацпроектам.
Так глава государства отреагировал на доклад вице-премьера Марата Хуснуллина о ходе исполнения нацпроекта "Жилье и городская среда".
"Нужно не упустить этот шанс, над этим нужно настойчиво работать. Это одно из фундаментальных условий нормальной жизни человека и российской семьи", - сказал Путин.

Нужно ставить амбициозные цели

Президент попросил правительство и конкретно вице-премьера, который курируют тему жилья, уделить этому особое внимание.

Путин посчитал реалистичной цель выдать жилье пяти миллионам семей к 2026 году. Более того, глава государства заявил, что можно добиться и большего.
"Надо только ставить перед собой амбициозные цели", - сказал он.

Откуда взялся уникальный шанс

Опрошенные РИА Новости эксперты считают, что уникальный шанс решить жилищный вопрос появился благодаря рекордно низким ставкам по ипотеке, адаптации застройщиков к новым законодательным условиям и мерам по господдержке.

Как отметил руководитель аппарата НОЗА Кирилл Холопик, никогда в истории России ставка при покупке новостройки не была в районе 6%.

Ипотека на "вторичку"

В этот же день спикер Совфеда Валентина Матвиенко провела заседание Совета по развитию финрынка, на котором заявила, что важно активнее развивать ипотеку на вторичном рынке.
По ее мнению, наблюдается тенденция к некоторому снижению ставок, но разрыв в стоимости кредитов на первичном и вторичном рынке остается значительным.
Матвиенко упомянула успешный региональный опыт, когда внедряется практика по использованию договоров жилищных сбережений, сочетающих в себе элементы банковского вклада и ипотечного кредита.

Wednesday, July 8, 2020

The percentage of 18-30 year olds living with their parents

Thursday, May 21, 2020

corruption in demography

НП демография

Патрушев заявил о коррупции среди исполнителей нацпроектов

Чаще нарушения встречались при исполнении нацпроектов по демографии, здравоохранению, образованию, культуре, жилью [тут ачипятки нет] и городской среде, безопасным дорогам. Чиновники, в частности, завышали стоимость товаров, услуг и работ


Реализация национальных и федеральных проектов, которые были запущены по поручению президента Владимира Путина, выполнялась с многочисленными нарушениями. Об этом заявил секретарь Совета безопасности Николай Патрушев, передает ТАСС.

По его словам, эти нарушения связаны с коррупцией, несоблюдением порядка госзакупок, оплатой некачественных или невыполненных работ, фальсификацией отчетных показателей и прочим. В качестве примера секретарь Совбеза привел завышение стоимости товаров, работ и услуг. Конкурсанты пользуются такими инструментами манипуляции, как необоснованные жалобы в компетентные органы. «В результате сроки закупки затягиваются либо она полностью срывается», — сказал Патрушев.

Он добавил, что часто нарушения фиксировались при исполнении нацпроектов «Жилье и городская среда», «Безопасные и качественные автомобильные дороги», «Демография», «Образование», «Культура», «Здравоохранение». Только в Приволжском округе в 2019 году, по его словам, власти выявили 49 нарушений и смогли предотвратить ущерб на сумму 7,5 млрд руб. «По итогам первого квартала текущего года уже выявлено 36 преступлений в данной сфере и более 800 нарушений законодательства», — заметил Патрушев, добавив, что больше всего таких нарушений обнаружили в Удмуртии, Пермском крае и Оренбургской области.

Он призвал принять превентивные меры и усилить контроль за использованием бюджетных средств, чтобы «не допустить хищений при реализации нацпроектов».

По мнению Патрушева, для этого нужно наладить слаженность и скоординированность действий как правоохранительных и надзорно-контрольных органов, так и региональных властей и местного самоуправления.

В феврале этого года президент Владимир Путин поручил ФСБ усилить антикоррупционный контроль в сфере национальных проектов, где концентрируются «огромные ресурсы». Глава Счетной палаты Алексей Кудрин указывал, что масштабы коррупции в России измеряются триллионами рублей. Заняться мониторингом исполнения нацпроектов Кудрину поручил Путин.

Friday, February 7, 2020

errore tradizionale

errore tradizionale
67% семей хотят больше детей, чем имеют на данный момент. Реализовать это на практике мешают отсутствие собственного жилья, стабильных источников дохода и большие затраты на содержание ребенка.

РОССИЯНЕ НАЗВАЛИ БАРЬЕРЫ, ПРЕПЯТСТВУЮЩИЕ ПОВЫШЕНИЮ РОЖДАЕМОСТИ

Sunday, December 29, 2019

The significance of age to the study of ethnic residential segregation

Published on N-IUSSP.ORG October 29, 2018

L'importance de l'âge dans l'étude de la ségrégation résidentielle ethnique


Albert Sabater, Gemma Catney

In the study of ethnic residential segregation, global measures are typically used. However, while useful as summary indicators, these measures miss important and distinctive age-specific and birth-cohort trends. Albert Sabater and Gemma Catney demonstrate this for England and Wales (2001 and 2011).

Are there distinctive patterns of ethnic residential segregation across the life course?


In a recent publication (Sabater and Catney 2018), we examine variations in ethnic residential segregation across the life course, represented in our study by particular age groups and ‘stages’ of life. We argue that taking such an approach is important in contexts with the simultaneous growth of young and aging minority ethnic populations for understanding the local dynamics of ethnic geographies.

Using harmonized small area data (8,546 wards) for England and Wales (2001-2011), we demonstrate the usefulness of our approach by applying two measures of segregation: the dissimilarity index (ID) and the isolation index (P*). These two commonly-employed measures capture two key dimensions of residential segregation (evenness and exposure) and allow straightforward comparisons of global, age group and birth-cohort segregation both nationally and internationally. In the study, we analyze the evolution of ethnic residential geographies for the eight largest and most stable categories from 2001 to 2011: White British, Other White, Indian, Pakistani, Bangladeshi, Black Caribbean, Black African and Chinese. Ethnicity data used in UK national statistics relies on individuals’ self-definition.

The computation of ethnic residential segregation with an age dimension is equivalent to the summary or ‘global’ calculation for all groups, although the analysis relies on an index value for each age group. The use of age for the analysis of ethnic residential segregation increases our knowledge about the spatial incorporation of each group because it highlights two important characteristics about an individual: their place in the life cycle – whether a young adult, middle-aged or older – and their membership in a cohort of individuals who were born at a similar time. Further, since the characteristics of younger or older adults may differ at a given period, the use of birth-cohorts provides one way to examine the trajectory of residential segregation of ethnic groups as they pass through life-course phases, including when household sizes may be growing or reducing.

Results on age-specific ethnic segregation clearly demonstrate that this simple demographic approach to analyzing segregation by age groups can provide an important contribution to the ethnic segregation debate. Most studies using global measures depict segregation as either low, moderate or high, yet this analysis reveals significant differences in segregation by age between ethnic groups. For instance, the oldest age group (60-64) in this study is the most residentially segregated group in 2011 (measured here by the dissimilarity index), particularly for the Bangladeshi (79.8%), Pakistani (75.8%), Black African (72.5%), Black Caribbean (70.5%) and Indian (66.7%) groups, whose overall segregation can be considered as high (figure 1).

Perhaps more importantly, the results from figure 1 also highlight variations in segregation across the life course, represented here by particular age groups and ‘stages’ of life. Three distinctive phases can be identified, with higher levels of segregation at the youngest and oldest age categories (those within the 0-19 and 45-64 ranges), and lower levels of segregation for the ‘middle’ age categories (within the 20-44 ranges). It can be seen that the youngest group is more residentially segregated compared to the ‘middle’ age group. This is the result of clustering with their immediate family members in the same household, a situation which, in turn, is determined by the forces of choice and constraint on parents/families. Of course, while most children in the youngest group are likely to live in the same household with their parents, not all individuals in the ‘middle’ age categories are parents, thus the differences that we observe between these two age categories can be interpreted in terms of the impact of household composition and family location on residential segregation. Crucially, these phases are to a large extent common to all ethnic groups, and the consistency in relative levels of segregation found for the global values is generally observable across all age categories. The only departure from the common trends is the distinctive segregation patterning of the Chinese ethnic group aged 20-24, whose segregation (58.6%) is associated with overseas migration to UK universities as well as post-student retention, particularly in urban centers across England and Wales.


Cohort/generational change in terms of spatial mixing


Another part of our study is to examine how the residential segregation of ethnic groups evolves with age. This is an important aspect because it allows us to see whether or not there are cohort/generational changes in terms of spatial mixing for all ethnic groups. Figure 2 shows the change in segregation across all wards in England and Wales since 2001, in terms of unevenness (ID) and exposure (P*) of ethnic groups by cohorts.

The analysis of ID across birth-cohorts indicates similar changes in the geographical spread during the decade for all ethnic groups. First, the youngest cohort, which refers to children living with their parents, and older cohorts in their 40s, 50s, and 60s, have experienced marginal changes in unevenness. Meanwhile, a clear decrease in unevenness is observed among cohorts in their 20s and 30s in 2011. For instance, ID values show a substantial percentage point decrease for birth-cohorts 10-14 in 2001 and 20-24 in 2011, particularly among Black African (-19.9), Black Caribbean (-12.6), Indian (-10.1), Bangladeshi (-8.5) and Pakistani (-7.9) groups.

The examination of ID values by cohorts shows a changing experience of ethnic segregation as people age. In a similar fashion to analyses of residential mobility by age, our results demonstrate that residential segregation decreases during young adulthood for all cohorts then increases during the late 20s and early 30s, and continues to increase across mid-life until retirement. For instance, greater residential segregation in terms of unevenness can be seen for the White British groups who at the start of the 2001-2011 period, were aged 35-39 (+0.2), 40-44 (+0.6), 45-49 (+1.9) and 50-54 (+3.1). Similarly, a pattern of increased segregation is identifiable among the oldest cohorts (i.e. aged 50-54 in 2001) of most minority ethnic groups. Nonetheless, the results also indicate a lower geographical spread during the decade at somewhat younger ages for some minority ethnic groups – for instance, among Pakistani and Bangladeshi in their late 20s and early 30s – ranging from +1.4 (Pakistani aged 25-29 and Bangladeshi aged 30-34 in 2001) to +3.6 (Pakistani and Bangladeshi aged 35-39 in 2001).

Given that one of the most important attributes of birth-cohorts is the number of people born into the group, the number of arrivals from abroad, and the mortality of that group, the index of isolation (P*) is also employed here to highlight birth-cohort differences in population composition between ethnic groups. While the results indicate that the larger volume of births, particularly among some groups such as the Bangladeshi and Pakistani group, and streams of (family) immigration combine to produce marginal changes in residential segregation for birth-cohorts in their late 20s and early 30s, the most remarkable change in P* over the decade is a decrease for most birth-cohorts in their teens and 20s. The latter reflects widespread decreases in the average local population of ethnic minorities due to out-migration from ethnic concentration areas, associated with migration from cities, particularly for those at the family-building life stage (Sabater and Finney, 2014).

Meanwhile, older birth-cohorts of all ethnic groups experience greater neighborhood segregation. This is because many older people, especially those entering pre-retirement ages, have largely settled in their neighborhoods and aged in place. While for many older cohorts neighborhood attachment and belonging may have contributed to these settlement patterns of ethnic concentration, for others it may reflect the outcome of cumulative disadvantages, particularly concerning the housing market. Although the gradual, if slow, dispersal of all ethnic groups has contributed to desegregation over time, it is important to highlight that exclusionary forces such as racial stereotyping and discrimination have also played a crucial role in reinforcing minority ethnic concentration among older cohorts.

Implications


Most work on ethnic residential segregation fails to consider that the residential patterning of ethnic minorities for any place becomes more complex if age structures of recent immigrants are juxtaposed with those of second- and third-generation minority groups. A useful way to overcome this problem is to establish whether ethnic residential segregation at different times and contexts varies by age groups (i.e. between people who were born at different periods) and birth-cohorts (i.e. between people who were born in the same period) and whether there are differences or similarities between ethnic groups at key stages of the life course.

References

  • A. Sabater & G. Catney, (2018). Unpacking Summary Measures of Ethnic Residential Segregation Using an Age Group and Age Cohort Perspective. European Journal of Population, vol. First Online, pp. 1-29. DOI: 10.1007/s10680-018-9475-3 [Open Access — значит можно легально почитать]
  • A. Sabater & N. Finney (2014). Demographic Understandings of Changes in Ethnic Residential Segregation Across the Life Course. In C. Lloyd, I. Shuttleworth and D. Wong, (eds), Social segregation: concepts, processes, and outcomes. Bristol: Policy Press, 269-300.

Tuesday, November 26, 2019

Vivre seul en Europe : différences selon le genre et le niveau d'instruction

Published on N-IUSSP.ORG November 25, 2019

Gender gaps and educational differences in living alone across Europe


Glenn Sandström, Lena Karlsson

In recent decades, the proportion of individuals living alone has increased in many European countries. Glenn Sandström and Lena Karlsson compare the living arrangements of the working-age population, showing that in more gender-equal countries, gender differences are smaller (also) in this respect and that the highly educated are the least likely to live alone.

With progress in economic development, the share of individuals living in one-person households has increased sharply (Reher and Requena 2018). Living alone is more common in northern and western Europe than in eastern and southern Europe, but is increasing everywhere, and is generally considered unfavorable for social support and health outcomes in later life (Brunner et al. 2018; House et al. 1988).

Our research tried to assess how education affects the risk of living alone at adult ages (30 to 64 years) in 12 European countries characterized by different levels of what we think is an important contextual variable: gender equality (World Economic Forum’s Global Gender Gap Index). Our data source is the Generations and Gender Survey (and the periods covered the range between 2002 and 2013) (Sandström and Karlsson 2019) (Table 1).


Education and living arrangements


Individuals with high levels of education formed the vanguard in the shift towards more individualistic norms and behaviors in western countries during the social upheavals of the 1960s. In those years, the changing roles of women started to erode the patriarchal family, which later led to decreased family cohesion, higher rates of divorce/separation, postponement of family formation and an increased share of the population living alone (Esping-Andersen 2016; Lesthaeghe 1995; Van De Kaa 1987). However, recent research shows that the negative association between women’s education and family formation/cohesion has weakened, and that it is tending to turn positive in countries where institutions and men’s behavior in the family sphere have adapted to women’s new role (Esping-Andersen and Billari 2015; Goldscheider et al. 2015). This suggests that there may be a trend towards lower levels of living alone among highly educated adults in more gender-equal societies.

Who lives alone, and where?


Figure 1 reveals the proportion of men and women living alone in each country, with red indicating a relative excess of men and green a relative excess of women. The countries are ordered by their Global Gender Gap Index, from the most gender-equal (Sweden, on the left), to the least (Italy, on the right). The Index value is shown above each bar. In both eastern and southern Europe, the share of one-person households is considerably lower than in the more gender-equal northern European countries. In all the countries with high gender equality scores, living alone is more frequent among men. In countries with relatively lower scores, the results by gender are more mixed, with higher levels observed among women in some eastern European countries such as Hungary, Romania, and Estonia. Controlling for compositional differences between countries in terms of age structure, parental status and education reinforce the pattern: women tend to live alone more than men in less gender-equal countries, which also include Poland and Italy (not shown here: see Sandström and Karlsson 2019).


Figure 2 displays the predicted probabilities of living alone in working ages (30 to 64 years) by educational level, adjusting for age, gender, and parental status. The countries are ordered as before, from the most gender-equal (Sweden) to the least (Italy).


Let us focus on the gradient, i.e. on the tendency towards higher or lower probabilities of living alone as education increases (left to right within each panel). In the countries that score high on the Global Gender Gap Index, such as Sweden, the Netherlands and Estonia, the highly educated are least likely to live alone, and likewise, although the pattern is less clear, in Germany, Belgium, and Austria. On the contrary, a positive relationship with education is generally found in the less gender-equal countries, especially in Italy and Poland, despite a few exceptions (notably Hungary).


New patterns of living alone have policy implications


There is a general expectation that more people will live alone in the future, especially in countries where the trend towards an increasing share of one-person households started only recently.

Those who live alone during midlife are also likely to live alone in their old age, and this makes them more vulnerable to adverse health outcomes and economic hardship. The higher probability of living alone for the least educated in more gender-equal societies is therefore of special interest to social policy, as differences in living arrangements are liable to exacerbate existing economic and health-related inequalities by socioeconomic status. For countries in northern Europe, higher shares of one-person households in the low educated segments of their populations might result in the increased need for social policies that offer more support to older adults living alone when these cohorts enter retirement ages.


Acknowledgments


The original study by Sandström and Karlsson mentioned in this article was conducted as part of the research program “Ageing well – individuals, families, and households under changing demographic regimes in Sweden” (DNR: 2016-07115) funded by the Swedish Research Council for Health, Working Life and Welfare (FORTE).

References

  • Brunner, E. J., Shipley, M. J., Ahmadi-Abhari, S., Hernandez, C. V., Abell, J. G., Singh-Manoux, A., et al. (2018). Midlife contributors to socioeconomic differences in frailty during later life: a prospective cohort study. The Lancet Public Health, 3(7), e313–e322. DOI:10.1016/S2468-2667(18)30079-3
  • Esping-Andersen, G. (2016). Families in the 21st century. Stockholm: SNS Förlag.
  • Esping-Andersen, G., & Billari, F. C. (2015). Re-theorizing Family Demographics. Population and Development Review, 41(1), 1–31. DOI:10.1111/j.1728-4457.2015.00024.x
  • Goldscheider, F., Bernhardt, E., & Lappegård, T. (2015). The Gender Revolution: A Framework for Understanding Changing Family and Demographic Behavior. Population and Development Review, 41(2), 207–239. DOI:10.1111/j.1728-4457.2015.00045.x
  • House, J. S., Landis, K. R., & Umberson, D. (1988). Social relationships and health. Science, 241(4865), 540–545. DOI:10.1126/science.3399889
  • Lesthaeghe, R. J. (1995). The Second Demographic Transition in Western Countries: An Interpretation. In K. O. Mason & A.-M. Jensen (Eds.), Gender and family change in industrialized countries (pp. 17–62). Oxford: Oxford University Press.
  • Reher, D., & Requena, M. (2018). Living Alone in Later Life: A Global Perspective. Population and Development Review, 44(3), 427–454. DOI:10.1111/padr.12149
  • Sandström, G., & Karlsson, L. (2019). The educational gradient of living alone: A comparison among the working-age population in Europe. Demographic Research, 40(55), 1645–1670. DOI:10.4054/DemRes.2019.40.55
  • Van De Kaa, D. J. (1987). Europe’s second demographic transition. Population bulletin, 42(1), 1.

Link: source table 1 – figure 1 and figure 2 – Generations and Gender Survey Wave 1

Saturday, November 23, 2019

save a donkey

бременские музыканты
A new report by The Donkey Sanctuary has found that half the world's donkeys could be wiped out within the next five years amid rising demand for traditional Chinese medicine. An estimated 4.8 million donkey hides are needed each year to satisfy demand for ejiao, a traditional gelatin-based medicine. Demand for it has already had a serious impact on donkey populations in several countries around the world.

As the following infographic shows, China's donkey population fell 59 percent between 1992 and 2017 while Kyrgyzstan's plummeted 53 percent in the six year period from 2011 to 2017. During the same time frame, Botswana saw a 37 percent drop in its donkey herds while the number of animals in Brazil declined 28 percent in the decade from 2007 to 2017.

The growing demand for donkey hides is expected to lead to serious problems, perhaps best summed up by the Ethiopian proverb "if you don't have a donkey, you are the donkey". Millions of people worldwide rely on donkeys for their livelihoods and if the current rate of slaughter continues, the impact is likely to be catastrophic.

The report had a number of recommendations for the ejiao industry such as cutting links with the global skin trade and supporting national government efforts to protect their herds. It also recommends that the ejiao industry switches towards more sustainable products and that the Chinese government suspends the import of donkeys and their products so that an alternative solution can be found.
Infographic: Demand For Chinese Medicine Decimates Donkey Herds | Statista

Wednesday, May 16, 2018

for rent

но без Москвы и Питера

Thursday, January 26, 2017

Petty meanness

размежевание перед объединением
это алейка перед польской модой
вчера/позавчера на этих стендах висели объявления о собраниях по поводу перемежевания придомовой территории
сегодня они не очень аккуратно закрашены, но
на подъездах объявления ещё есть 

Friday, July 1, 2016

New York, NY

свобода тоже в Нью Йорке
Служба помощи нуждающимся приняла решение, что люди с диагностированным ВИЧ имеют право на материальную помощь в рамках программы оплаты жилья в экстренных случаях. В нее входит ежемесячное пособие на транспорт и продукты питания, а также субсидия, покрывающая часть платы за аренду жилья.

Новые правила вступят в силу через 60 дней.

но в Нью-Йорке

Sunday, May 29, 2016

Moscow — capital of xenophobia

Москва — совершенно не дружелюбный город. Каждый третий арендодатель на окраинах открыто говорит о том, что не готов сдавать свое жилье «не русским». Фактически этот показатель будет еще больше: к прямому заявлению в объявлении с большой долей вероятности следует добавить еще определенное количество арендодателей со скрытым национализмом. То есть тех, кто при прочих равных,
выбирая между двумя группами жильцов, отдаст предпочтение русским — и даже может предложить им сдать чуть дешевле.

Какие районы самые нетолерантные


Самые гостеприимные районы расположены внутри Садового кольца — здесь нетолерантность собственников квартир стремится к нулю. Район Замоскворечья также оказывается одним из самых дружелюбных — здесь количество тех, кто не хотел бы селить «лиц кавказской национальности», находится в пределах 10%. Чем дальше от центра, тем напряженность возрастает: Ленинский проспект остается благополучным островком с теми же примерно 10% нетолерантных арендодателей. Не менее благополучным является и условно северное направление — по Ленинградскому шоссе.

Наиболее нетолерантные районы находятся на окраинах — Восток и Юго-Запад [см карту, из неё не следует]. Здесь по недоверию к национальным меньшинствам лидируют отдельные кварталы Новогиреево (нетолерантность 26–27%), близкие к Курскому вокзалу окраины Яузы (примерно 30%), Кузьминки и Печатники (примерно по 27%, отдельные районы — 21%), Люблино (средний показатель в 21%, с пиком 24%), Орехово-Борисово (23–28%), Бирюлево (12–22%) и Ясенево (24%). Это значит, что из 3192 собственников района Кузьминки 830 сразу же откажут арендатору, услышав акцент [это преувеличение, поскольку многие русские говорят с немосковским акцентом, это нормально, точнее, не преувеличение, а необходимость точнее определять ксенофобию в московском варианте].

Вообще оч.существенное дополнение в описание войны холодильника и телевизора — до реальных раздумин ещё далеко.
С другой стороны, хорошо бы сравнить с картой реального проживания кавказцев и среднеазиатов, результаты могут сов.пасть
ист:

Компания HomeApp анализирует рынок арендного жилья и помогает снять квартиры в Москве. На их карте видно, какие районы города терпимее, а какие злее по отношению к приезжим.

там, где заявлено карты (уже?) нет