Published on N-IUSSP.ORG February 3, 2020
Figure 1 displays mortality rates in sub-Saharan Africa by age in months for the first year of life. Twins have lower survival throughout their first year of life, with the differences being especially marked in the first few months. Mortality of twins is nearly five times as high as that of singletons in the first month, presumably due to a greater incidence of biological problems (e.g., birth defects) among twins. The ratio of twin to singleton mortality rates decreases almost monotonically from about 5 in the first month to about 3 in the next few months, reaching 1.7 in the 12th month.

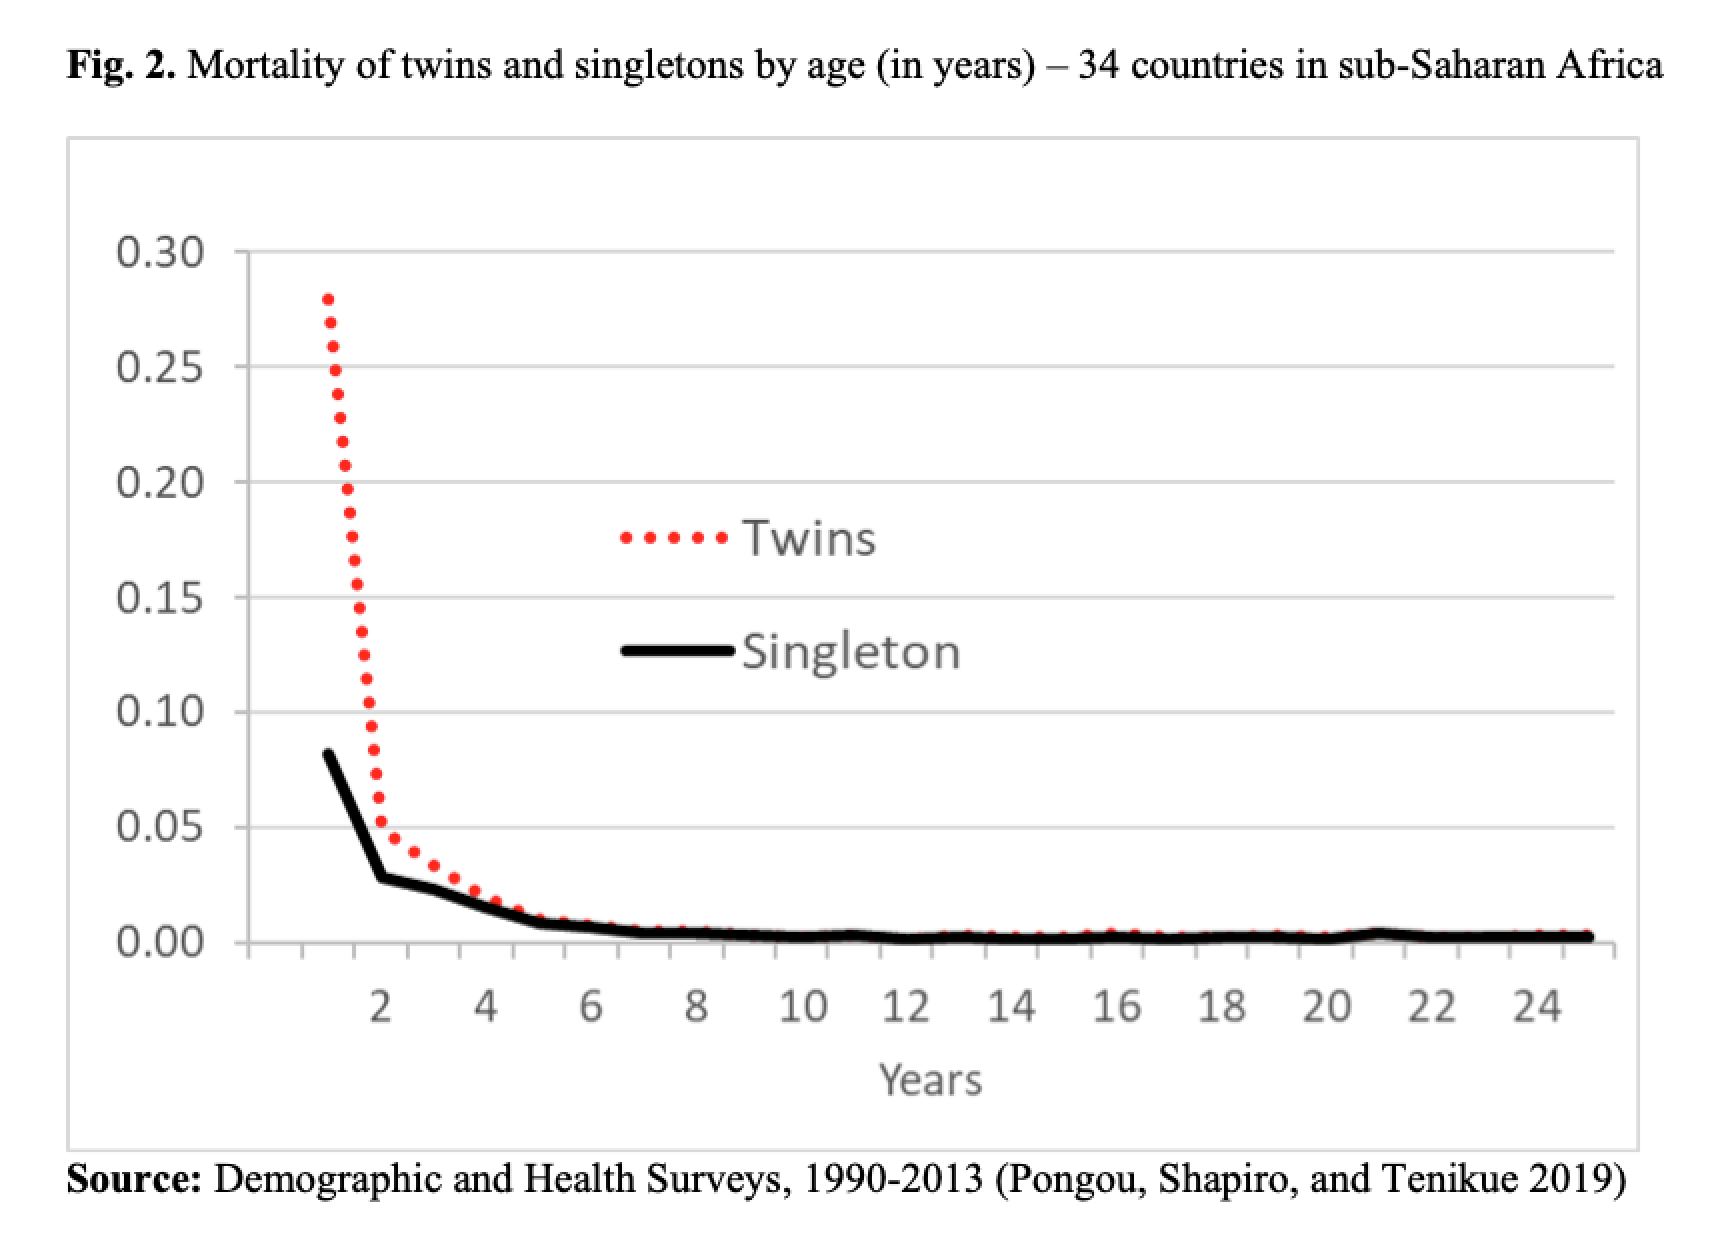
Mortality of twins and singletons in sub-Saharan Africa by age in years is shown in Figure 2. The difference is substantial in the first year, but it diminishes as age increases. The mortality of twins is more than 3 times that of singletons during the first year of life, but this factor falls to 1.7 and 1.4 in years 2 and 3, respectively. By age 5, the twin-singleton mortality difference has fallen to 2 per 1000. From age 6, the difference falls to 1 per 1000 or zero, and remains very low up through the early 20s (Pongou, Shapiro, and Tenikue 2019).

We used data collected since 1990 from women aged 15-49 at the time of the survey to analyze time trends in the twin-singleton mortality difference. The data provide detailed information on births that date back more than 34 years prior to the survey, allowing us to monitor mortality over time.
Figure 3 displays the survival of twins and singletons in sub-Saharan Africa by decade of birth (1960s, 1970s, 1980s, 1990s, 2000s, and 2010-2013). It shows that survival has improved for both twins and singletons over the years. Also, the twin-singleton mortality difference has narrowed, but the higher mortality of twins has persisted. For example, in infancy, when children are at their highest mortality risk, a twin’s risk of dying was 30-percentage points higher than that of a singleton in the 1960s, about 20 points higher in the 1970s to 1990s, and only 15 points higher after the year 2000.

When we examine twin-singleton differences in mortality risk up to age 25 in sub-Saharan Africa, we find an important difference in the first year of life. This difference decreases with age, however, and practically disappears after age 5. After the age of 6, annual mortality risk is very low for all children (fewer than 5 deaths per 1000 children overall). This might be explained by both a selection effect, because the most vulnerable children died before age 5, and the fact that many children are already immunized for some infectious diseases and are less vulnerable to health problems when they reach that age. Our study is the first to analyze mortality convergence between twins and singletons, yielding new insights into how mortality inequalities change across ages.
Roland Pongou, David Shapiro, Michel Tenikue
Twin-singleton mortality differences at early ages are an important source of child inequality in all societies. Owing to the unfavorable fetal conditions of twins resulting in growth retardation and low birthweight, their risk of death within the first year of life is significantly higher than that of singletons by a factor ranging from 3.5 times in Gambia (Miyahara et al. 2016) to 5 in the United Kingdom (ONS 2012) and in Sweden (Cheung, Yip, and Karlberg 2000), and 6 in the United States (Almond, Chay, and Lee 2005). This gap is also observed in all sub-Saharan African countries (Pongou 2013; Smits and Monden 2011).
These mortality inequalities mean that a large number of twins are missing. In 2006 there were about 125 million individuals in the world who had been born as twins (Oliver 2006). This figure represents about 1.6% of the world population, far below the proportion of twin births in most societies, which is around 3% (Pison, Monden, and Smits 2015; Smits and Monden 2011; Monden and Smits 2017). These figures indicate that at least 100 million twins – almost half of the twin population – are missing.
This raises the question of how long the twin-singleton difference in mortality rates persists as children age. Using individual-level data from 99 Demographic and Health Surveys collected in 34 sub-Saharan African countries between 1990 and 2013, we documented twin-singleton mortality differences from birth to age 25. A total of about 3 million births are recorded in the data, of which 3.2% are twins (1.7% twin deliveries). These proportions are comparable to those found in the United States and many European countries (Almond, Chay, and Lee 2005; Pison, Monden, and Smits 2015; Smits and Monden 2011).
We consider that mortality converges when the difference between twin and singleton mortality rates falls below 2 per 1000 and remains below this value as children age (the Millennium Development Goal target of child mortality for developed countries was 5 per 1000).
Substantial literature documents that twins have higher mortality than singletons, but does not address whether this twin disadvantage eventually disappears, and if so, at what age. Roland Pongou, David Shapiro and Michel Tenikue find that mortality differences in sub-Saharan Africa narrow with age, and that convergence occurs by age 6. Over time, mortality of both twins and singletons has declined, but the disadvantage of twins has persisted. Their analysis implies that over 100 million twins – almost half of the world’s twin population – are currently missing, and that this situation originates very early in life.
Twin-singleton mortality differences at early ages are an important source of child inequality in all societies. Owing to the unfavorable fetal conditions of twins resulting in growth retardation and low birthweight, their risk of death within the first year of life is significantly higher than that of singletons by a factor ranging from 3.5 times in Gambia (Miyahara et al. 2016) to 5 in the United Kingdom (ONS 2012) and in Sweden (Cheung, Yip, and Karlberg 2000), and 6 in the United States (Almond, Chay, and Lee 2005). This gap is also observed in all sub-Saharan African countries (Pongou 2013; Smits and Monden 2011).
These mortality inequalities mean that a large number of twins are missing. In 2006 there were about 125 million individuals in the world who had been born as twins (Oliver 2006). This figure represents about 1.6% of the world population, far below the proportion of twin births in most societies, which is around 3% (Pison, Monden, and Smits 2015; Smits and Monden 2011; Monden and Smits 2017). These figures indicate that at least 100 million twins – almost half of the twin population – are missing.
This raises the question of how long the twin-singleton difference in mortality rates persists as children age. Using individual-level data from 99 Demographic and Health Surveys collected in 34 sub-Saharan African countries between 1990 and 2013, we documented twin-singleton mortality differences from birth to age 25. A total of about 3 million births are recorded in the data, of which 3.2% are twins (1.7% twin deliveries). These proportions are comparable to those found in the United States and many European countries (Almond, Chay, and Lee 2005; Pison, Monden, and Smits 2015; Smits and Monden 2011).
We consider that mortality converges when the difference between twin and singleton mortality rates falls below 2 per 1000 and remains below this value as children age (the Millennium Development Goal target of child mortality for developed countries was 5 per 1000).
Higher twin mortality, especially in the first year of life
Figure 1 displays mortality rates in sub-Saharan Africa by age in months for the first year of life. Twins have lower survival throughout their first year of life, with the differences being especially marked in the first few months. Mortality of twins is nearly five times as high as that of singletons in the first month, presumably due to a greater incidence of biological problems (e.g., birth defects) among twins. The ratio of twin to singleton mortality rates decreases almost monotonically from about 5 in the first month to about 3 in the next few months, reaching 1.7 in the 12th month.

Mortality of twins and singletons in sub-Saharan Africa by age in years is shown in Figure 2. The difference is substantial in the first year, but it diminishes as age increases. The mortality of twins is more than 3 times that of singletons during the first year of life, but this factor falls to 1.7 and 1.4 in years 2 and 3, respectively. By age 5, the twin-singleton mortality difference has fallen to 2 per 1000. From age 6, the difference falls to 1 per 1000 or zero, and remains very low up through the early 20s (Pongou, Shapiro, and Tenikue 2019).
Cohort trends in mortality and survival of twins and singletons
We used data collected since 1990 from women aged 15-49 at the time of the survey to analyze time trends in the twin-singleton mortality difference. The data provide detailed information on births that date back more than 34 years prior to the survey, allowing us to monitor mortality over time.
Figure 3 displays the survival of twins and singletons in sub-Saharan Africa by decade of birth (1960s, 1970s, 1980s, 1990s, 2000s, and 2010-2013). It shows that survival has improved for both twins and singletons over the years. Also, the twin-singleton mortality difference has narrowed, but the higher mortality of twins has persisted. For example, in infancy, when children are at their highest mortality risk, a twin’s risk of dying was 30-percentage points higher than that of a singleton in the 1960s, about 20 points higher in the 1970s to 1990s, and only 15 points higher after the year 2000.

Conclusion
When we examine twin-singleton differences in mortality risk up to age 25 in sub-Saharan Africa, we find an important difference in the first year of life. This difference decreases with age, however, and practically disappears after age 5. After the age of 6, annual mortality risk is very low for all children (fewer than 5 deaths per 1000 children overall). This might be explained by both a selection effect, because the most vulnerable children died before age 5, and the fact that many children are already immunized for some infectious diseases and are less vulnerable to health problems when they reach that age. Our study is the first to analyze mortality convergence between twins and singletons, yielding new insights into how mortality inequalities change across ages.
References
- Almond, D., Chay, K.Y., and Lee, D.S. (2005). The costs of low birth weight. Quarterly Journal of Economics 120(3): 1031–1083.
- Cheung Y.B., Yip, P. and J. Karlberg, J. (2000). Mortality of twins and singletons by gestational age: A varying-coefficient approach. American Journal of Epidemiology 152(12): 1107-1116.
- Miyahara R., Jasseh, M., Mackenzie, G.A., Bottomley, C., Hossain, M.J., Greenwood, B.M., D’Alessandro, U., and Roca, A. (2016). The large contribution of twins to neonatal and post-neonatal mortality in The Gambia, a 5-year prospective study. BMC Pediatrics 16:39.
- Monden, C. and Smits, J. (2017). Mortality among twins and singletons in sub-Saharan Africa between 1995 and 2014: a pooled analysis of data from 90 Demographic and Health Surveys in 30 countries. Lancet Global Health5(7), PE673-E679.
- Office for National Statistics (ONS). (2012). Live births, stillbirths and infant deaths, Babies Born in 2009 in England and Wales Statistical Bulletin.
- Oliver, J. (2006). Twin resources. Swindon, UK: Economic and Social Research Council.
- Pison, G., Monden, C., and Smits, J. (2015). Twinning rates in developed countries: Trends and explanations. Population and Development Review 41(4): 629–649.
- Pongou R. (2013). Why is infant mortality higher in boys than in girls? A new hypothesis based on preconception environment and evidence from a large sample of twins. Demography 50(2): 421-444.
- Pongou, R., Shapiro, D., and Tenikue, M. (2019). Mortality convergence of twins and singletons in sub-Saharan Africa. Demographic Research 41(36): 1047-1058.
- Smits, J. and Monden. C. (2011). Twinning across the developing world. PLoS ONE 6(9): e25239. doi:10.1371/journal.pone.0025239.
- United Nations Children’s Fund. (2015). Levels & Trends in Child Mortality. Report 2015.