by Esteban Ortiz-Ospina and Max Roser : в деньгах счастье
The World Happiness Report is a well-known source of cross-country data and research on self-reported life satisfaction. The map below shows, country by country, the ‘happiness scores’ published in the World Happiness Report 2017.
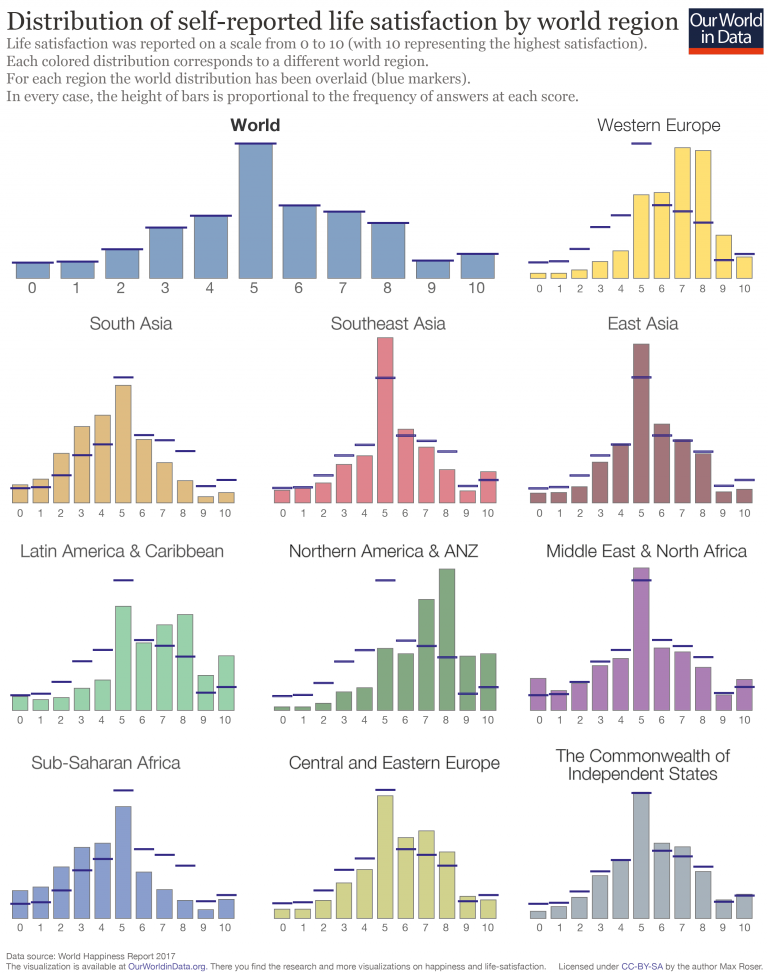
The underlying source of the happiness scores in the World Happiness Report is the Gallup World Poll—a set of nationally representative surveys undertaken in more than 160 countries in over 140 languages. The main life evaluation question asked in the poll is: “Please imagine a ladder, with steps numbered from 0 at the bottom to 10 at the top. The top of the ladder represents the best possible life for you and the bottom of the ladder represents the worst possible life for you. On which step of the ladder would you say you personally feel you stand at this time?” (Also known as the “Cantril Ladder”.)
The map below plots the average answer that survey-respondents provided to this question in different countries. As with the steps of the ladder, values in the map range from 0 to 10.
There are large differences across countries. According to 2016 figures, Nordic countries top the ranking: Finland, Norway, Denmark, the Netherlands and Iceland have the highest scores (all with averages above 7). In the same year, the lowest national scores correspond to Central African Republic, South Sudan, Tanzania, Rwanda and Haiti (all with average scores below 3.5).
You can click on any country on the map to plot time-series for specific countries.
As we can see, self-reported life satisfaction correlates with other measures of well-being—richer and healthier countries tend to have higher average happiness scores. (More on this in the section below.)
If you are interested in data on country-level distributions of scores, the Pew Global Attitudes Survey provides such figures for more than 40 countries.

No comments:
Post a Comment